Technical & Derivatives Report
April 21, 2016
Sensex (25844) / Nifty (7915)
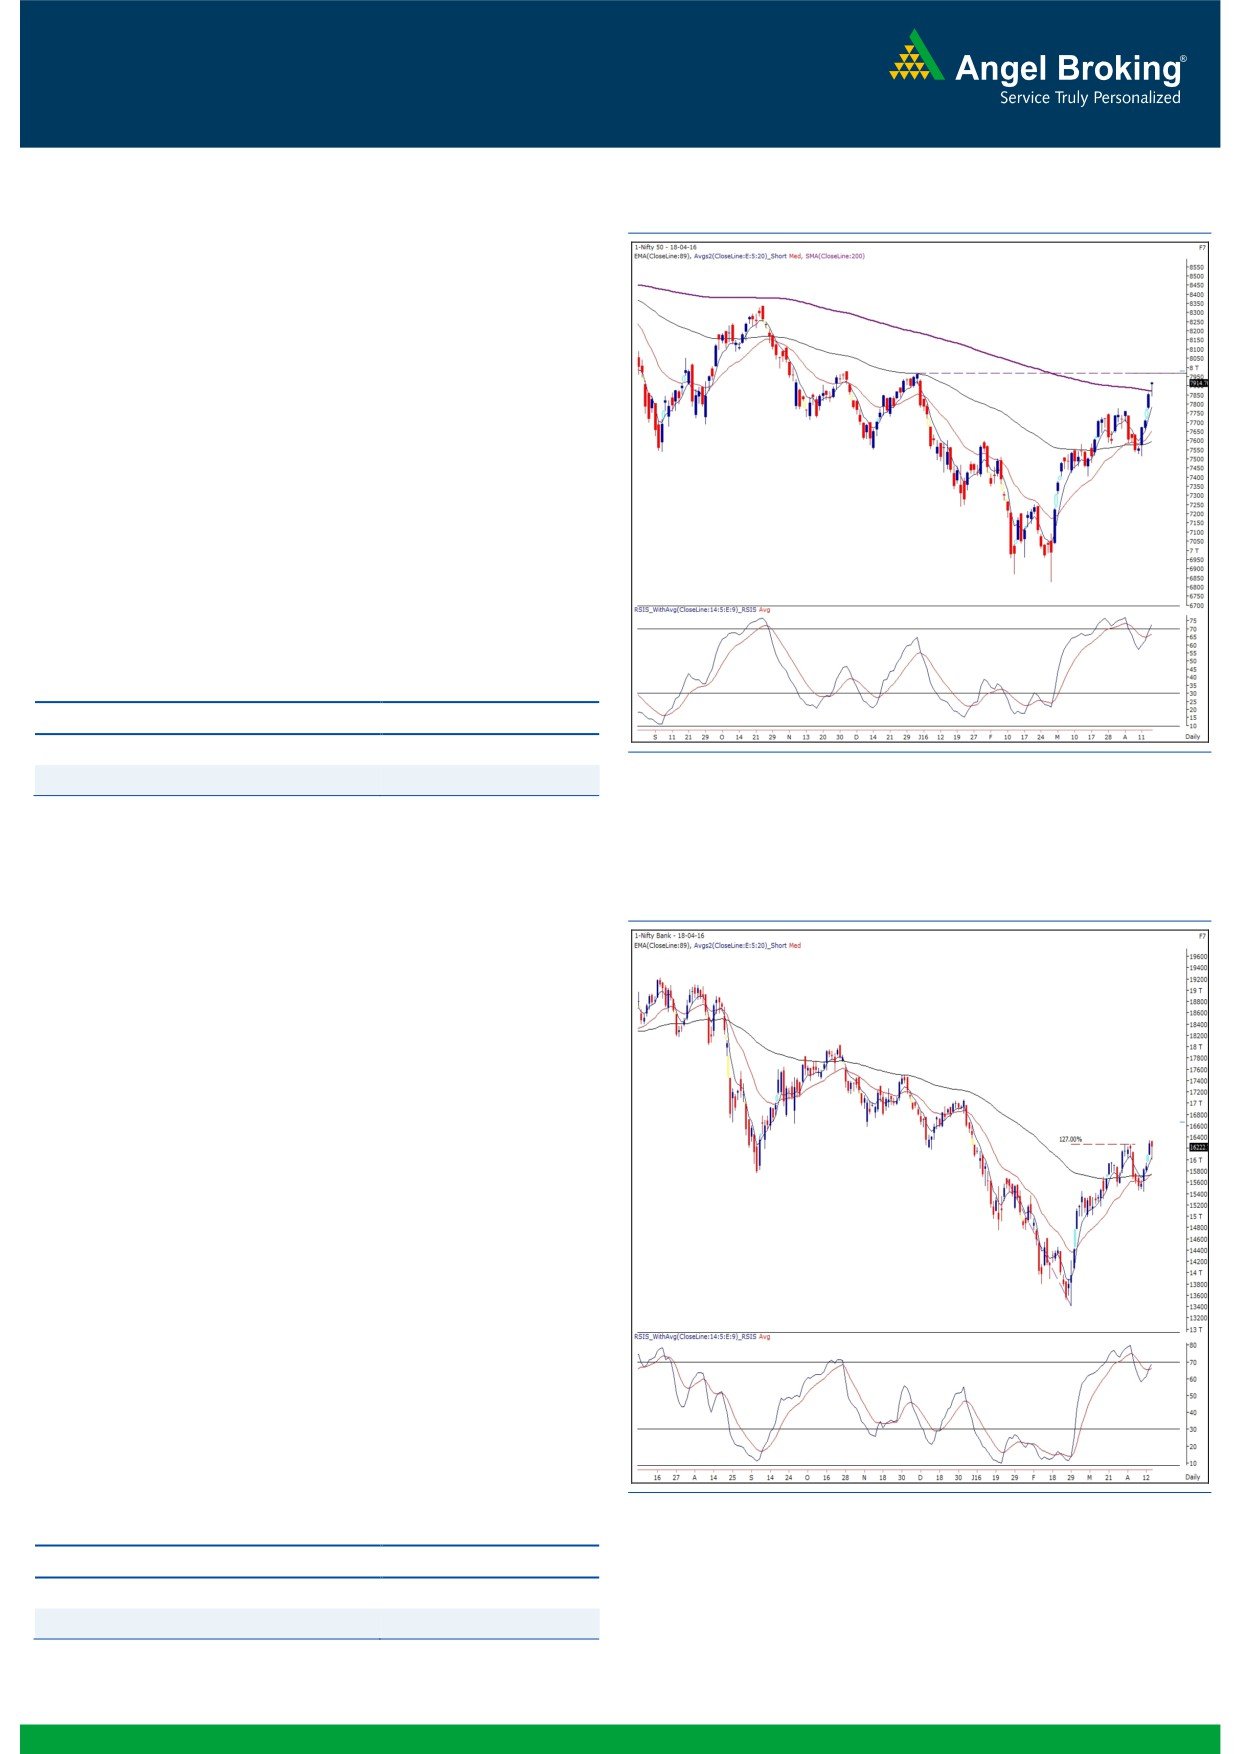
Exhibit 1: Nifty Daily Chart
Yesterday, we saw Nifty opening with an upside gap owing to
positive global cues on Tuesday. However, the index corrected
immediately post the opening tick and registered almost an
‘Open High’, which remained a strong hurdle for the day. Due to
minor dip during the day, the Nifty ended the session almost at
the same level where it closed on Monday.
With reference to our previous report, we witnessed a hint of
profit booking after entering mentioned resistance zone of 7930 -
7972. We maintain our wait n watch approach at this juncture
and would advise traders to lighten up existing longs until Nifty
doesn’t indicate a breakout beyond the 8000 mark. In case of a
continued profit booking, we may see Nifty correcting back to
7842 - 7775 levels. Traders are advised to keep focusing on
individual stocks which have a strong chart structure.
Key Levels
Support 1 - 7842
Resistance 1 - 7930
Support 2 - 7775
Resistance 2 - 7972
Exhibit 2: Nifty Bank Daily Chart
Nifty Bank Outlook - (16350)
Yesterday, The Nifty Bank index traded in a narrow range and
eventually ended the session with gains of 0.78% over its previous
close.
The banking index has ended the session marginally positive led
by some private sector banks. However, the index is hovering
near its resistance zone of
16500-16550, which is
127%
reciprocal retracement level of the previous corrective move from
16283 to 15440. The mentioned resistance level coincides with
the ‘Super Trend’ resistance and ’89 EMA’ on weekly chart.
Hence, although the index may move marginally higher from
current levels, the cluster of resistances suggests that traders
should not create fresh long positions in the index. In fact, at
higher levels, it would be a prudent strategy to book profits on
long positions. Unless any reversal signs seen, stock specific
positive action may continue, which traders should concentrate on
with proper risk management strategy. The intraday support for
the index is placed in range of
16150 -
16080 whereas
resistances are seen around 16450 and 16510.
Key Levels
Support 1 - 16150
Resistance 1 - 16450
Support 2 - 16080
Resistance 2 - 16510
1
Technical & Derivatives Report
April 21, 2016
Comments
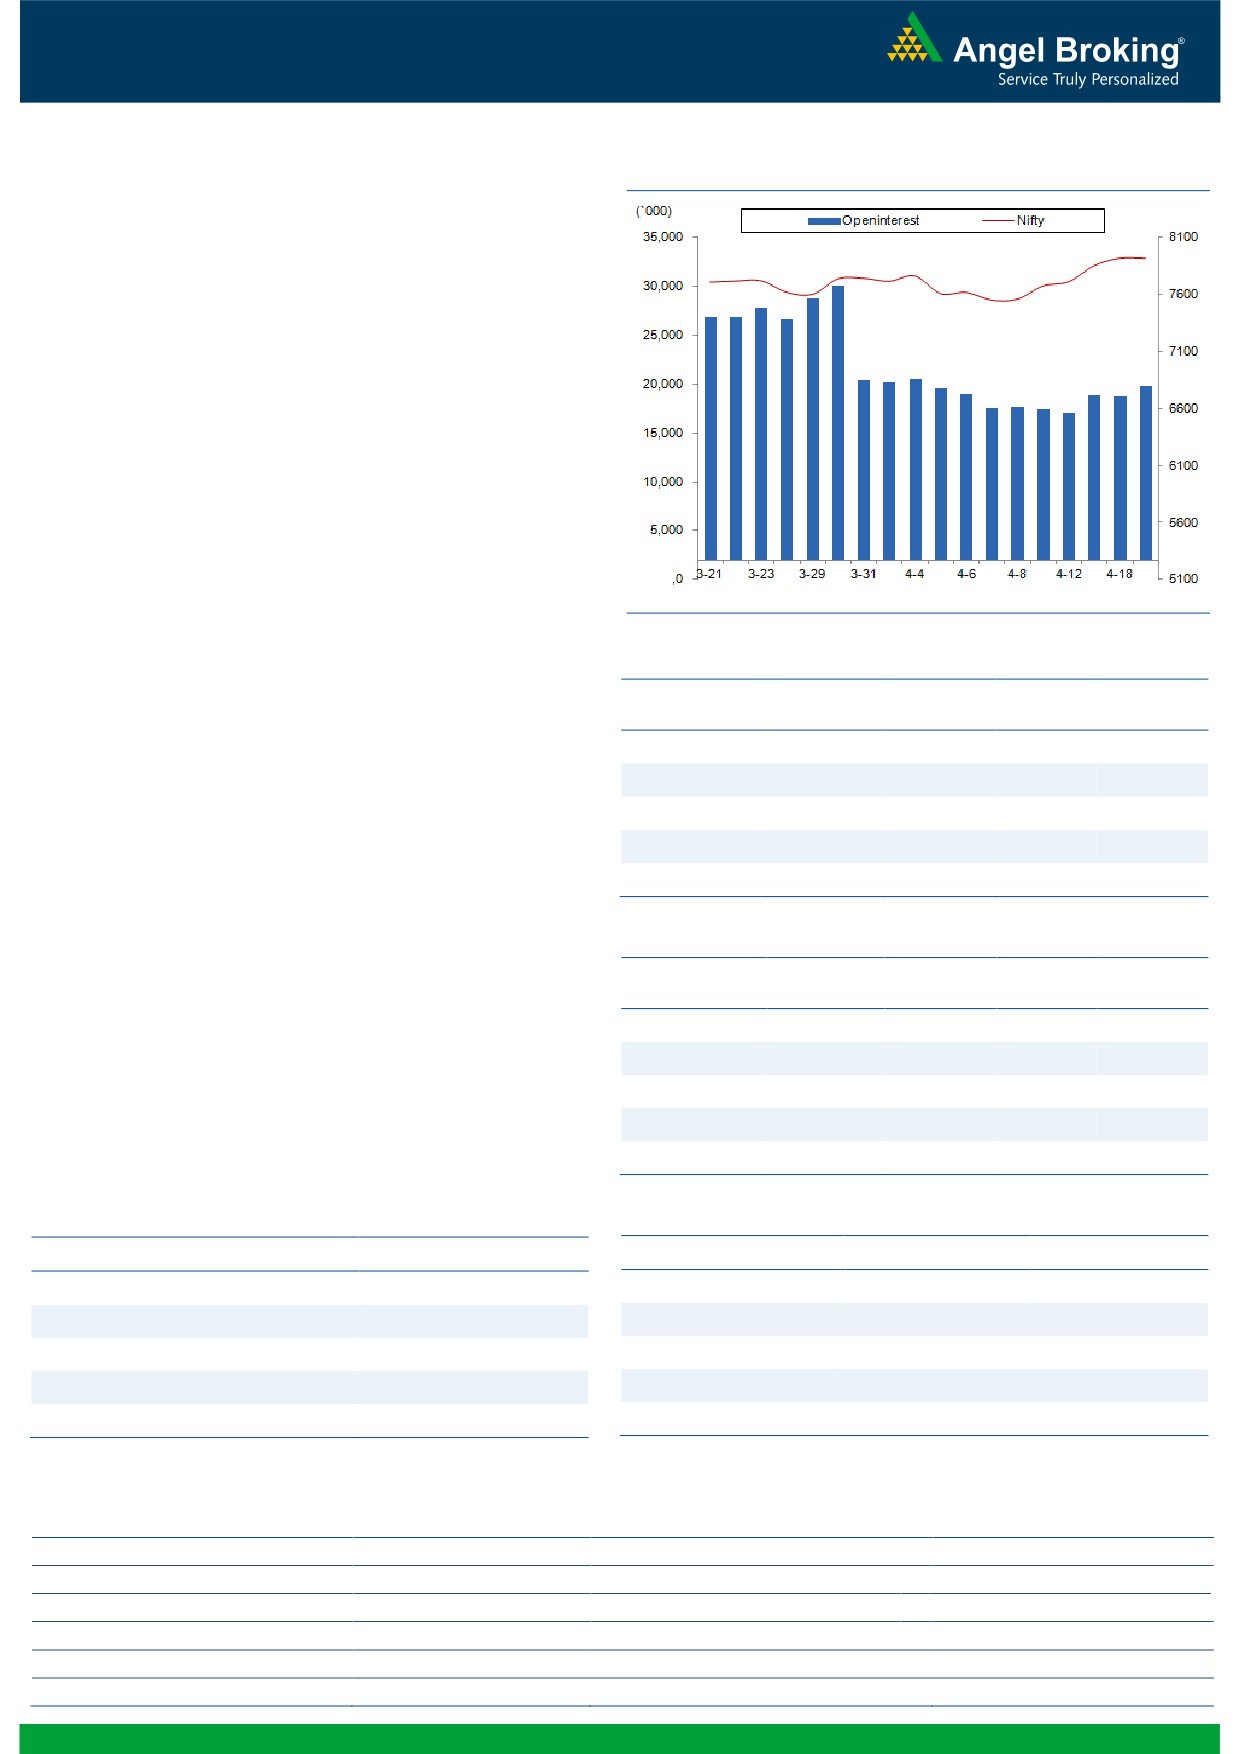
Nifty Vs OI
The Nifty futures open interest has increased by 5.59%
BankNifty futures open interest has increased by 9.70%
as market closed at 7914.75 levels.
The Nifty April future closed at a premium of 15.10
points against a premium of 5.60 points. The May series
closed at a premium of 55.15 points.
The Implied Volatility of at the money options has
decreased from 15.16% to 15.13%.
The total OI of the market is Rs. 2,30,491/- cr. and the
stock futures OI is Rs. 58,946/- cr.
Few of the liquid counters where we have seen high cost
of carry are JPASSOCIAT, NHPC, NMDC, APOLLOHOSP
and M&M.
Views
FIIs activity in cash market segment was subdued. While
OI Gainers
in Index Futures, they continue buying of Rs. 1328 crores
OI
PRICE
SCRIP
OI
PRICE
with good amount of rise in OI, suggesting fresh long
CHG. (%)
CHG. (%)
formation in last trading session.
UBL
951500
24.30
768.90
-2.23
UNIONBANK
10926000
20.48
127.60
-0.47
In Index Options front, FIIs were net sellers of Rs. 1152
crores with some rise in OI. In call options, 8100 strike
WIPRO
8776000
20.45
603.85
2.23
from past 2-3 trading sessions has been continuously
PETRONET
5409000
16.47
268.00
-1.54
adding fresh longs. Some unwinding was visible in 8000
IGL
1636800
13.50
573.45
0.92
call options, which may be covering by writers of this call
option. Whereas, 7900 put options added good amount
OI Losers
of OI, we believe FIIs are writing this strike expecting
OI
PRICE
SCRIP
OI
PRICE
expiry above these levels. Maximum OI in current series
CHG. (%)
CHG. (%)
is visible in 8000 call and of put options has shifted from
CONCOR
382800
-10.56
1381.60
3.82
7500 to 7800 strike. After continuous profit booking, we
NCC
8776000
-9.71
75.50
1.68
witnessed formation of fresh long positions in Index
MCLEODRUSS
2541000
-8.26
195.35
-1.11
Futures. We expect Nifty to test 8000 levels in current
PAGEIND
65000
-7.87
13555.00
5.89
series, trade accordingly.
GODREJIND
1147900
-6.06
374.05
-0.77
Historical Volatility
Put-Call Ratio
SCRIP
HV
SCRIP
PCR-OI
PCR-VOL
TV18BRDCST
54.72
NIFTY
1.08
1.04
CESC
34.69
BANKNIFTY
1.02
0.94
VEDL
79.98
SBIN
0.35
0.27
TATACHEM
46.93
INFY
0.60
0.47
TATASTEEL
59.31
TCS
0.67
0.65
Strategy Date
Symbol
Strategy
Status
April 04, 2016
TCS
Ratio Bear Put Spread
Active
April 11, 2016
ITC
Short Strangle
Active
April 18, 2016
NIFTY
Long Call
Active
2
Technical & Derivatives Report
April 21, 2016
FII Statistics for 20-April 2016
Turnover on 20-April 2016
Open Interest
No. of
Turnover
Change
Detail
Buy
Sell
Net
Instrument
Value
Contracts
( in Cr. )
(%)
Contracts
Change (%)
(in Cr.)
INDEX
INDEX
3234.08
1906.02
1328.05
254055
14745.94
5.09
316042
17564.00
18.14
FUTURES
FUTURES
INDEX
INDEX
36219.37
37371.16
(1151.79)
1164158
68309.02
2.11
4113294
239293.19
33.87
OPTIONS
OPTIONS
STOCK
5112.36
5689.70
(577.33)
1006286
48698.24
0.07
STOCK
FUTURES
655237
33175.81
20.58
FUTURES
STOCK
STOCK
3694.74
3706.27
(11.53)
87151
4280.48
5.82
OPTIONS
418656
21734.72
7.05
OPTIONS
TOTAL
48260.55
48673.14
(412.60)
2511650
136033.69
1.69
TOTAL
5503229
311767.72
29.13
Nifty Spot = 7914.75
Lot Size = 75
Bull-Call Spreads
Bear-Put Spreads
Action
Strike
Price
Risk
Reward
BEP
Action
Strike
Price
Risk
Reward
BEP
Buy
7900
86.45
Buy
7900
56.30
48.10
51.90
7948.10
28.00
72.00
7872.00
Sell
8000
38.35
Sell
7800
28.30
Buy
7900
86.45
Buy
7900
56.30
73.50
126.50
7973.50
42.30
157.70
7857.70
Sell
8100
12.95
Sell
7700
14.00
Buy
8000
38.35
Buy
7800
28.30
25.40
74.60
8025.40
14.30
85.70
7785.70
Sell
8100
12.95
Sell
7700
14.00
Note: Above mentioned Bullish or Bearish Spreads in Nifty (April Series) are given as an information and not as a recommendation.
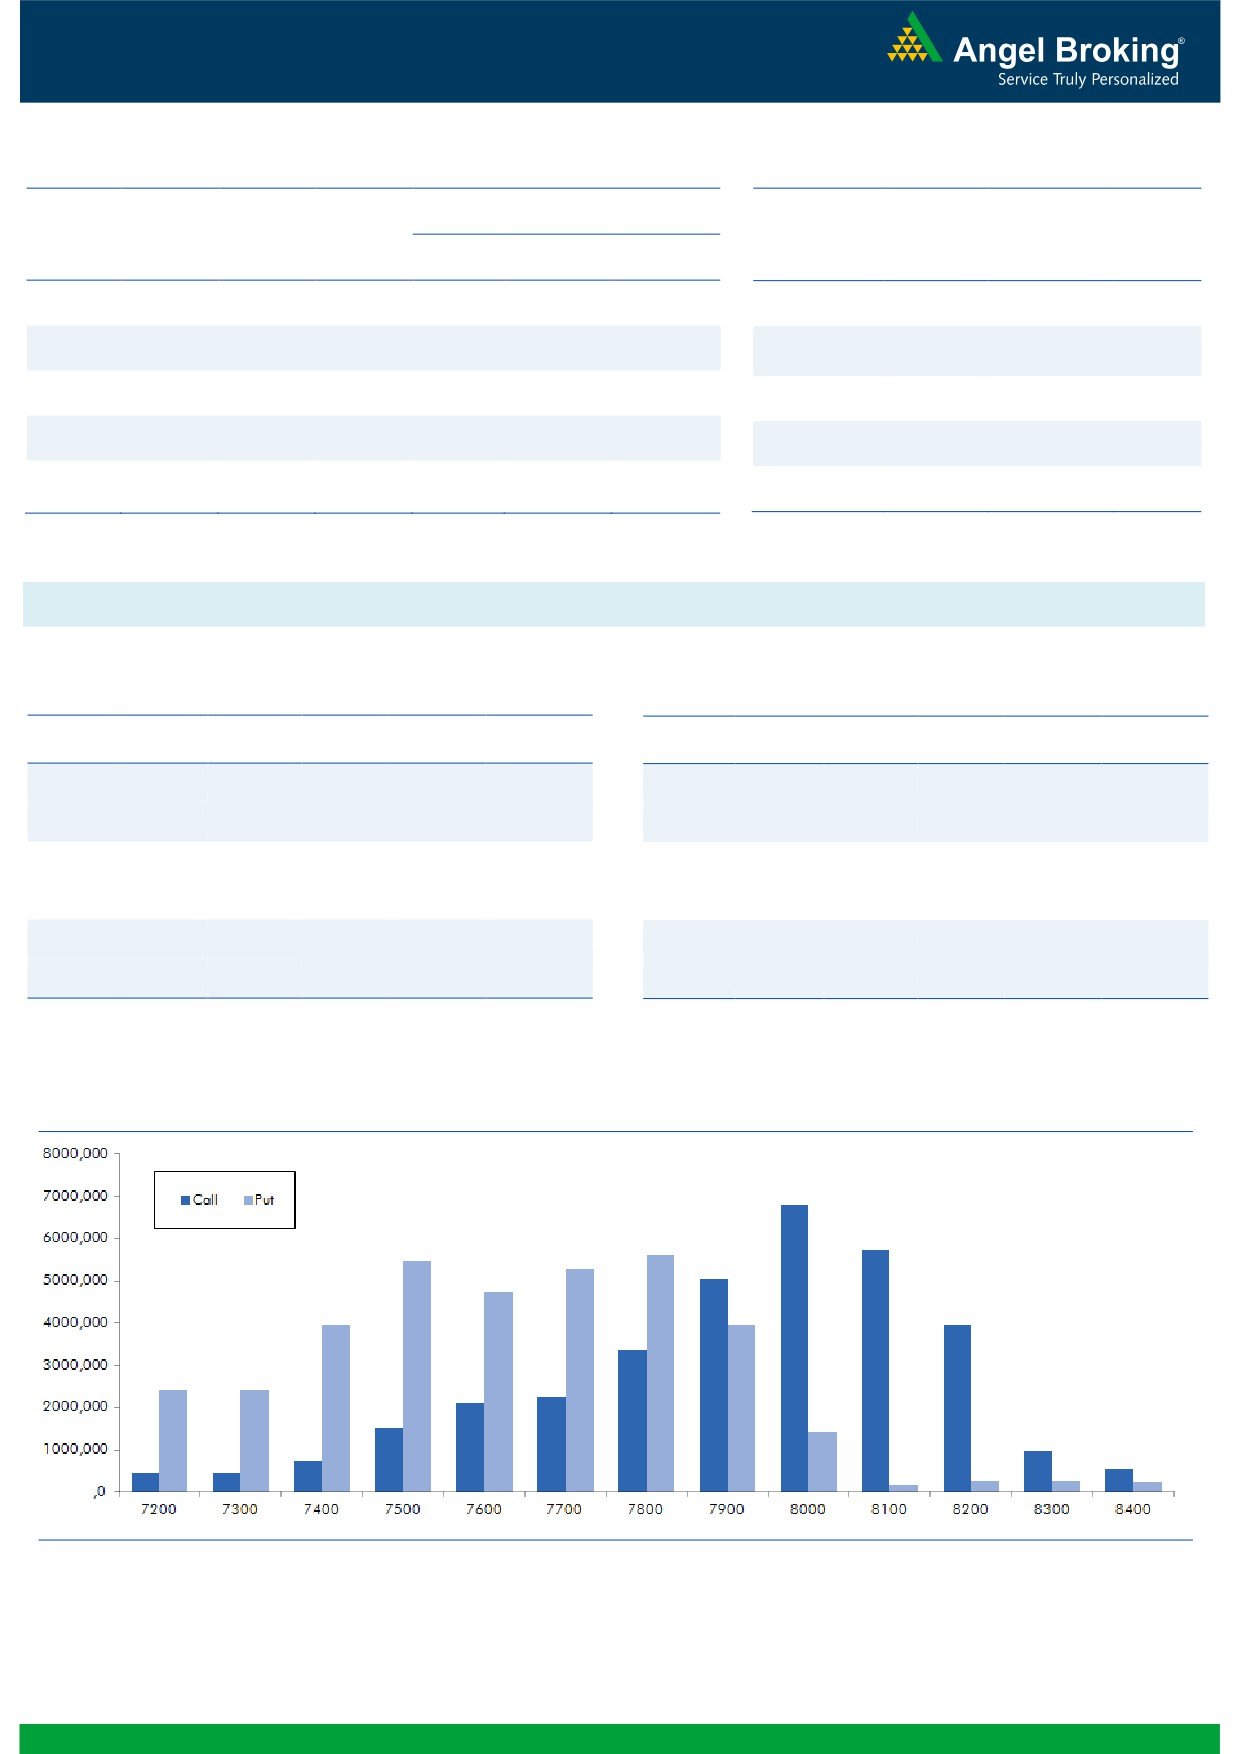
Nifty Put-Call Analysis
3
Technical & Derivatives Report
April 21, 2016
Daily Pivot Levels for Nifty Constituents
Scrips
S2
S1
PIVOT
R1
R2
ACC
1,449
1,458
1,470
1,479
1,491
ADANIPORTS
229
231
234
236
239
AMBUJACEM
222
224
228
230
234
ASIANPAINT
870
878
883
891
895
AUROPHARMA
748
759
777
788
806
AXISBANK
438
449
455
465
471
BAJAJ-AUTO
2,479
2,506
2,539
2,566
2,599
BANKBARODA
144
148
151
155
158
BHEL
131
132
133
134
135
BPCL
940
947
958
966
977
BHARTIARTL
348
353
359
363
369
INFRATEL
375
381
389
395
403
BOSCH
19,687
19,837
20,068
20,219
20,450
CIPLA
514
521
526
532
537
COALINDIA
273
276
279
282
285
DRREDDY
3,082
3,095
3,113
3,126
3,143
EICHERMOT
20,118
20,314
20,447
20,644
20,776
GAIL
353
360
365
373
378
GRASIM
4,017
4,055
4,097
4,135
4,177
HCLTECH
819
830
846
857
873
HDFCBANK
1,077
1,088
1,094
1,104
1,110
HDFC
1,121
1,130
1,145
1,154
1,168
HEROMOTOCO
2,963
3,001
3,040
3,078
3,117
HINDALCO
97
99
101
103
105
HINDUNILVR
888
896
901
909
914
ICICIBANK
232
235
237
241
243
IDEA
113
115
118
120
123
INDUSINDBK
967
977
983
992
998
INFY
1,218
1,230
1,238
1,251
1,259
ITC
330
333
335
338
341
KOTAKBANK
675
681
686
693
698
LT
1,241
1,253
1,261
1,273
1,281
LUPIN
1,539
1,557
1,573
1,592
1,608
M&M
1,283
1,302
1,323
1,343
1,364
MARUTI
3,607
3,636
3,680
3,709
3,754
NTPC
138
140
141
142
143
ONGC
207
208
209
211
212
POWERGRID
143
145
148
150
152
RELIANCE
1,014
1,026
1,047
1,059
1,081
SBIN
182
185
187
189
191
SUNPHARMA
819
824
830
835
841
TCS
2,380
2,415
2,475
2,510
2,570
TATAMTRDVR
295
298
302
306
309
TATAMOTORS
395
400
405
409
415
TATAPOWER
69
70
71
72
73
TATASTEEL
330
344
351
365
373
TECHM
470
477
483
489
495
ULTRACEMCO
3,294
3,336
3,395
3,438
3,497
WIPRO
582
592
600
610
617
YESBANK
867
874
885
892
902
ZEEL
390
395
403
408
417
4
Technical & Derivatives Report
April 21, 2016
Research Team Tel: 022 - 39357800
For Technical Queries
For Derivatives Queries
DISCLAIMER
Angel Broking Private Limited (hereinafter referred to as “Angel”) is a registered Member of National Stock Exchange of India Limited,
Bombay Stock Exchange Limited and MCX Stock Exchange Limited. It is also registered as a Depository Participant with CDSL and
Portfolio Manager with SEBI. It also has registration with AMFI as a Mutual Fund Distributor. Angel Broking Private Limited is a
registered entity with SEBI for Research Analyst in terms of SEBI (Research Analyst) Regulations, 2014 vide registration number
INH000000164. Angel or its associates has not been debarred/ suspended by SEBI or any other regulatory authority for accessing
/dealing in securities Market. Angel or its associates including its relatives/analyst do not hold any financial interest/beneficial
ownership of more than 1% in the company covered by Analyst. Angel or its associates/analyst has not received any compensation /
managed or co-managed public offering of securities of the company covered by Analyst during the past twelve months. Angel/analyst
has not served as an officer, director or employee of company covered by Analyst and has not been engaged in market making activity
of the company covered by Analyst.
This document is solely for the personal information of the recipient, and must not be singularly used as the basis of any investment
decision. Nothing in this document should be construed as investment or financial advice. Each recipient of this document should
make such investigations as they deem necessary to arrive at an independent evaluation of an investment in the securities of the
companies referred to in this document (including the merits and risks involved), and should consult their own advisors to determine
the merits and risks of such an investment.
Reports based on technical and derivative analysis center on studying charts of a stock's price movement, outstanding positions and
trading volume, as opposed to focusing on a company's fundamentals and, as such, may not match with a report on a company's
fundamentals.
The information in this document has been printed on the basis of publicly available information, internal data and other reliable
sources believed to be true, but we do not represent that it is accurate or complete and it should not be relied on as such, as this
document is for general guidance only. Angel Broking Pvt. Limited or any of its affiliates/ group companies shall not be in any way
responsible for any loss or damage that may arise to any person from any inadvertent error in the information contained in this report.
Angel Broking Pvt. Limited has not independently verified all the information contained within this document. Accordingly, we cannot
testify, nor make any representation or warranty, express or implied, to the accuracy, contents or data contained within this document.
While Angel Broking Pvt. Limited endeavors to update on a reasonable basis the information discussed in this material, there may be
regulatory, compliance, or other reasons that prevent us from doing so.
This document is being supplied to you solely for your information, and its contents, information or data may not be reproduced,
redistributed or passed on, directly or indirectly.
Neither Angel Broking Pvt. Limited, nor its directors, employees or affiliates shall be liable for any loss or damage that may arise from
or in connection with the use of this information.
Note: Please refer to the important ‘Stock Holding Disclosure' report on the Angel website (Research Section). Also, please refer to the
latest update on respective stocks for the disclosure status in respect of those stocks. Angel Broking Pvt. Limited and its affiliates may
have investment positions in the stocks recommended in this report.
5