Technical & Derivatives Report
January 21, 2016
Sensex (24062) / Nifty (7309)
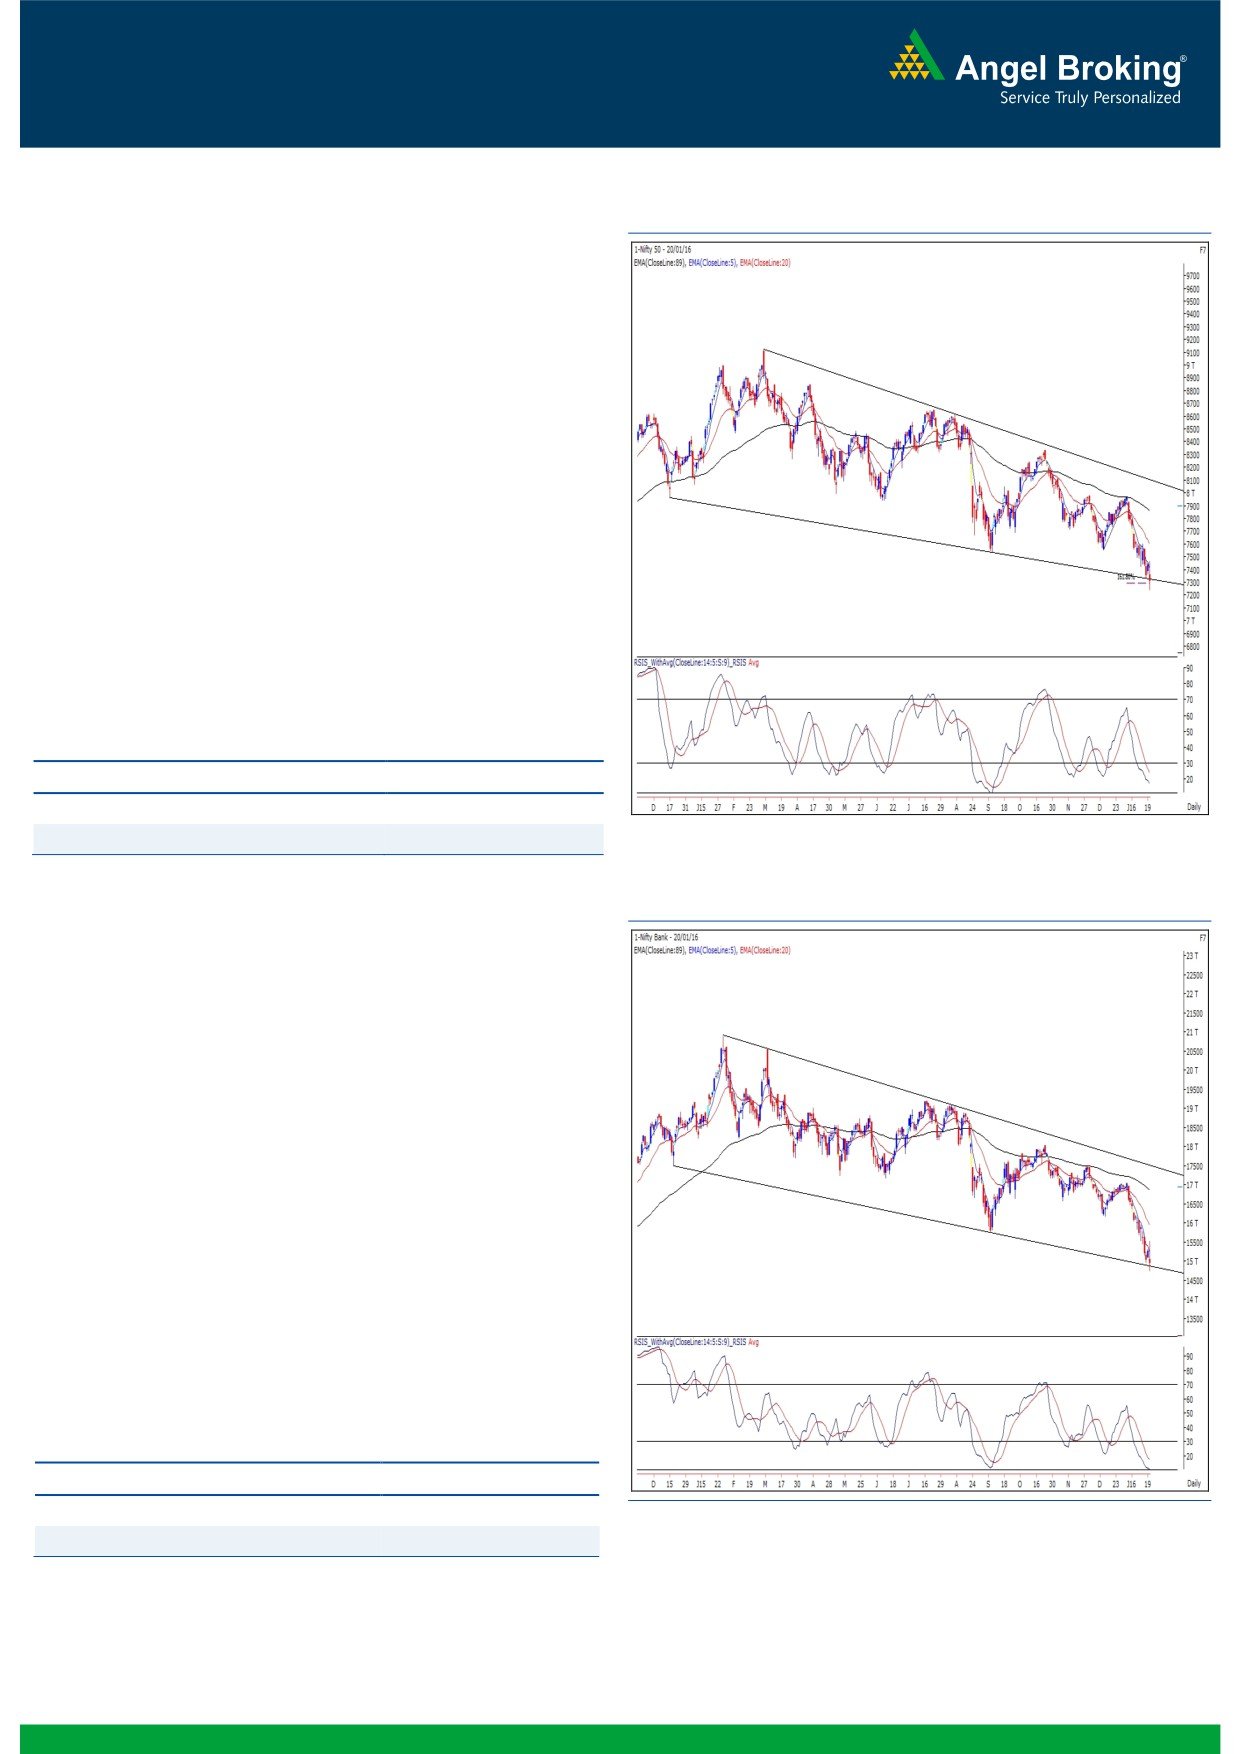
Exhibit 1: Nifty Daily Chart
Yesterday, the Nifty started trading below its previous day’s
low of 7364.15 on back of negative cues from Asian bourses
and started correcting from the initial trades. The fall
accelerated in the second half of the session; wherein, the
index fell below 7250 levels. However, due to some recovery
towards the fag end, the Nifty shaved off some of its intraday
losses. Eventually, Nifty ended the session with loss of 1.69
percent over its previous close. With the decent recovery in the
concluding hour, the Nifty managed to close above the
support of 161.80% retracement levels (7290), which also
coincides with the lower end of the ‘Channel’ in the weekly
chart. Yesterday, the Nifty Future has formed a ‘Hammer’
pattern in the daily chart and a sustainable move above 7365
levels may result into some pullback rally in upcoming
sessions. Going forward, the immediate support for the Nifty is
placed at 7290 and 7240 levels. On the flipside, resistance is
seen at 7425 and 7465 levels.
Key Levels
Support 1 - 7290
Resistance 1 - 7425
Support 2 - 7240
Resistance 2 - 7465
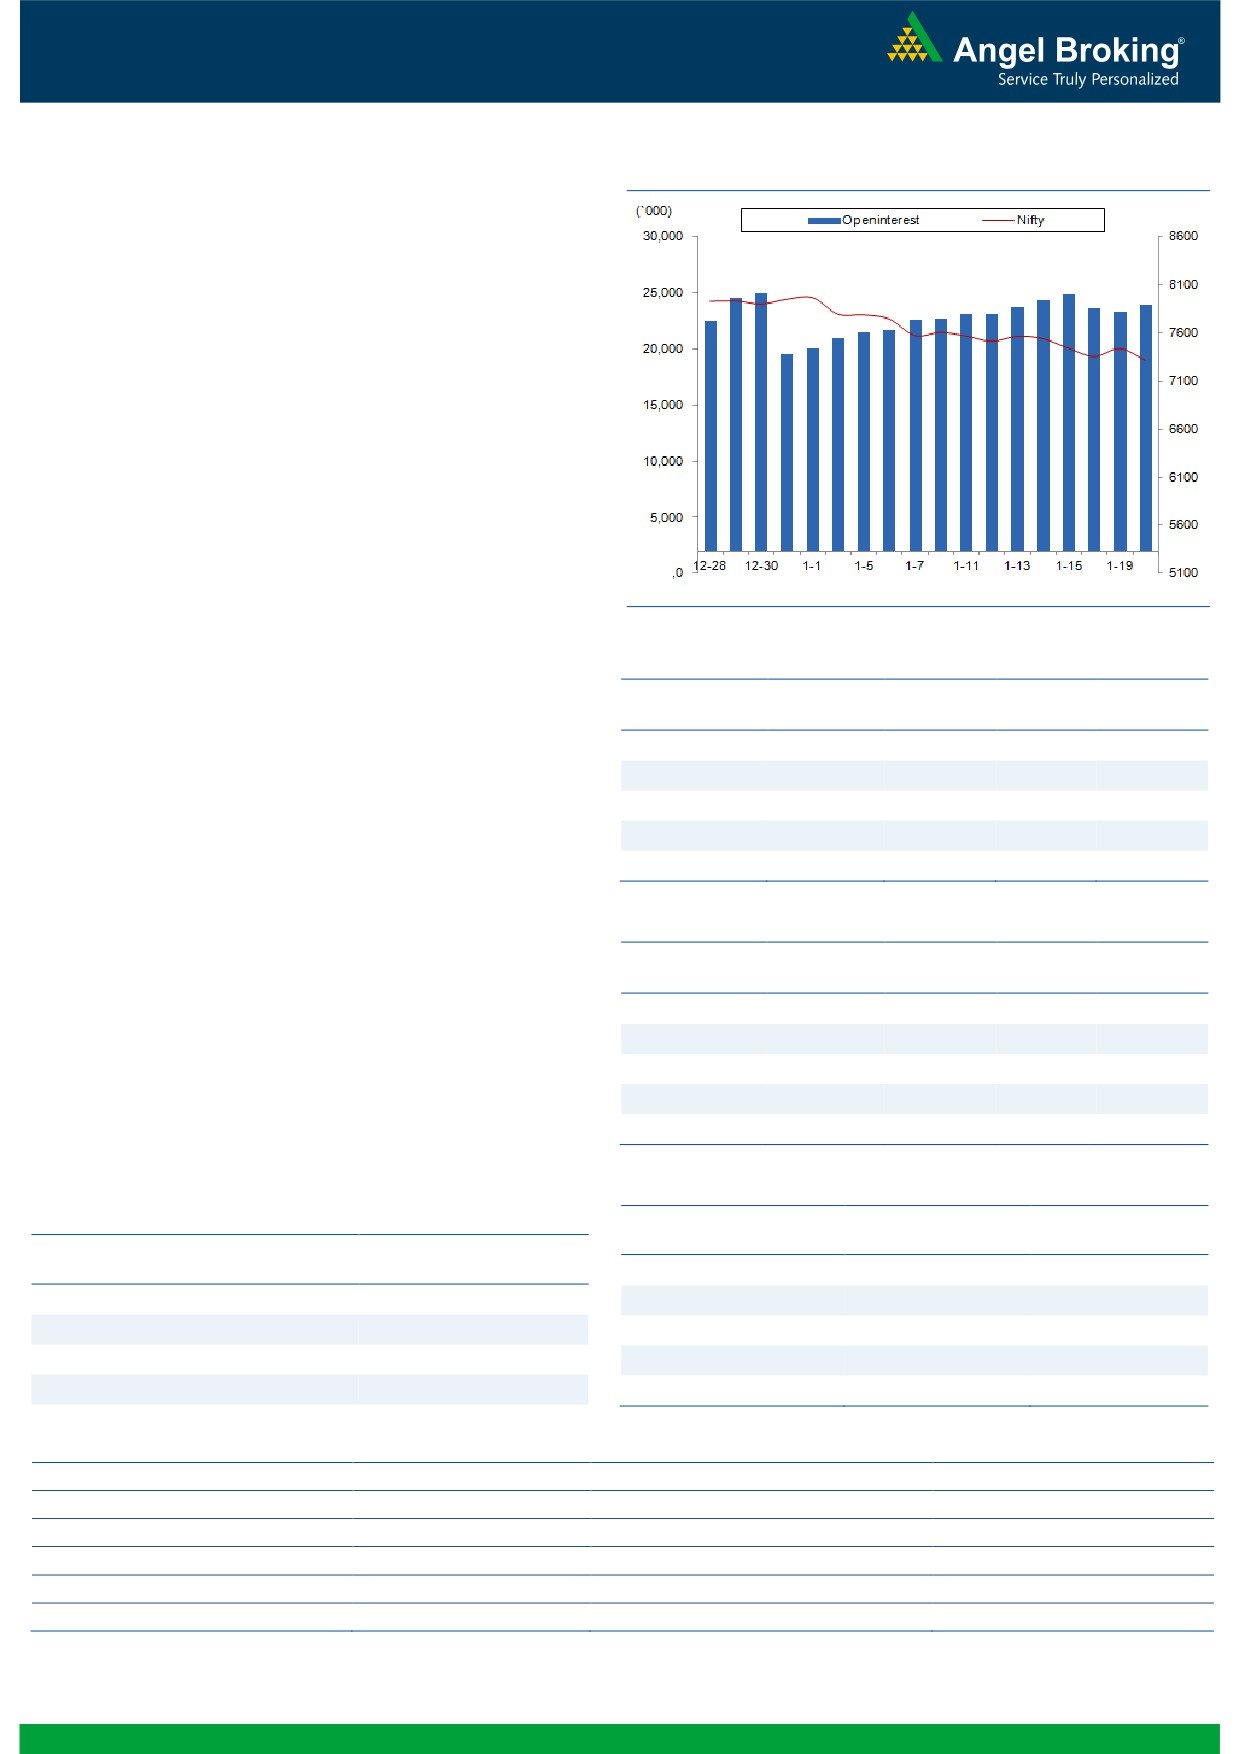
Exhibit 2: Bank Nifty Daily Chart
Bank Nifty Outlook - (14936)
In-line with the benchmark indices, once again, the Nifty Bank
index too opened with the deep loss of more than a percent in
yesterday’s session. Post the gap down opening, the banking
index started correcting from the first tick and continued to
make lower lows. However, we witnessed some buying interest
at the lower levels and as a result, the Nifty Bank index
trimmed off some of its intraday losses. Eventually, the Nifty
Bank index ended the session with the deep loss of 2.19
percent over its previous close. Yesterday, the banking index
has bounced from its support zone of 14700 - 15000 zone in
the weekly chart and is currently trading around the lower end
of the ‘Falling Channel’ in the daily chart. Going forward, the
immediate support for the banking index is placed at 14830
and 14700 levels. On the flipside, a sustainable move above
15100 levels may result into a pullback move towards 15450
levels.
Key Levels
Support 1 - 14830
Resistance 1 - 15100
Support 2 - 14700
Resistance 2 - 15340
1
Technical & Derivatives Report
January 21, 2016
Comments
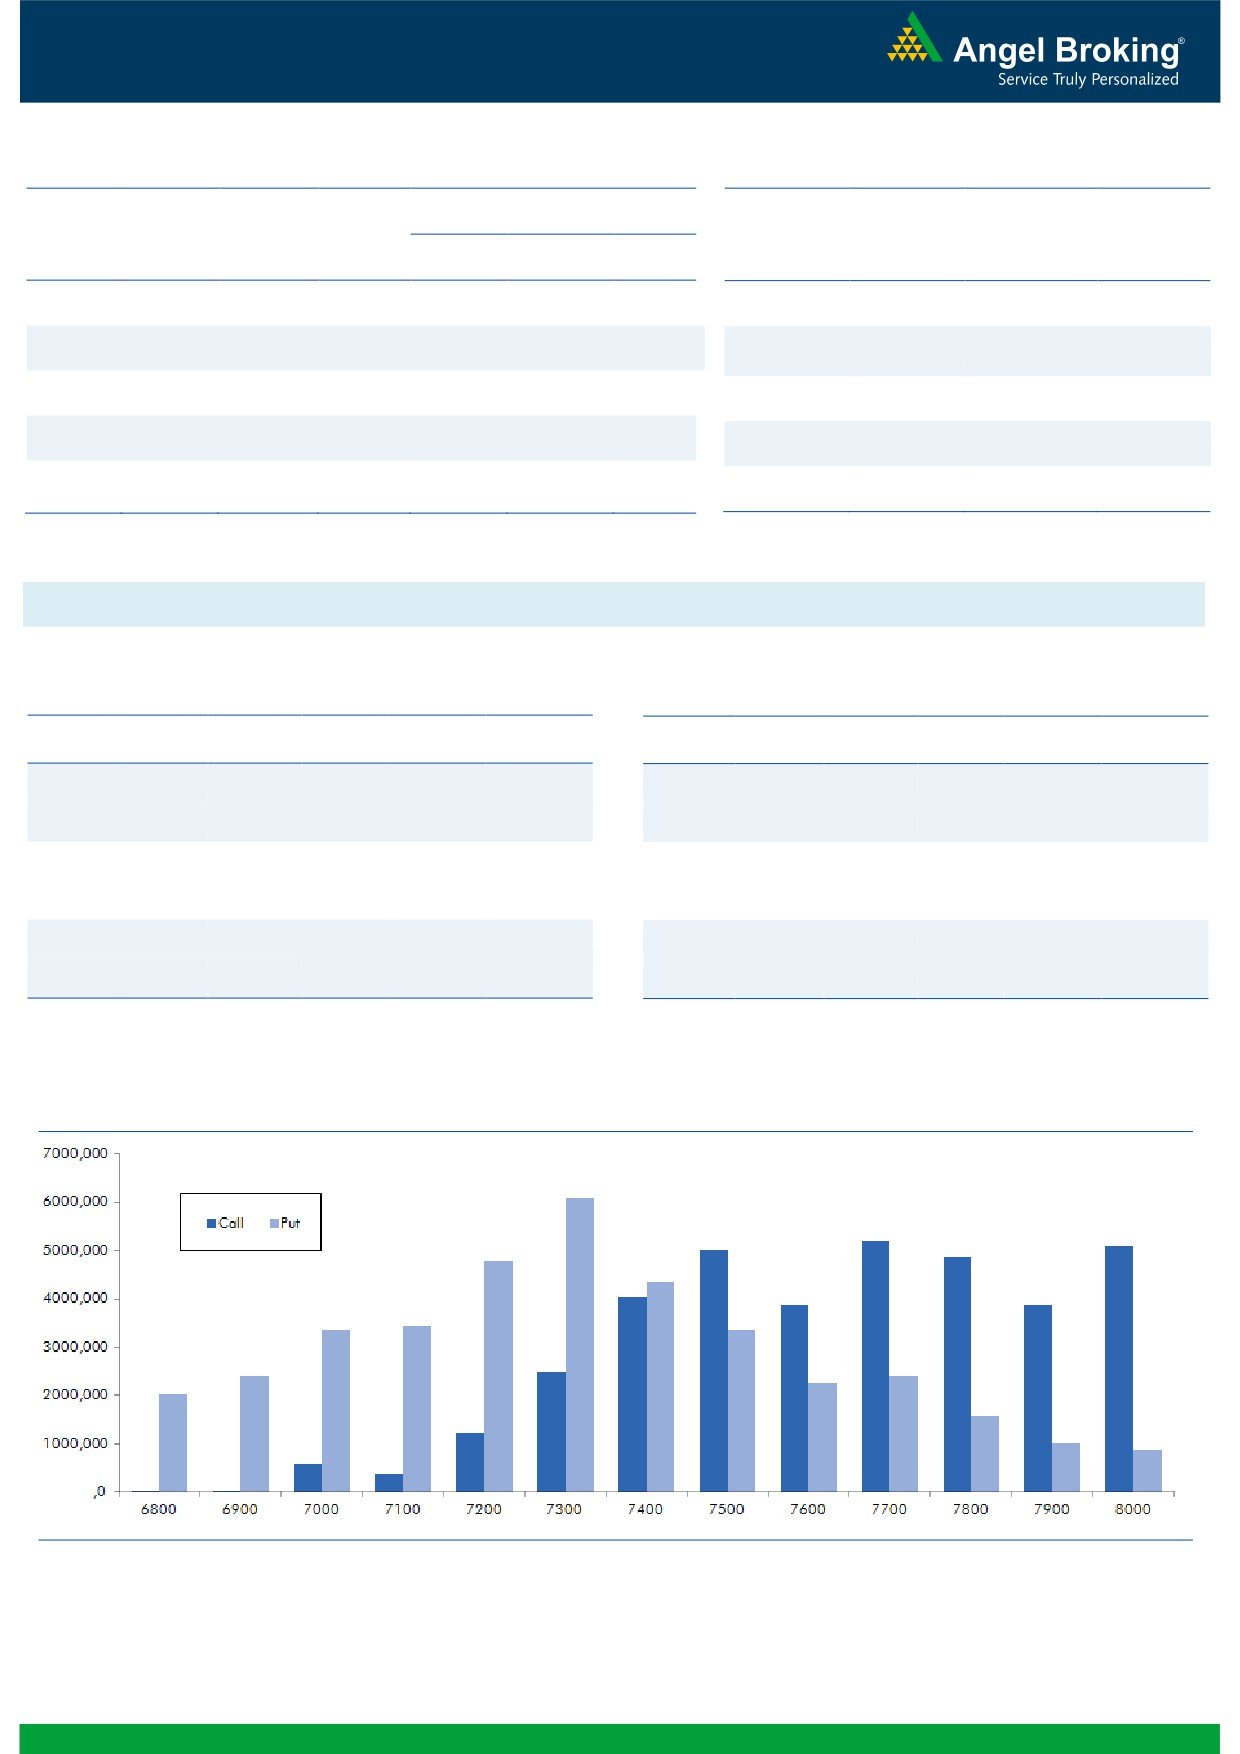
Nifty Vs OI
The Nifty futures open interest has increased by 2.48%
BankNifty futures open interest has increased by 3.51%
as market closed at 7309.30 levels.
The Nifty January future closed at a discount of 2.35
points against a premium of 3.00 points. The February
series closed at a premium of 13.95 points.
The Implied Volatility of at the money options has
increased from 15.94% to 18.57 %.
The total OI of the market is Rs. 2,53,924/- cr. and the
stock futures OI is Rs. 59,792/- cr.
Few of the liquid counters where we have seen high cost
of carry are UNITECH, JISLJALEQS, IDFC, JPASSOCIAT,
and SOUTHBANK.
Views
OI Gainers
In equity segment, FIIs continue to sell to the tune of Rs.
OI
PRICE
1325 crores. In Index Futures, their activity was subdued
SCRIP
OI
PRICE
CHG. (%)
CHG. (%)
in last trading session.
ABIRLANUVO
957250
18.29
885.45
-11.09
In Index Options front, they bought significantly of Rs.
ACC
1650750
13.98
1214.50
-1.88
2607 crores with rise in open interest. In call options,
INFRATEL
2782000
11.46
353.90
-5.35
7200-7400 strikes added good amount of OI with rise in
JUSTDIAL
2183500
8.69
772.10
-1.39
IV’s, this indicates long formation. While decent
JETAIRWAYS
4504500
7.68
653.20
-3.05
unwinding was witness in 7600 call options. Whereas, in
put options, 6800 & 7100 strikes added good amount
OI Losers
for build-up, followed by meaningful unwinding in 7400
OI
PRICE
put option. Maximum build-up in current series is visible
SCRIP
OI
PRICE
CHG. (%)
CHG. (%)
in 7700 call and 7300 put options. At current juncture,
JSWENERGY
11436000
-11.18
69.70
-6.82
we would suggest to trade light in Nifty and adopt stock
MINDTREE
350400
-9.50
1440.90
-0.37
specific approach.
OIL
932400
-8.59
339.40
-1.02
HAVELLS
7060000
-8.36
287.75
0.98
SUNTV
6600000
-8.31
341.55
-7.58
Put-Call Ratio
Historical Volatility
SCRIP
PCR-OI
PCR-VOL
SCRIP
HV
NIFTY
0.83
0.88
ABIRLANUVO
85.95
BANKNIFTY
0.69
0.67
SUNTV
56.84
SBIN
0.30
0.36
UBL
39.34
RELIANCE
0.35
0.42
INFRATEL
42.27
INFY
0.81
0.92
Strategy Date
Symbol
Strategy
Status
January 04, 2016
SBIN
Ratio Bear Put Spread
Loss booked on Jan 15, 2016
January 11, 2016
TCS
Short Strangle
Profit booked on Jan 18, 2016
January 18, 2016
HINDUNILVR
Short Strangle
Active
2
Technical & Derivatives Report
January 21, 2016
FII Statistics for 20-January 2015
Turnover on 20-January 2015
Open Interest
No. of
Turnover
Change
Detail
Buy
Sell
Net
Instrument
Value
Change
Contracts
( in Cr. )
(%)
Contracts
(in Cr.)
(%)
INDEX
INDEX
2553.22
2640.16
(86.94)
310024
16210.17
0.08
404464
20676.75
27.30
FUTURES
FUTURES
INDEX
INDEX
40819.69
38211.29
2608.40
1579351
84798.42
5.00
5240758
284569.93
34.87
OPTIONS
OPTIONS
STOCK
5523.76
4876.80
646.96
1101756
48373.50
(0.24)
STOCK
FUTURES
646445
29058.68
9.08
FUTURES
STOCK
STOCK
4011.52
4102.51
(90.99)
100307
4458.49
5.95
OPTIONS
428536
20531.93
0.46
OPTIONS
TOTAL
52908.19
49830.76
3077.43
3091438
153840.58
2.61
TOTAL
6720203
354837.29
29.35
Nifty Spot = 7309.30
Lot Size = 75
Bull-Call Spreads
Bear-Put Spreads
Action
Strike
Price
Risk
Reward
BEP
Action
Strike
Price
Risk
Reward
BEP
Buy
7300
81.10
Buy
7300
79.35
43.30
56.70
7343.30
33.85
66.15
7266.15
Sell
7400
37.80
Sell
7200
45.50
Buy
7300
81.10
Buy
7300
79.35
66.30
133.70
7366.30
52.85
147.15
7247.15
Sell
7500
14.80
Sell
7100
26.50
Buy
7400
37.80
Buy
7200
45.50
23.00
77.00
7423.00
19.00
81.00
7181.00
Sell
7500
14.80
Sell
7100
26.50
Note: Above mentioned Bullish or Bearish Spreads in Nifty (Jan. Series) are given as an information and not as a recommendation.
Nifty Put-Call Analysis
3
Technical & Derivatives Report
January 21, 2016
Daily Pivot Levels for Nifty 50 Stocks
Scrips
S2
S1
PIVOT
R1
R2
ACC
1,191
1,202
1,215
1,226
1,239
ADANIPORTS
208
214
222
227
235
AMBUJACEM
179
183
189
194
200
ASIANPAINT
816
828
842
854
868
AXISBANK
366
377
385
396
404
BAJAJ-AUTO
2,210
2,244
2,264
2,299
2,319
BANKBARODA
116
118
121
123
126
BHARTIARTL
298
304
309
315
320
BHEL
133
138
141
146
150
BOSCHLTD
17,392
17,645
17,920
18,174
18,449
BPCL
861
873
888
900
914
CAIRN
105
108
111
114
116
CIPLA
580
586
595
602
610
COALINDIA
278
288
302
312
327
DRREDDY
2,832
2,851
2,877
2,896
2,922
GAIL
325
332
340
347
356
GRASIM
3,390
3,433
3,501
3,544
3,613
HCLTECH
814
828
837
851
860
HDFC
1,086
1,111
1,155
1,180
1,224
HDFCBANK
945
981
1,045
1,082
1,145
HEROMOTOCO
2,433
2,461
2,484
2,512
2,535
HINDALCO
64
66
68
70
73
HINDUNILVR
768
782
798
812
828
ICICIBANK
216
220
224
228
232
IDEA
110
114
116
120
122
INDUSINDBK
807
840
900
934
993
INFY
1,090
1,106
1,133
1,149
1,176
ITC
296
303
311
318
326
KOTAKBANK
624
644
672
691
719
LT
1,060
1,088
1,105
1,133
1,150
LUPIN
1,657
1,674
1,697
1,714
1,737
M&M
1,078
1,114
1,137
1,174
1,197
MARUTI
3,931
3,995
4,092
4,156
4,254
NTPC
129
130
133
134
137
ONGC
207
210
213
216
218
PNB
84
86
88
90
92
POWERGRID
125
130
135
140
145
RELIANCE
965
985
1,010
1,030
1,055
SBIN
166
170
175
179
184
VEDL
61
62
65
66
69
SUNPHARMA
762
777
791
807
820
TATAMOTORS
333
337
344
348
354
TATAPOWER
59
60
62
64
65
TATASTEEL
223
228
231
235
238
TCS
2,227
2,254
2,269
2,296
2,311
TECHM
499
503
508
512
517
ULTRACEMCO
2,516
2,567
2,631
2,682
2,746
WIPRO
524
533
543
552
561
YESBANK
607
627
651
671
695
ZEEL
366
375
384
393
402
4
Technical & Derivatives Report
January 21, 2016
Research Team Tel: 022 - 39357800
For Technical Queries
For Derivatives Queries
DISCLAIMER
Angel Broking Private Limited (hereinafter referred to as “Angel”) is a registered Member of National Stock Exchange of India Limited,
Bombay Stock Exchange Limited and MCX Stock Exchange Limited. It is also registered as a Depository Participant with CDSL and
Portfolio Manager with SEBI. It also has registration with AMFI as a Mutual Fund Distributor. Angel Broking Private Limited is a
registered entity with SEBI for Research Analyst in terms of SEBI (Research Analyst) Regulations, 2014 vide registration number
INH000000164. Angel or its associates has not been debarred/ suspended by SEBI or any other regulatory authority for accessing
/dealing in securities Market. Angel or its associates including its relatives/analyst do not hold any financial interest/beneficial
ownership of more than 1% in the company covered by Analyst. Angel or its associates/analyst has not received any compensation /
managed or co-managed public offering of securities of the company covered by Analyst during the past twelve months. Angel/analyst
has not served as an officer, director or employee of company covered by Analyst and has not been engaged in market making activity
of the company covered by Analyst.
This document is solely for the personal information of the recipient, and must not be singularly used as the basis of any investment
decision. Nothing in this document should be construed as investment or financial advice. Each recipient of this document should
make such investigations as they deem necessary to arrive at an independent evaluation of an investment in the securities of the
companies referred to in this document (including the merits and risks involved), and should consult their own advisors to determine
the merits and risks of such an investment.
Reports based on technical and derivative analysis center on studying charts of a stock's price movement, outstanding positions and
trading volume, as opposed to focusing on a company's fundamentals and, as such, may not match with a report on a company's
fundamentals.
The information in this document has been printed on the basis of publicly available information, internal data and other reliable
sources believed to be true, but we do not represent that it is accurate or complete and it should not be relied on as such, as this
document is for general guidance only. Angel Broking Pvt. Limited or any of its affiliates/ group companies shall not be in any way
responsible for any loss or damage that may arise to any person from any inadvertent error in the information contained in this report.
Angel Broking Pvt. Limited has not independently verified all the information contained within this document. Accordingly, we cannot
testify, nor make any representation or warranty, express or implied, to the accuracy, contents or data contained within this document.
While Angel Broking Pvt. Limited endeavors to update on a reasonable basis the information discussed in this material, there may be
regulatory, compliance, or other reasons that prevent us from doing so.
This document is being supplied to you solely for your information, and its contents, information or data may not be reproduced,
redistributed or passed on, directly or indirectly.
Neither Angel Broking Pvt. Limited, nor its directors, employees or affiliates shall be liable for any loss or damage that may arise from
or in connection with the use of this information.
Note: Please refer to the important ‘Stock Holding Disclosure' report on the Angel website (Research Section). Also, please refer to the
latest update on respective stocks for the disclosure status in respect of those stocks. Angel Broking Pvt. Limited and its affiliates may
have investment positions in the stocks recommended in this report.
5