Technical & Derivatives Report
November 20, 2015
Sensex (25842) / Nifty (7843)
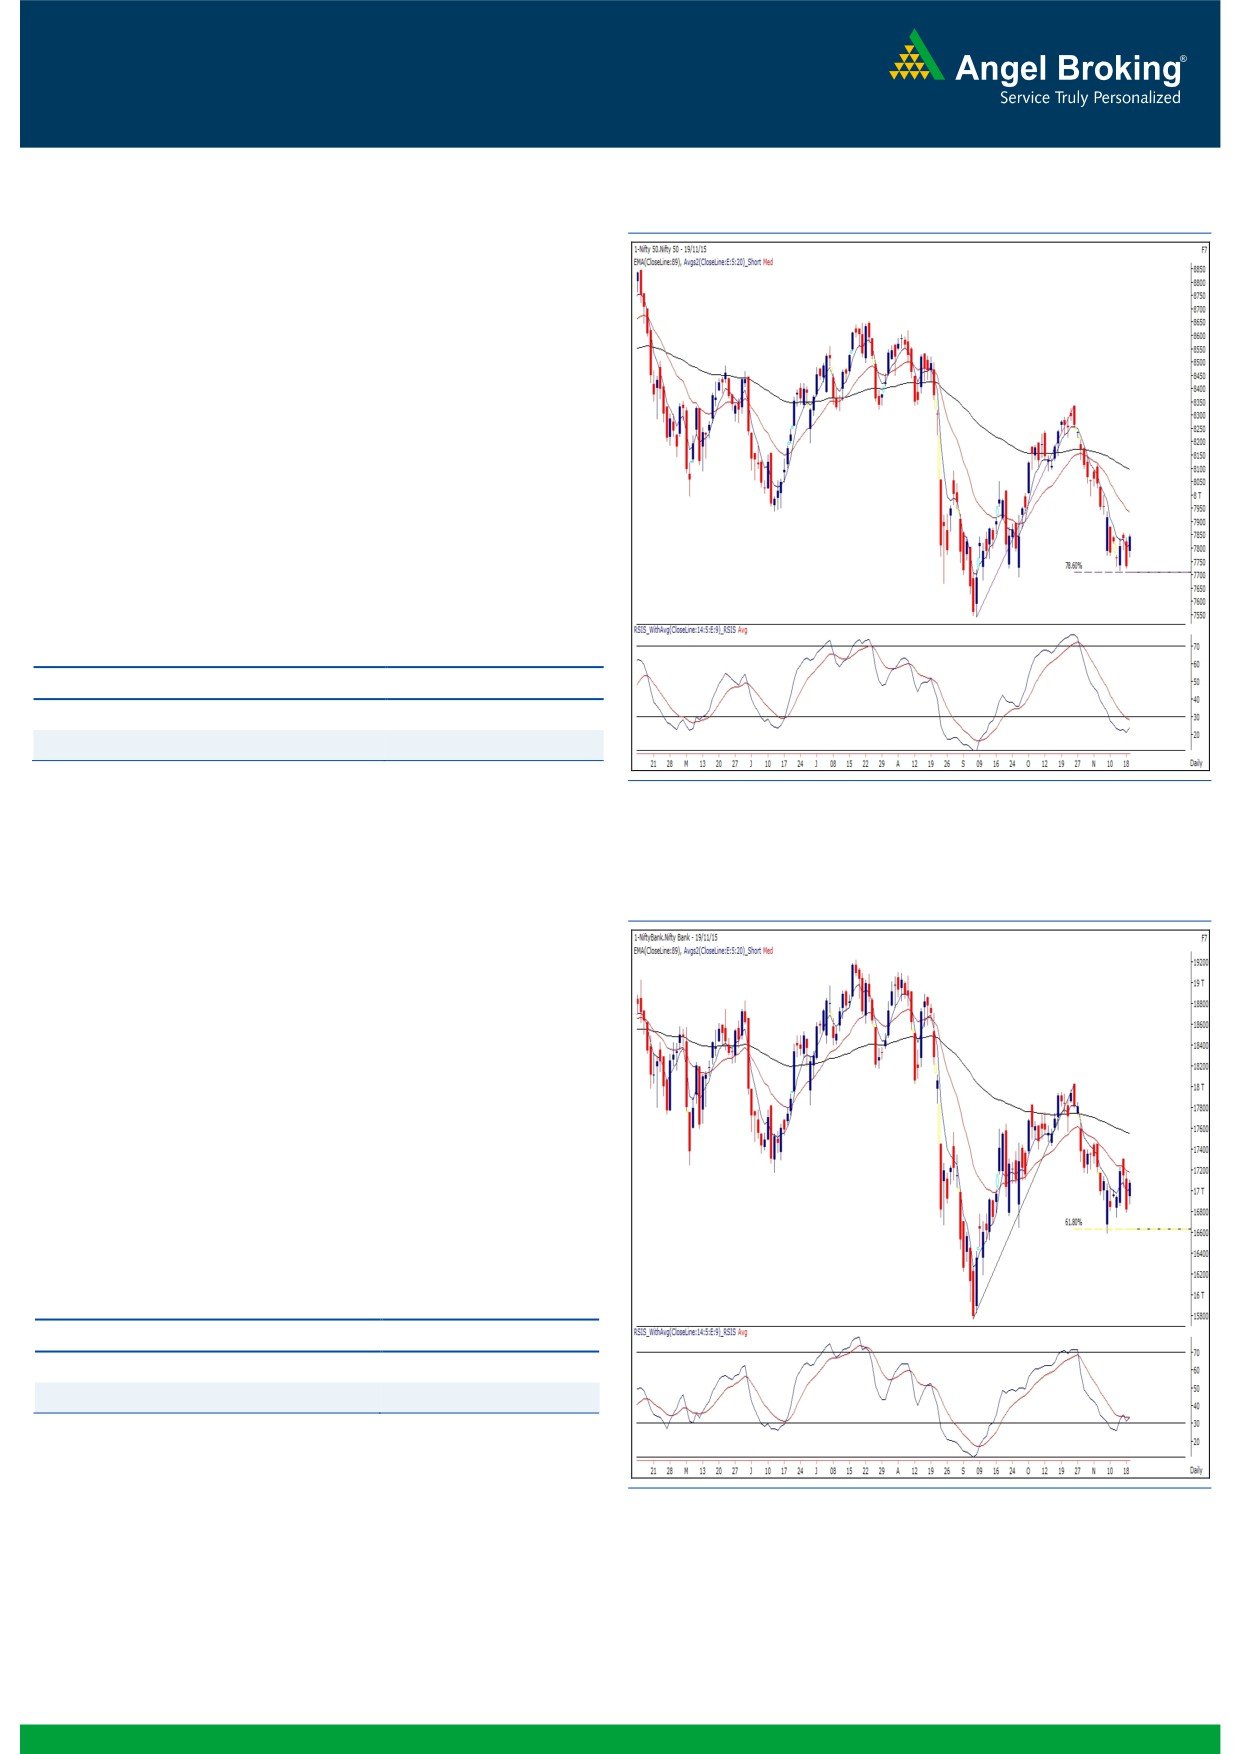
Exhibit 1: Nifty Daily Chart
After an extremely weak session, our markets opened with an
upside gap citing cheerful mood across the globe. This
optimism accelerated as the day progressed and as a result,
the Nifty closed convincingly above the 7800 mark.
Since last few sessions, our market is clearly directionless.
However, in line with our view the 7700 mark is acting as a
sheet anchor for the bulls. Despite a sharp sell off on
Wednesday, our market managed to trim all losses on
Thursday and eventually closed on a strong note. Going
forward, if Nifty sustains above 7860 then we may witness an
extension towards 7900 - 7930 levels. On the flipside, an
intraday support is seen around 7760 level.
Key Levels
Support 1 - 7790
Resistance 1 - 7900
Support 2 - 7760
Resistance 2 - 7930
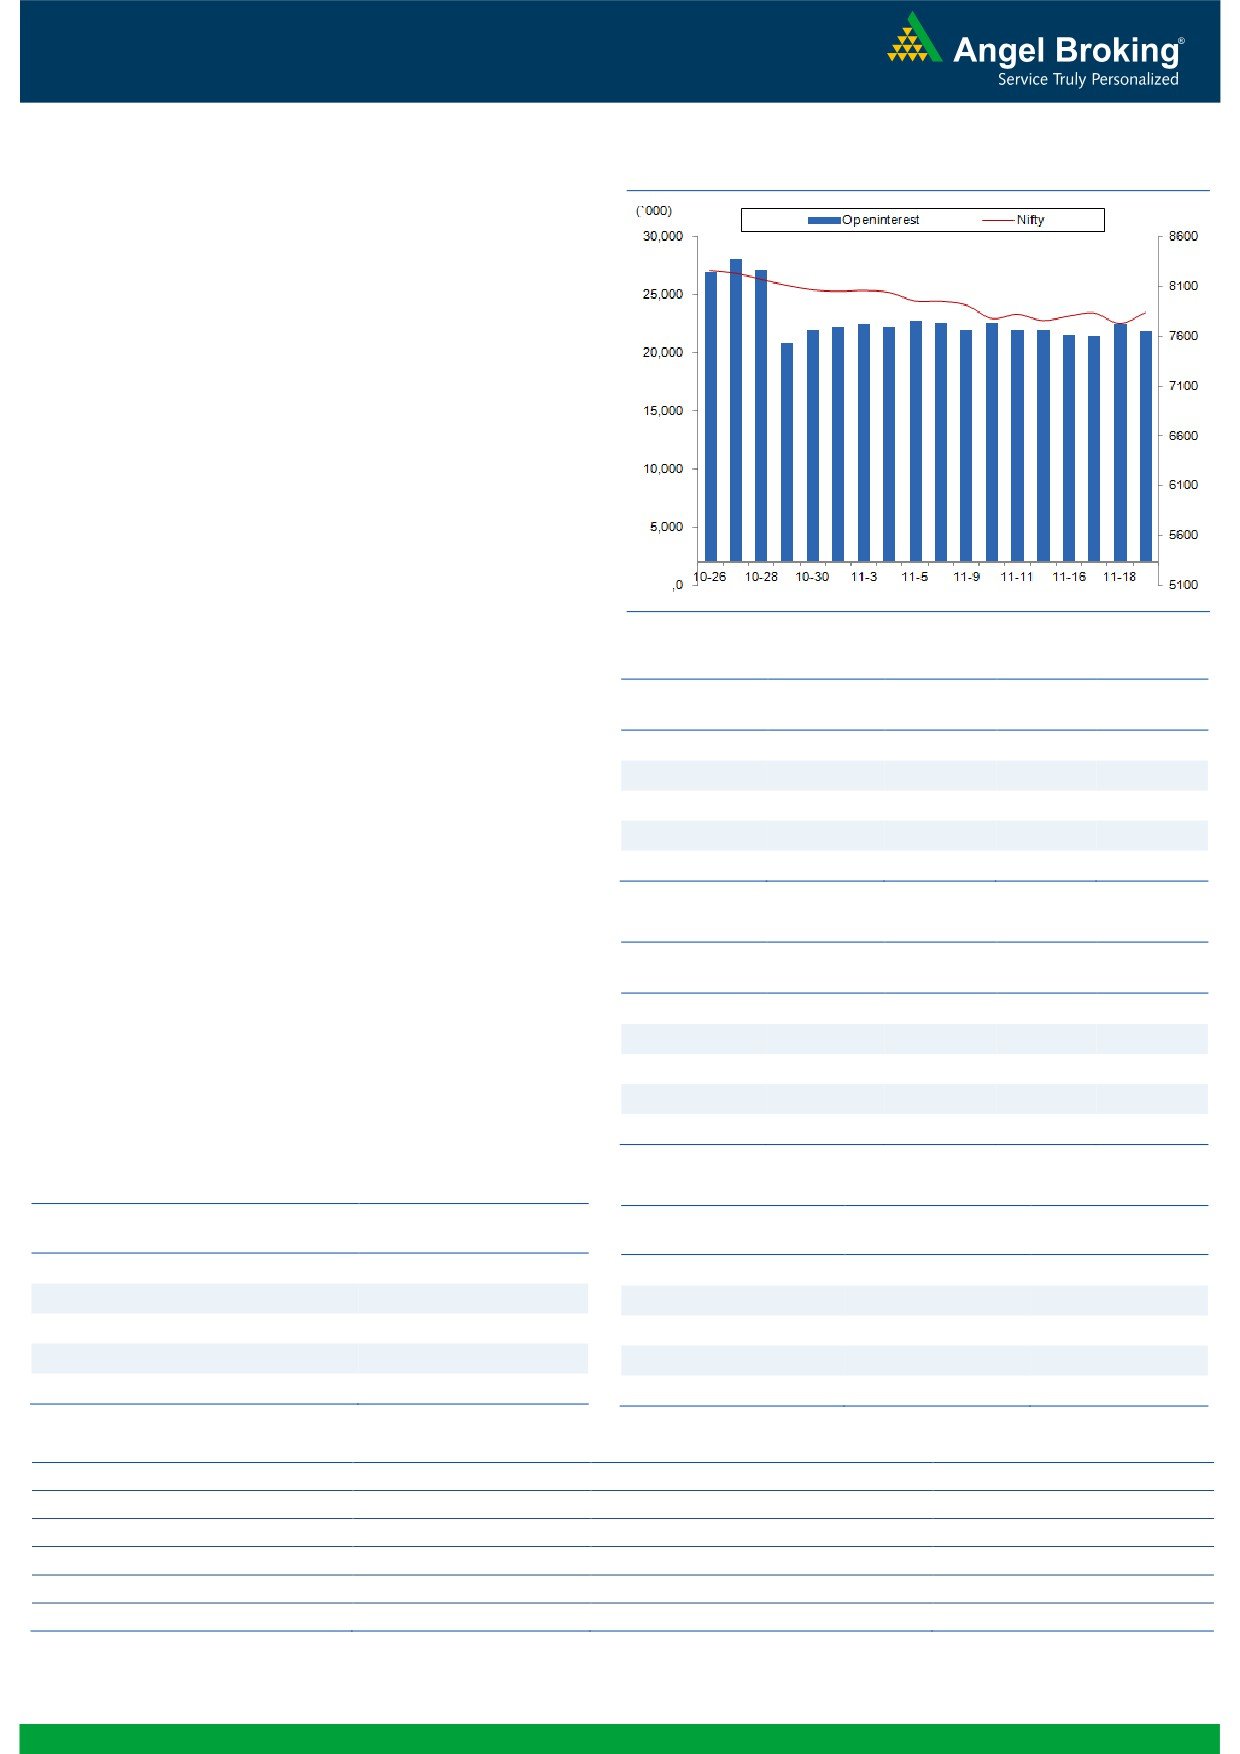
Exhibit 2: Bank Nifty Daily Chart
Bank Nifty Outlook - (17072)
In-line with the broader indices, the Bank Nifty too opened
with an upside gap in yesterday’s session. Post the gap up
opening, the banking index continued to move higher
throughout the session. Eventually, the Bank Nifty ended the
session with the gains of 1.55 percent over its previous close.
Going forward, 17180 - 17200 range will remain a supply
zone for the Bank Nifty and a sustainable move above the
same may pull the index back to 17400 levels. On the
downside, the immediate support for the index is placed at
16900 and 16750 levels.
Key Levels
Support 1 - 16900
Resistance 1 - 17200
Support 2 - 16750
Resistance 2 - 17400
1
Technical & Derivatives Report
November 20, 2015
Comments
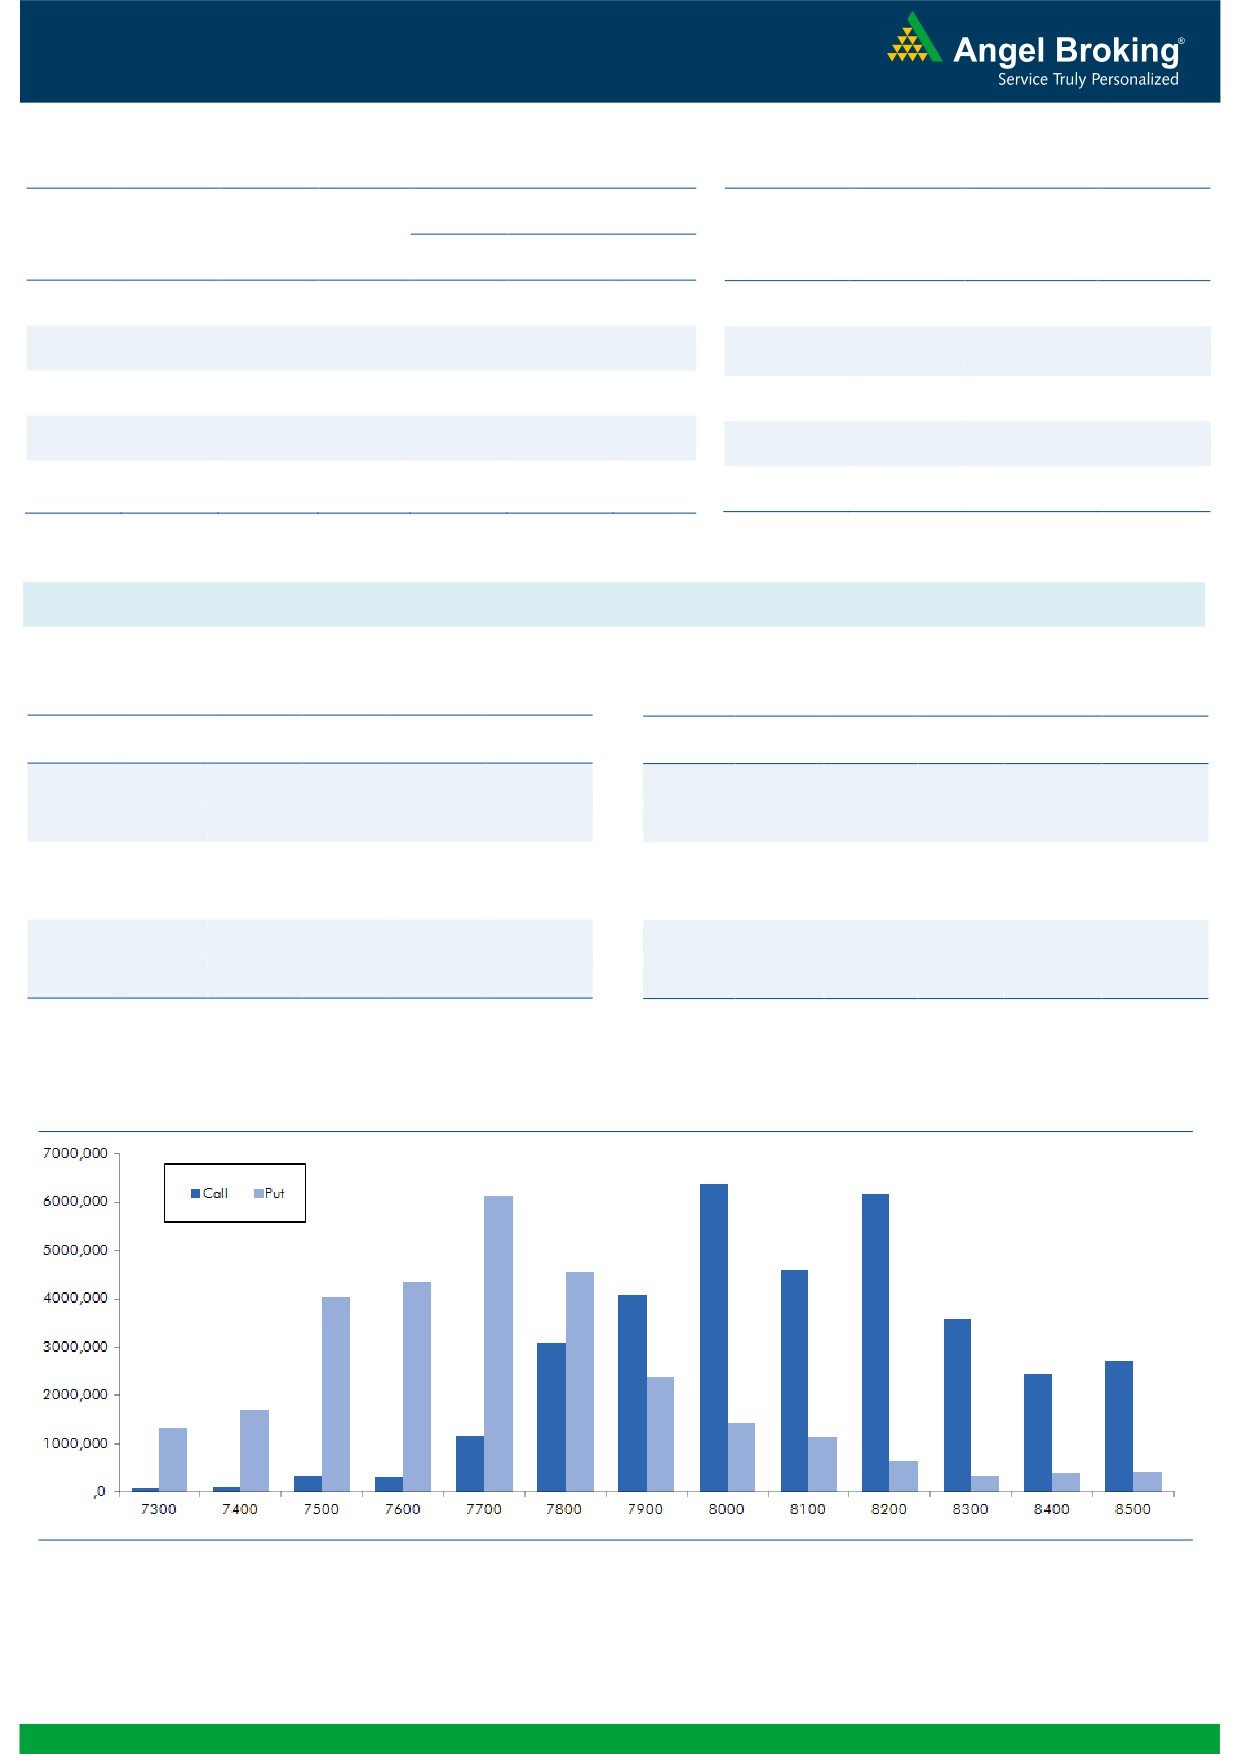
Nifty Vs OI
The Nifty futures open interest has decreased by 2.61%
BankNifty futures open interest has decreased by 9.63%
as market closed at 7842.75 levels.
The Nifty November future closed at a premium of 15.60
points against a premium of 0.15 points. The December
series closed at a premium of 52.95 points.
The Implied Volatility of at the money options has
decreased from 15.11% to 13.30%.
The total OI of the market is Rs. 2,44,865/- cr. and the
stock futures OI is Rs. 63,827/- cr.
Few of the liquid counters where we have seen high cost
of carry are SOUTHBANK, JINDALSTEL, UNITECH,
TV18BRDCST and NCC.
OI Gainers
OI
PRICE
Views
SCRIP
OI
PRICE
CHG. (%)
CHG. (%)
ENGINERSIN
2046000
29.71
212.80
10.83
FIIs continue to sell in cash market segment, they sold
ARVIND
5349900
29.67
309.50
9.15
equities to the tune of Rs. 343 crores. While in Index
HEROMOTOCO
1294800
18.66
2595.10
0.88
Futures, their activity was subdued.
MINDTREE
425200
12.85
1424.90
-1.87
In Index Options front, they bought significantly with
decent fall in OI. In call options, we hardlynsawbanyng.com
DIVISLAB
2840400
12.71
1153.95
1.73
strikes adding fresh build-up, good amount of unwinding
was seen in 7800 and 7900 call options. While in put
OI Losers
options, 7800 strike added good amount of buildup.
OI
PRICE
SCRIP
OI
PRICE
Maximum build-up is visible in 8000 call and 7700 put
CHG. (%)
CHG. (%)
HEXAWARE
4796000
-5.78
249.85
2.08
options. Seeing continuous selling figure in equities by
DLF
47050000
-4.56
103.70
-2.72
FIIs, we believe we may see further pain in market. One
MARUTI
2227250
-3.94
4650.20
2.54
should avoid forming fresh longs till we see any relevant
change in statistics.
ZEEL
9482200
-3.62
391.85
3.21
APOLLOTYRE
12447000
-3.06
160.95
1.90
Historical Volatility
Put-Call Ratio
SCRIP
HV
SCRIP
PCR-OI
PCR-VOL
ENGINERSIN
59.36
NIFTY
0.79
0.84
ARVIND
53.52
BANKNIFTY
0.89
0.80
ABIRLANUVO
35.40
DRREDDY
0.44
0.73
TECHM
30.16
LT
0.42
0.42
HDFCBANK
19.64
SBIN
0.46
0.48
Strategy Date
Symbol
Strategy
Status
November 02, 2015
RELIANCE
Short Strangle
Active
November 09, 2015
ITC
Short Strangle
Did not trigger.
November 16, 2015
TATAMOTORS
Long Put Ladder
Active
2
Technical & Derivatives Report
November 20, 2015
FII Statistics for 19-November 2015
Turnover on 19-November 2015
Open Interest
No. of
Turnover
Change
Detail
Buy
Sell
Net
Instrument
Value
Change
Contracts
( in Cr. )
(%)
Contracts
(in Cr.)
(%)
INDEX
INDEX
2488.84
2465.84
23.00
294364
16972.22
(0.41)
297766
16702.19
-3.54
FUTURES
FUTURES
INDEX
INDEX
25167.55
22686.65
2480.90
1290936
75031.65
(1.37)
3809775
221184.51
0.61
OPTIONS
OPTIONS
STOCK
4137.05
3747.44
389.61
993323
48741.80
1.13
STOCK
FUTURES
564640
28265.90
9.77
FUTURES
STOCK
STOCK
2348.17
2403.43
(55.26)
82245
4041.04
(2.46)
OPTIONS
316994
16100.96
0.97
OPTIONS
TOTAL
34141.62
31303.36
2838.26
2660868
144786.73
(0.38)
TOTAL
4989175
282253.57
1.22
Nifty Spot = 7842.75
Lot Size = 25
Bull-Call Spreads
Bear-Put Spreads
Action
Strike
Price
Risk
Reward
BEP
Action
Strike
Price
Risk
Reward
BEP
Buy
7900
39.15
Buy
7800
33.90
25.55
74.45
7925.55
19.40
80.60
7780.60
Sell
8000
13.60
Sell
7700
14.50
Buy
7900
39.15
Buy
7800
33.90
34.40
165.60
7934.40
26.95
173.05
7773.05
Sell
8100
4.75
Sell
7600
6.95
Buy
8000
13.60
Buy
7700
14.50
8.85
91.15
8008.85
7.55
92.45
7692.45
Sell
8100
4.75
Sell
7600
6.95
Note: Above mentioned Bullish or Bearish Spreads in Nifty (Nov. Series) are given as an information and not as a recommendation.
Nifty Put-Call Analysis
3
Technical & Derivatives Report
November 20, 2015
Daily Pivot Levels for Nifty 50 Stocks
Scrips
S2
S1
PIVOT
R1
R2
ACC
1,320
1,326
1,335
1,342
1,351
ADANIPORTS
263
267
269
273
275
AMBUJACEM
194
196
197
200
201
ASIANPAINT
811
817
826
832
840
AXISBANK
456
459
464
467
472
BAJAJ-AUTO
2,329
2,379
2,410
2,460
2,492
BANKBARODA
165
167
168
170
172
BHARTIARTL
329
334
338
343
346
BHEL
173
174
175
177
178
BOSCHLTD
18,919
19,059
19,222
19,362
19,525
BPCL
876
892
901
916
925
CAIRN
132
134
137
139
142
CIPLA
627
631
634
639
642
COALINDIA
327
330
333
337
340
DRREDDY
3,008
3,144
3,275
3,411
3,542
GAIL
299
308
314
324
329
GRASIM
3,584
3,625
3,652
3,693
3,720
HCLTECH
835
854
866
885
896
HDFC
1,173
1,193
1,205
1,226
1,238
HDFCBANK
1,042
1,055
1,063
1,077
1,085
HEROMOTOCO
2,516
2,553
2,618
2,655
2,721
HINDALCO
74
76
78
80
81
HINDUNILVR
787
791
796
800
806
ICICIBANK
260
263
266
269
271
IDEA
129
131
134
136
139
INDUSINDBK
894
904
911
921
927
INFY
1,013
1,030
1,041
1,059
1,069
ITC
347
350
351
354
355
KOTAKBANK
665
673
679
687
693
LT
1,343
1,351
1,358
1,366
1,373
LUPIN
1,735
1,771
1,796
1,832
1,856
M&M
1,266
1,279
1,288
1,302
1,311
MARUTI
4,537
4,594
4,628
4,684
4,718
NTPC
131
132
134
135
136
ONGC
228
230
232
235
236
PNB
136
138
139
140
141
POWERGRID
129
131
132
133
134
RELIANCE
909
922
930
943
952
SBIN
240
242
243
245
247
VEDL
88
90
91
93
94
SUNPHARMA
725
734
747
756
770
TATAMOTORS
400
404
407
410
413
TATAPOWER
66
66
67
67
67
TATASTEEL
224
226
228
230
232
TCS
2,336
2,349
2,365
2,379
2,395
TECHM
514
524
530
540
546
ULTRACEMCO
2,710
2,732
2,750
2,772
2,790
WIPRO
548
552
557
562
566
YESBANK
720
727
731
738
742
ZEEL
376
383
388
396
400
4
Technical & Derivatives Report
November 20, 2015
Research Team Tel: 022 - 39357800
For Technical Queries
For Derivatives Queries
DISCLAIMER
Angel Broking Private Limited (hereinafter referred to as “Angel”) is a registered Member of National Stock Exchange of India Limited,
Bombay Stock Exchange Limited and MCX Stock Exchange Limited. It is also registered as a Depository Participant with CDSL and
Portfolio Manager with SEBI. It also has registration with AMFI as a Mutual Fund Distributor. Angel Broking Private Limited is a
registered entity with SEBI for Research Analyst in terms of SEBI (Research Analyst) Regulations, 2014 vide registration number
INH000000164. Angel or its associates has not been debarred/ suspended by SEBI or any other regulatory authority for accessing
/dealing in securities Market. Angel or its associates including its relatives/analyst do not hold any financial interest/beneficial
ownership of more than 1% in the company covered by Analyst. Angel or its associates/analyst has not received any compensation /
managed or co-managed public offering of securities of the company covered by Analyst during the past twelve months. Angel/analyst
has not served as an officer, director or employee of company covered by Analyst and has not been engaged in market making activity
of the company covered by Analyst.
This document is solely for the personal information of the recipient, and must not be singularly used as the basis of any investment
decision. Nothing in this document should be construed as investment or financial advice. Each recipient of this document should
make such investigations as they deem necessary to arrive at an independent evaluation of an investment in the securities of the
companies referred to in this document (including the merits and risks involved), and should consult their own advisors to determine
the merits and risks of such an investment.
Reports based on technical and derivative analysis center on studying charts of a stock's price movement, outstanding positions and
trading volume, as opposed to focusing on a company's fundamentals and, as such, may not match with a report on a company's
fundamentals.
The information in this document has been printed on the basis of publicly available information, internal data and other reliable
sources believed to be true, but we do not represent that it is accurate or complete and it should not be relied on as such, as this
document is for general guidance only. Angel Broking Pvt. Limited or any of its affiliates/ group companies shall not be in any way
responsible for any loss or damage that may arise to any person from any inadvertent error in the information contained in this report.
Angel Broking Pvt. Limited has not independently verified all the information contained within this document. Accordingly, we cannot
testify, nor make any representation or warranty, express or implied, to the accuracy, contents or data contained within this document.
While Angel Broking Pvt. Limited endeavors to update on a reasonable basis the information discussed in this material, there may be
regulatory, compliance, or other reasons that prevent us from doing so.
This document is being supplied to you solely for your information, and its contents, information or data may not be reproduced,
redistributed or passed on, directly or indirectly.
Neither Angel Broking Pvt. Limited, nor its directors, employees or affiliates shall be liable for any loss or damage that may arise from
or in connection with the use of this information.
Note: Please refer to the important ‘Stock Holding Disclosure' report on the Angel website (Research Section). Also, please refer to the
latest update on respective stocks for the disclosure status in respect of those stocks. Angel Broking Pvt. Limited and its affiliates may
have investment positions in the stocks recommended in this report.
5