Technical & Derivatives Report
October 20, 2016
Sensex (27984) / Nifty (8659)
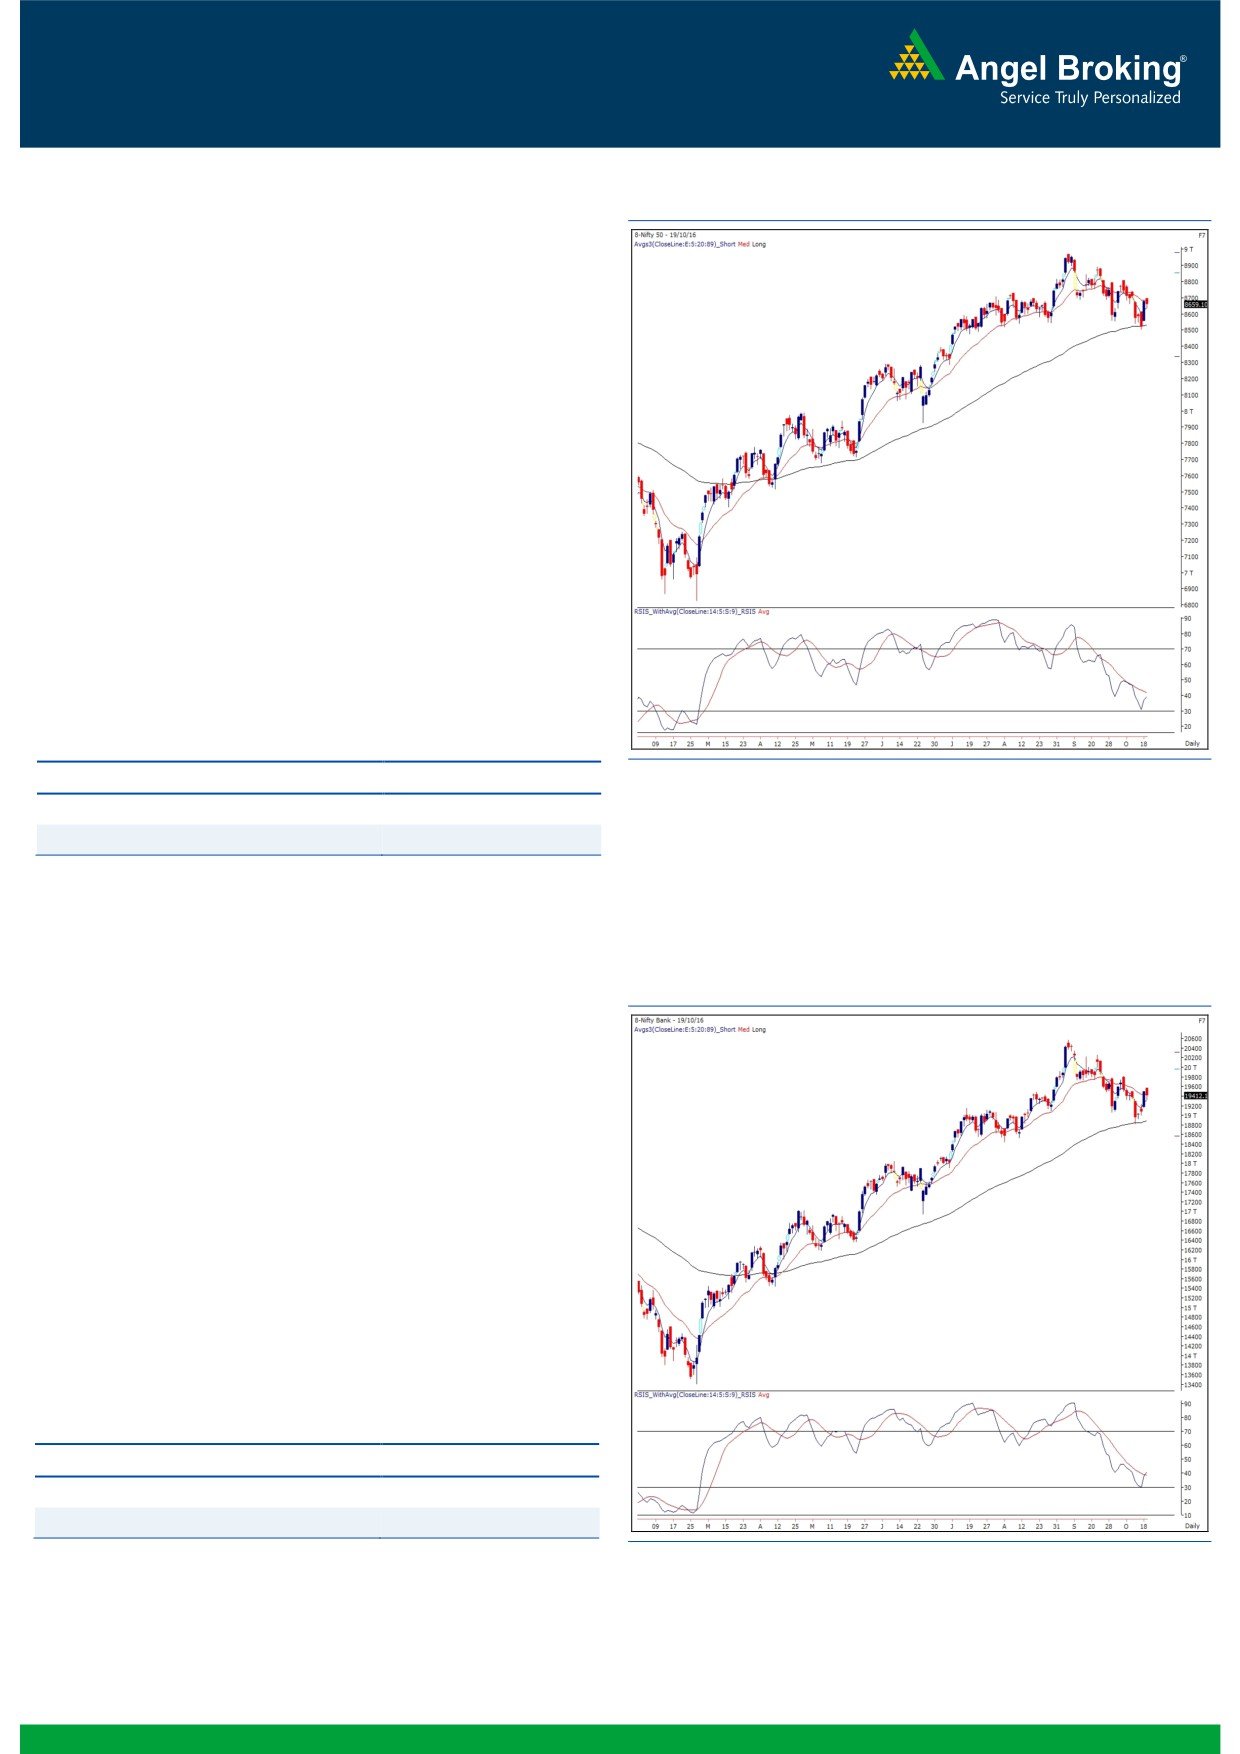
Exhibit 1: Nifty Daily Chart
Yesterday, the Nifty opened with a marginal gap up; however,
lack of follow up buying led to a rangebound trading session and
the index ended the day with a marginal loss of 0.22 percent.
During the recent corrective move, the Nifty index had an unfilled
gap in the range of 8704-8681. In yesterday's session, the bulls
were not able to carry forward its previous day's momentum
owing to the gap resistance, which also coincides with the 61.80
percent retracement level of the recent corrective move from 8807
to 8506. Till the 'Lower Top Lower Bottom' structure is intact on
the daily charts, there is a higher probability of the ongoing up
move of being a pullback rally within a corrective trend. Hence,
untill the index crosses the recent swing high of 8746, we
continue to advise traders to remain cautious and not to
participate aggressively in the pullback move. The intraday
supports for the Nifty index are placed around 8615 and 8575
whereas resistances are seen around 8710 and 8746.
Key Levels
Support 1 - 8615
Resistance 1 - 8710
Support 2 - 8575
Resistance 2 - 8746
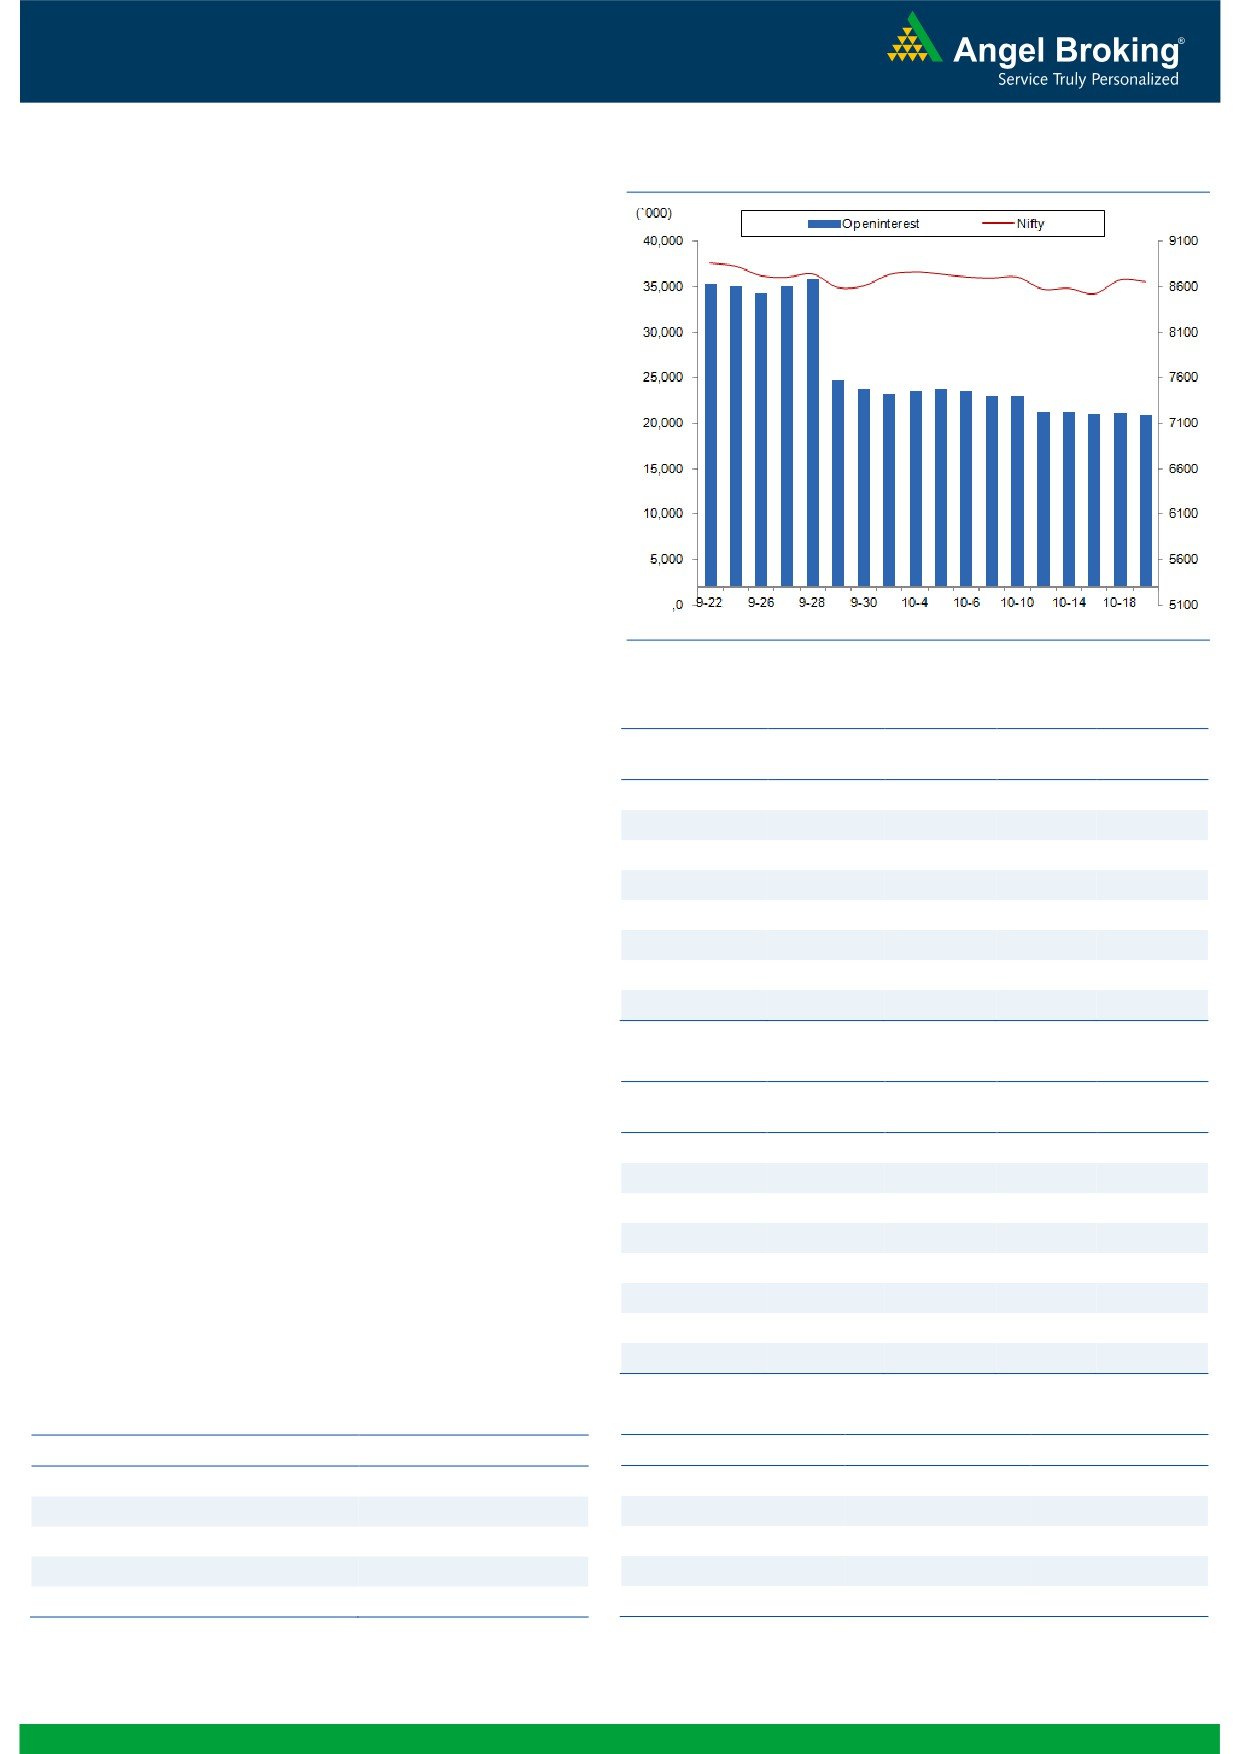
Exhibit 2: Nifty Bank Daily Chart
Nifty Bank Outlook - (19412)
Post a positive opening, the Nifty Bank index too corrected
marginally and traded in a narrow range throughout the session.
The banking index ended the session with a marginal loss of 0.43
percent over its previous session's close.
The broader chart structure still remains unchanged as the 'Lower
Top Lower Bottom' structure is still intact on the daily chart.
Hence, we continue to advise traders to wait on sidelines for
further price development and not to participate aggressively with
positive bias. The near term resistances for the index are seen
around 19617 and 19817 which are the 50% retracement and
the recent ‘lower top’ resistance levels respectively. The intraday
supports for the index are placed around 19310 and 19240.
Key Levels
Support 1 - 19310
Resistance 1 - 19617
Support 2 - 19240
Resistance 2 - 19817
1
Technical & Derivatives Report
October 20, 2016
Comments
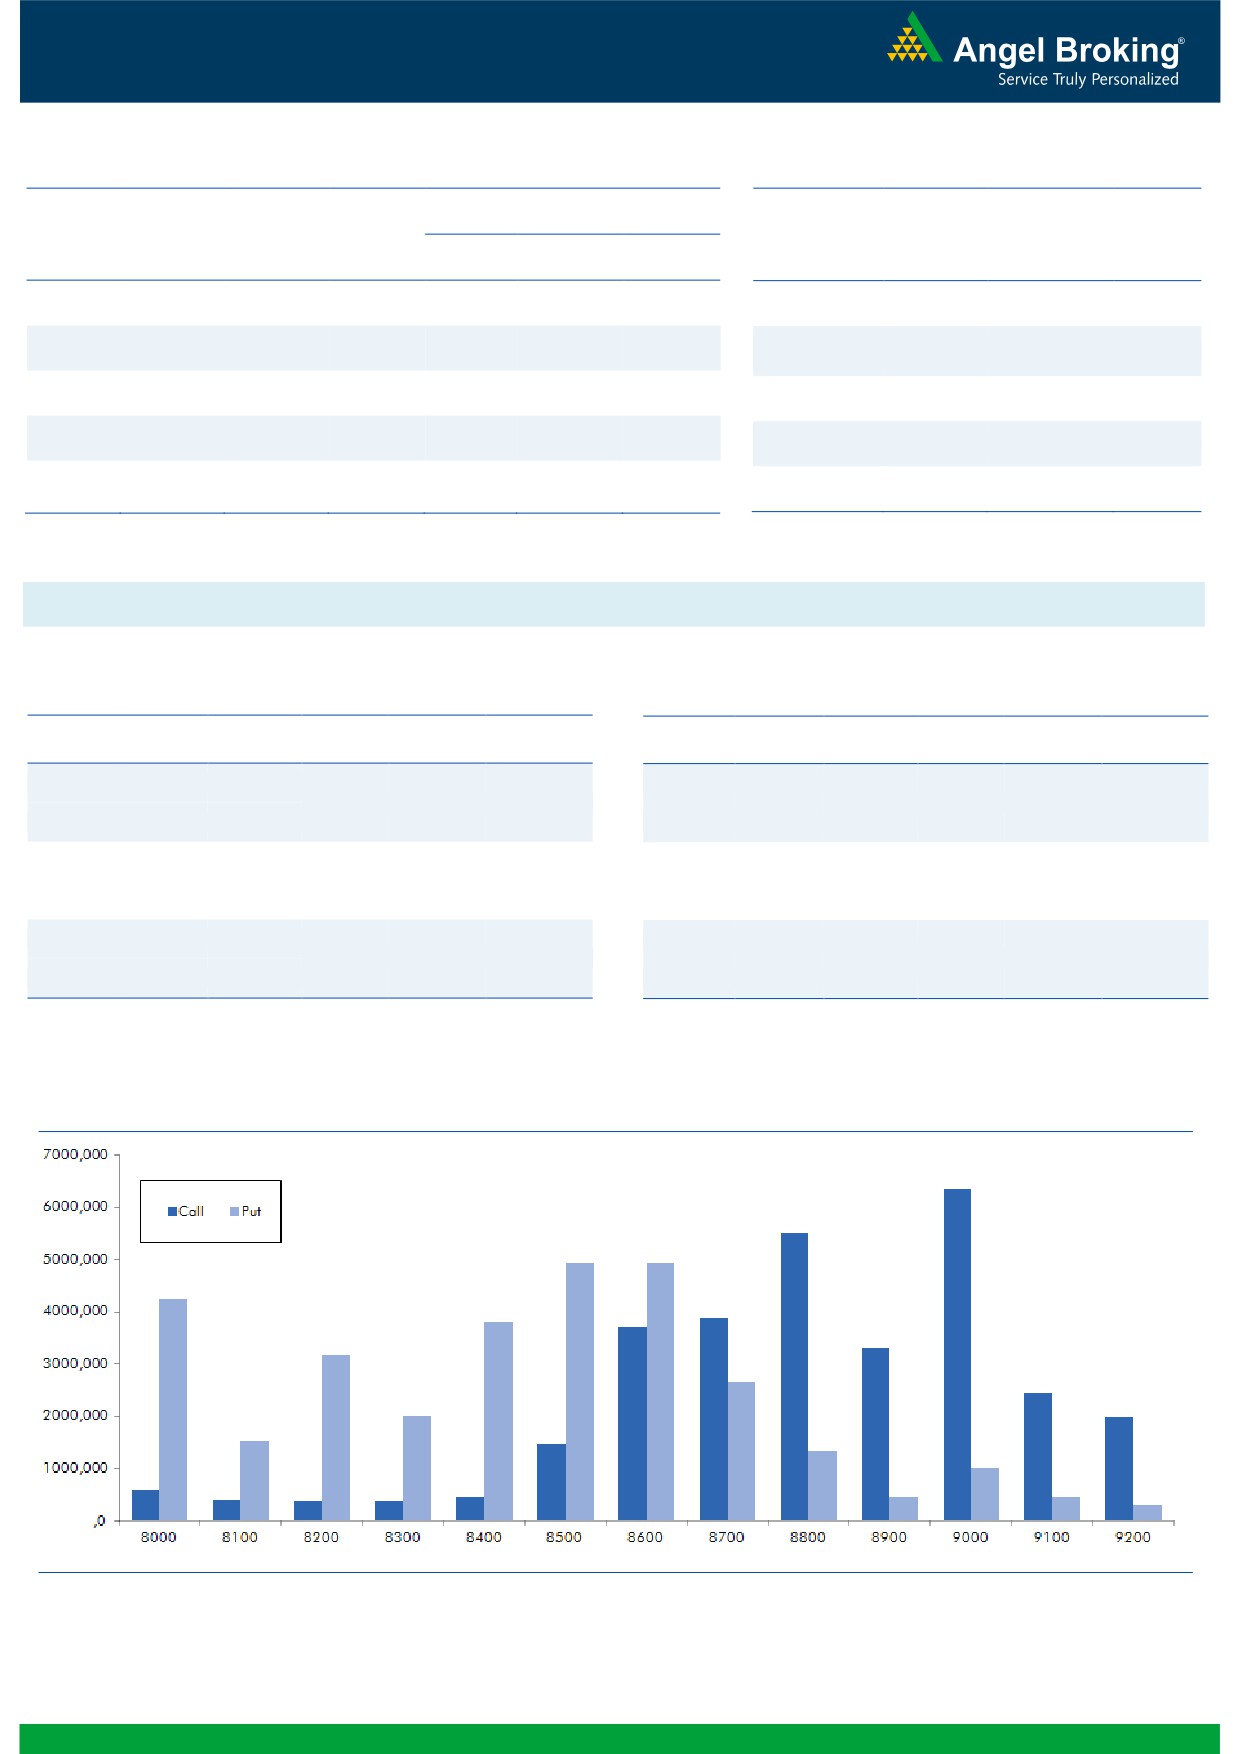
Nifty Vs OI
The Nifty futures open interest has decreased by 1.09%
BankNifty futures open interest has decreased by 2.23%
as market closed at 8659.10 levels.
The Nifty October future closed with a premium of 6.15
against the premium of 1.95 points in last trading
session. The November series closed at a premium of
46.20 points.
The Implied Volatility of at the money options has
decreased from 12.87% to 12.30%. At the same time,
the PCR-OI of Nifty has remained unchanged at 0.96
levels.
The total OI of the market is Rs. 2,85,374/- cr. and the
stock futures OI is Rs. 81,077/- cr.
Few of the liquid counters where we have seen high cost
of carry are GMRINFRA, IDEA, FEDERALBNK,
SYNDIBANK and JPASSOCIAT.
Views
OI Gainers
Yesterday, FIIs were net sellers in both cash market
OI
PRICE
SCRIP
OI
PRICE
segment and in index futures. They sold equities to the
CHG. (%)
CHG. (%)
tune of Rs. 283 crores. While, in index futures they were
IDFCBANK
22696000
22.07
77.55
1.04
net sellers of Rs. 112 crores with marginal change in
TORNTPHARM
352800
18.71
1623.15
-1.51
open interest, suggesting blend of long unwinding and
HINDZINC
9843200
17.72
249.05
1.22
www.angelbroking.com
fresh short formation in last trading sessions.
PETRONET
6864000
14.34
384.80
-4.23
On Index Options front, FIIs bought of worth Rs. 133
RELCAPITAL
11787000
10.55
545.15
-1.39
crores with good amount of rise in OI. Yesterday, in both
TORNTPOWER
1863000
10.50
169.75
-0.61
call and put options of Nifty we hardly saw any
TECHM
9544700
10.18
426.20
-0.04
meaningful open interest additions. 8750 call and 8600
IDBI
43392000
9.49
73.10
3.84
put options were comparatively active and they also
added some fresh positions. Maximum OI in October
OI Losers
series is placed at 9000 call and 8500 put options.
OI
PRICE
SCRIP
OI
PRICE
Despite, Nifty bounced from its support zone 8500-8550
CHG. (%)
CHG. (%)
levels, we hardly saw any buying figure in Index Futures
CEATLTD
1451800
-15.24
1290.80
-3.32
by FIIs. In fact, they formed fresh short positions in
BHEL
44620000
-10.76
141.80
3.73
November series. Most of the heavy weight counters that
DCBBANK
2146500
-9.32
127.75
0.31
bounced were mainly due to short covering. We believe,
COLPAL
2152500
-7.85
940.05
1.99
Nifty may show some strength for current expiry, but the
PAGEIND
39150
-5.43
16162.45
-1.96
overall trend remains negative. Those traders who are
HDIL
31528000
-4.83
79.40
-1.00
long in index futures should avoid rolling their positions
BANKINDIA
33012000
-4.60
113.00
0.31
for next series.
RELIANCE
20095000
-4.55
1087.70
0.54
Historical Volatility
Put-Call Ratio
SCRIP
HV
SCRIP
PCR-OI
PCR-VOL
HAVELLS
44.03
NIFTY
0.96
0.89
WIPRO
22.77
BANKNIFTY
1.28
1.01
ITC
24.39
INFY
0.50
0.63
BIOCON
38.61
ICICIBANK
0.91
0.82
STAR
33.38
RELIANCE
0.45
0.40
2
Technical & Derivatives Report
October 20, 2016
FII Statistics for 19, October 2016
Turnover on 19, October 2016
Open Interest
No. of
Turnover
Change
Detail
Buy
Sell
Net
Instrument
Value
Change
Contracts
( in Cr. )
(%)
Contracts
(in Cr.)
(%)
INDEX
INDEX
960.68
1072.33
(111.65)
222097
14878.51
0.23
183658
12802.39
-35.30
FUTURES
FUTURES
INDEX
INDEX
37598.26
37465.55
132.71
1129206
75279.14
2.50
4413458
318477.48
-9.81
OPTIONS
OPTIONS
STOCK
7218.10
7106.94
111.17
883200
58606.57
0.05
STOCK
FUTURES
577569
41925.20
-2.51
FUTURES
STOCK
STOCK
4611.45
4505.27
106.18
114484
7703.31
2.92
OPTIONS
368065
27016.27
-6.88
OPTIONS
TOTAL
50388.49
50150.08
238.41
2348987
156467.53
1.37
TOTAL
5542750
400221.34
-10.05
Nifty Spot = 8659.10
Lot Size = 75
Bull-Call Spreads
Bear-Put Spreads
Action
Strike
Price
Risk
Reward
BEP
Action
Strike
Price
Risk
Reward
BEP
Buy
8700
47.95
Buy
8700
81.10
30.55
69.45
8730.55
40.25
59.75
8659.75
Sell
8800
17.40
Sell
8600
40.85
Buy
8700
47.95
Buy
8700
81.10
41.75
158.25
8741.75
60.75
139.25
8639.25
Sell
8900
6.20
Sell
8500
20.35
Buy
8800
17.40
Buy
8600
40.85
11.20
88.80
8811.20
20.50
79.50
8579.50
Sell
8900
6.20
Sell
8500
20.35
Note: Above mentioned Bullish or Bearish Spreads in Nifty (October Series) are given as an information and not as a recommendation.
Nifty Put-Call Analysis
3
Technical & Derivatives Report
October 20, 2016
Daily Pivot Levels for Nifty Constituents
Scrips
S2
S1
PIVOT
R1
R2
ACC
1,594
1,602
1,615
1,623
1,635
ADANIPORTS
259
265
269
276
280
AMBUJACEM
247
249
251
254
256
ASIANPAINT
1,151
1,160
1,172
1,181
1,193
AUROPHARMA
816
822
831
837
846
AXISBANK
523
529
536
542
548
BAJAJ-AUTO
2,741
2,765
2,792
2,816
2,843
BANKBARODA
152
154
156
157
159
BHEL
137
139
141
144
146
BPCL
648
654
662
668
676
BHARTIARTL
301
304
307
310
312
INFRATEL
350
354
358
363
367
BOSCH
22,005
22,191
22,395
22,581
22,785
CIPLA
588
592
595
600
603
COALINDIA
310
311
313
314
316
DRREDDY
3,034
3,050
3,062
3,078
3,090
EICHERMOT
24,660
24,819
25,059
25,218
25,458
GAIL
422
429
437
444
452
GRASIM
974
978
984
989
994
HCLTECH
817
824
833
839
848
HDFCBANK
1,241
1,250
1,256
1,265
1,271
HDFC
1,323
1,332
1,346
1,356
1,369
HEROMOTOCO
3,314
3,338
3,378
3,402
3,442
HINDALCO
148
149
152
153
156
HINDUNILVR
837
841
849
853
861
ICICIBANK
258
262
267
270
275
IDEA
70
73
76
79
81
INDUSINDBK
1,195
1,203
1,210
1,218
1,225
INFY
1,031
1,037
1,041
1,046
1,051
ITC
234
237
241
244
248
KOTAKBANK
765
769
777
782
790
LT
1,464
1,478
1,489
1,503
1,514
LUPIN
1,474
1,493
1,506
1,525
1,538
M&M
1,300
1,314
1,326
1,340
1,353
MARUTI
5,560
5,582
5,615
5,637
5,670
NTPC
146
148
149
150
152
ONGC
274
277
278
281
282
POWERGRID
174
176
178
181
183
RELIANCE
1,075
1,081
1,088
1,094
1,101
SBIN
253
254
256
257
259
SUNPHARMA
740
745
752
757
764
TCS
2,352
2,374
2,392
2,413
2,432
TATAMTRDVR
354
358
360
364
367
TATAMOTORS
540
545
550
555
560
TATAPOWER
77
79
81
82
84
TATASTEEL
418
422
425
429
432
TECHM
409
417
427
435
444
ULTRACEMCO
3,984
4,008
4,029
4,053
4,074
WIPRO
479
487
492
500
505
YESBANK
1,261
1,276
1,292
1,308
1,324
ZEEL
498
503
510
515
522
4
Technical & Derivatives Report
October 20, 2016
Research Team Tel: 022 - 39357800
For Technical Queries
For Derivatives Queries
DISCLAIMER
Angel Broking Private Limited (hereinafter referred to as “Angel”) is a registered Member of National Stock Exchange of India Limited,
Bombay Stock Exchange Limited and Metropolitan Stock Exchange Limited. It is also registered as a Depository Participant with CDSL
and Portfolio Manager with SEBI. It also has registration with AMFI as a Mutual Fund Distributor. Angel Broking Private Limited is a
registered entity with SEBI for Research Analyst in terms of SEBI (Research Analyst) Regulations, 2014 vide registration number
INH000000164. Angel or its associates has not been debarred/ suspended by SEBI or any other regulatory authority for accessing
/dealing in securities Market. Angel or its associates/analyst has not received any compensation / managed or co-managed public
offering of securities of the company covered by Analyst during the past twelve months.
This document is solely for the personal information of the recipient, and must not be singularly used as the basis of any investment
decision. Nothing in this document should be construed as investment or financial advice. Each recipient of this document should
make such investigations as they deem necessary to arrive at an independent evaluation of an investment in the securities of the
companies referred to in this document (including the merits and risks involved), and should consult their own advisors to determine
the merits and risks of such an investment.
Reports based on technical and derivative analysis center on studying charts of a stock's price movement, outstanding positions and
trading volume, as opposed to focusing on a company's fundamentals and, as such, may not match with a report on a company's
fundamentals. Investors are advised to refer the Fundamental and Technical Research Reports available on our website to evaluate the
contrary view, if any.
The information in this document has been printed on the basis of publicly available information, internal data and other reliable
sources believed to be true, but we do not represent that it is accurate or complete and it should not be relied on as such, as this
document is for general guidance only. Angel Broking Pvt. Limited or any of its affiliates/ group companies shall not be in any way
responsible for any loss or damage that may arise to any person from any inadvertent error in the information contained in this report.
Angel Broking Pvt. Limited has not independently verified all the information contained within this document. Accordingly, we cannot
testify, nor make any representation or warranty, express or implied, to the accuracy, contents or data contained within this document.
While Angel Broking Pvt. Limited endeavors to update on a reasonable basis the information discussed in this material, there may be
regulatory, compliance, or other reasons that prevent us from doing so.
This document is being supplied to you solely for your information, and its contents, information or data may not be reproduced,
redistributed or passed on, directly or indirectly.
Neither Angel Broking Pvt. Limited, nor its directors, employees or affiliates shall be liable for any loss or damage that may arise from
or in connection with the use of this information.
5