Technical & Derivatives Report
June 20, 2016
Sensex (26626) / Nifty (8170)
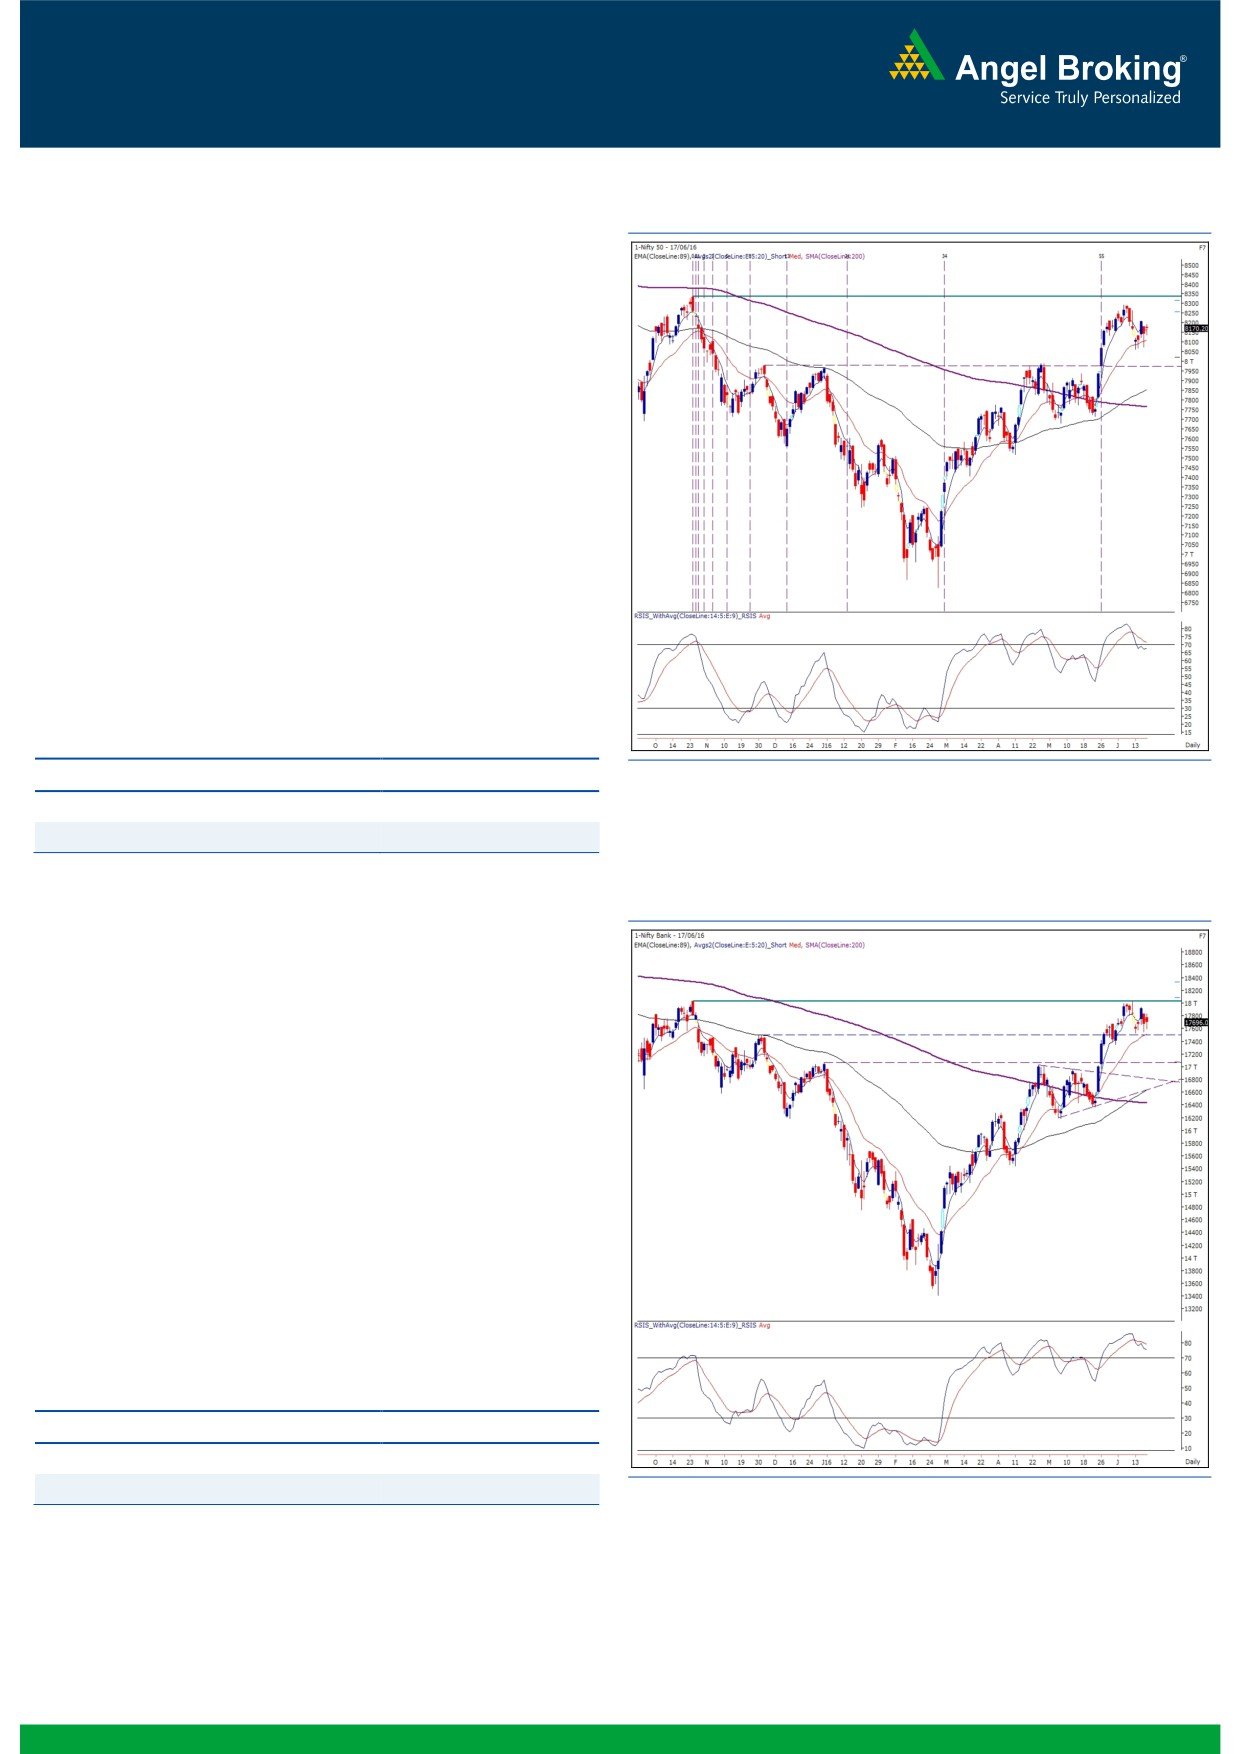
Exhibit 1: Nifty Daily Chart
In the course of trading in the concluded week, we saw the index
attempt to breach the mentioned supports (in our previous weekly
report) which correspond with a couple of technical indicators
such as the Daily ’20 EMA’ and the ‘Super Trend’ placed around
8080 - 8060. But as expected, these rendered strong support to
the index; thus, going forward, we maintain our view that one
should trade with a positive bias as long as the Nifty manages to
hold the mentioned support zone. On the flipside, 8213 - 8280
are seen as immediate hurdles. In the forthcoming week, traders
across the globe would have a close watch on the ‘EU
Referendum on Brexit’. Looking at the recent chart structure, we
are of the opinion that we may see very limited downside (7950 -
7900) even in case of a negative outcome of the event. We
maintain our positive stance on the market and see the Nifty
crossing its next swing high of 8336 quite soon. We would
therefore advise to use dips (if any) as a buying opportunity in the
current market scenario.
Key Levels
Support 1 - 8080
Resistance 1 - 8213
Support 2 - 8060
Resistance 2 - 8280
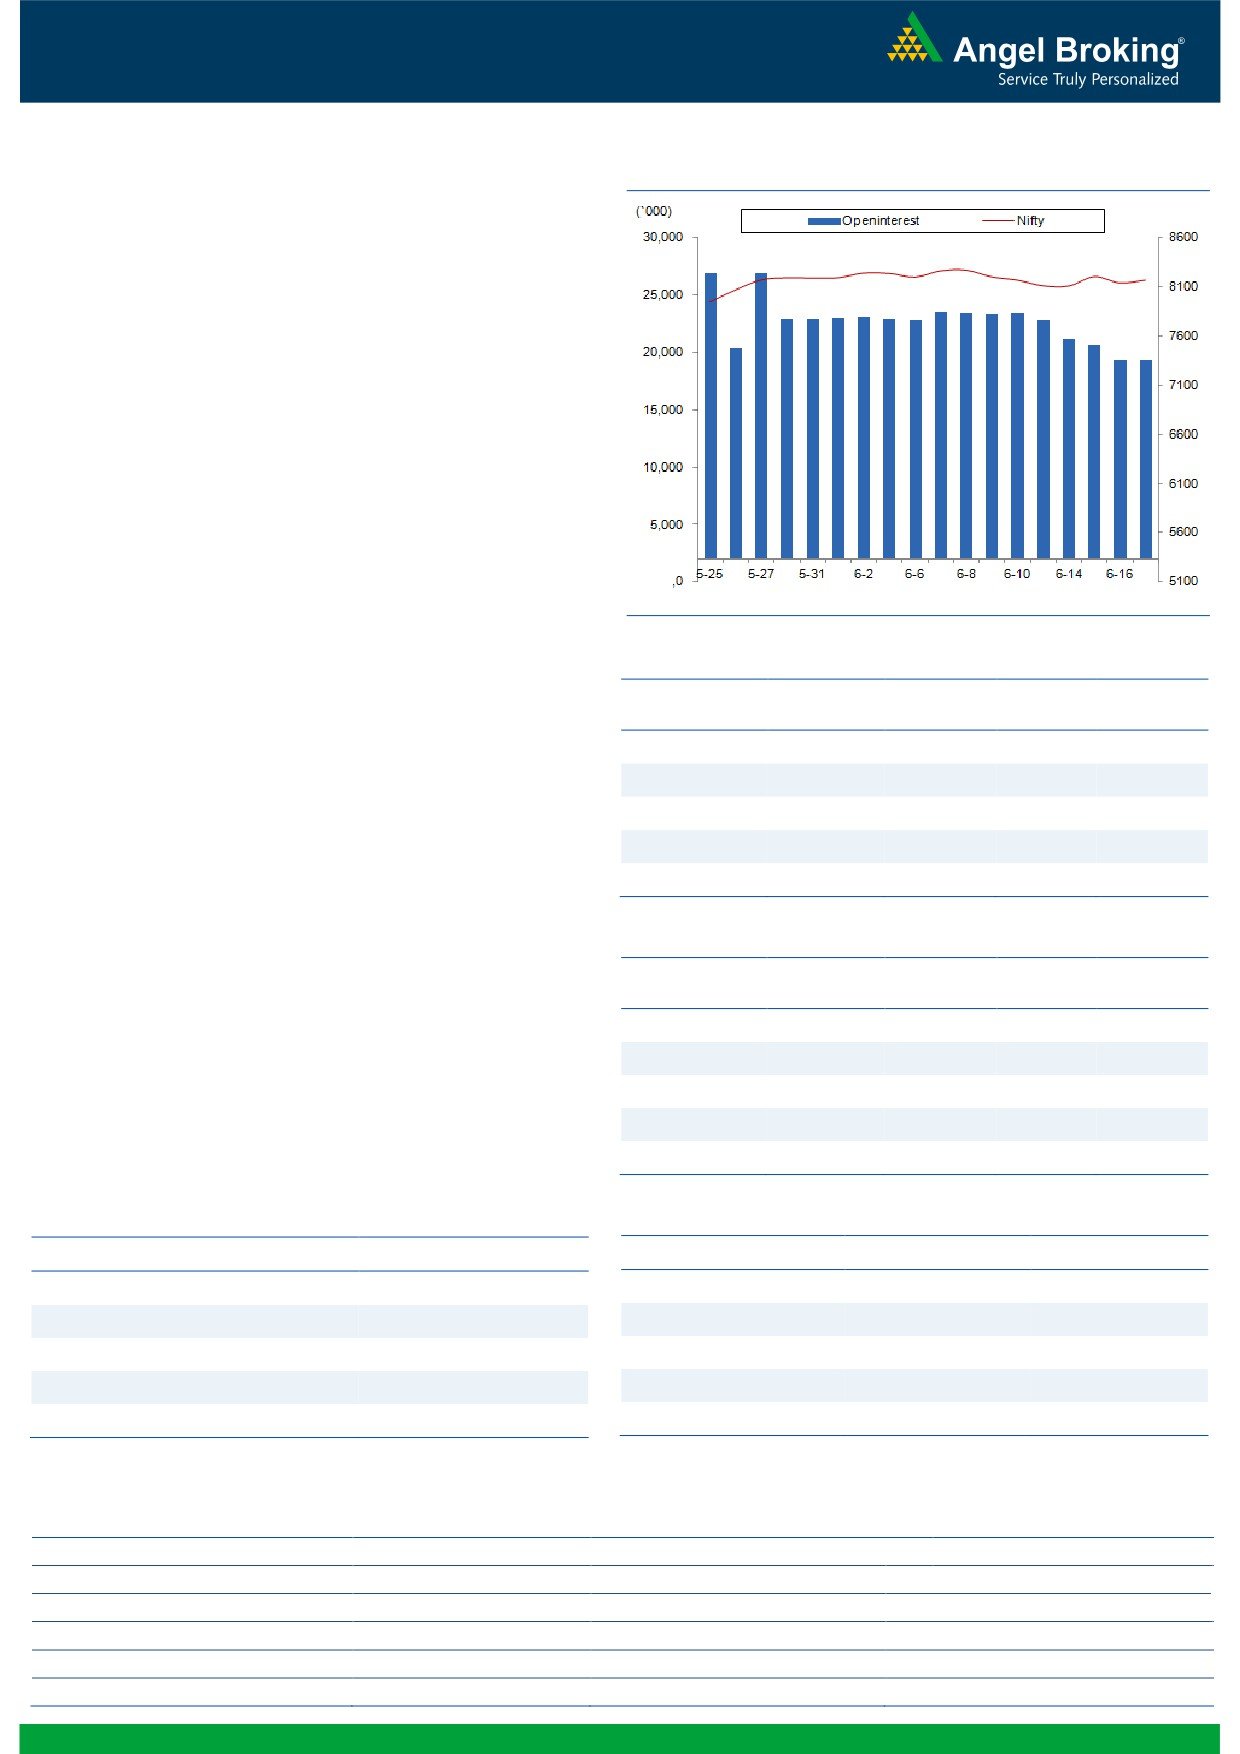
Exhibit 2: Nifty Bank Daily Chart
Nifty Bank Outlook - (17696)
During last week, the Nifty Bank index traded in a narrow range
from 17525 to 17944. Such rangebound sessions are usually
followed by a trended move and thus, the index could be gearing
for a trended move in near term. Since last couple of weeks, the
index has resisted around 18050 which is 61.8% resistance of
previous corrective move from 20168 (Jan 2015) to 13407 (Mar
2016). It also coincides with Oct 2015 high which is seen as
significant resistance. On the flipside, the 'SuperTrend' indicator
and lower end of the recent rangebound activity is indicating
support around 17350. Thus, only a breakout of the range from
17350 - 18050 will lead to directional move in the index. Till
then, traders are advised to focus on stock specific trades with
proper risk management. The intraday support for the index is
placed around 17480 and 17350 whereas resistances are seen
around 17935 and 18050.
Key Levels
Support 1 - 17480
Resistance 1 - 17935
Support 2 - 17350
Resistance 2 - 18050
1
Technical & Derivatives Report
June 20, 2016
Comments
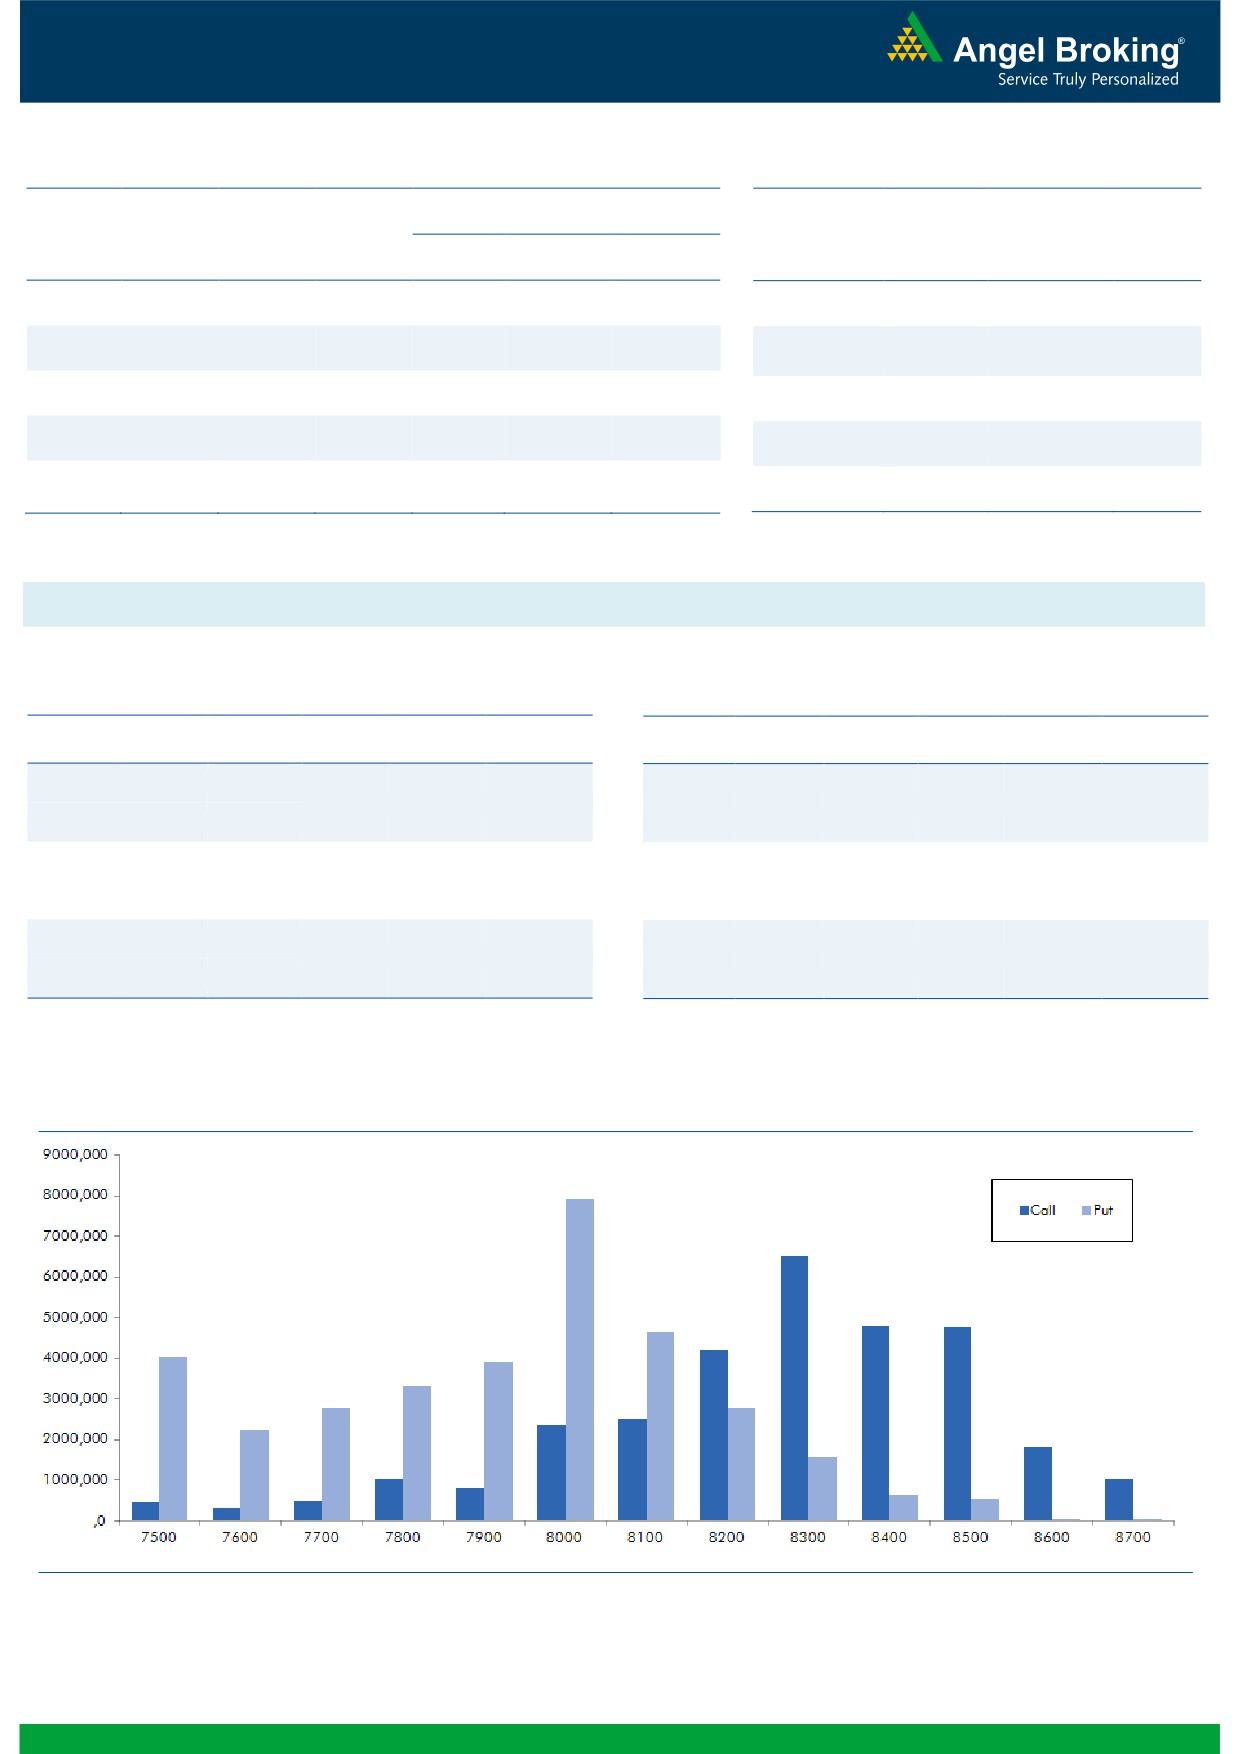
Nifty Vs OI
The Nifty futures open interest has increased by 0.26%
BankNifty futures open interest has decreased by 3.80%
as market closed at 8170.20 levels.
The Nifty June future closed with a premium of 4.20
points against a premium of 18.00 points in previous
session. The July series closed at a premium of 29.00
points.
The Implied Volatility of at the money options has
decreased from 16.90% to 16.44%.
The total OI of the market is Rs. 2,42,897/- cr. and the
stock futures OI is Rs. 67,360/- cr.
Few of the liquid counters where we have seen high cost
of carry are UNITECH, JPASSOCIAT, IFCI, GODREJIND
and L&TFH.
Views
FIIs were marginal buyers in equity cash segment on
OI Gainers
Friday. While in Index Futures, they sold worth Rs. 480
OI
PRICE
SCRIP
OI
PRICE
CHG. (%)
CHG. (%)
crores with minor change in open interest, indicating
INFRATEL
6865800
16.06
339.40
-2.99
blend of both long unwinding and short build-up in last
trading session.
BATAINDIA
1830800
13.03
529.55
-1.56
On Index Options front, FIIs sold worth Rs. 656 crores
IOB
8890000
11.60
27.45
3.58
with rise in open interest. In call options, 8300 strike
HDIL
27316000
11.06
103.00
6.96
added some fresh positions; followed by marginal fall inng.com
PIDILITIND
1175000
9.81
704.90
0.51
OI in 8100 strike. While in put options, we witnessed
some fresh OI build-up in 8000 and 8200 strikes.
OI Losers
Maximum open interest in June series is visible in 8300
OI
PRICE
call and 8000 put options.
SCRIP
OI
PRICE
CHG. (%)
CHG. (%)
FIIs are continuously unwinding long positions in index
CEATLTD
2967300
-8.19
832.20
-3.03
future. We reiterate our view that till the time we don’t
UBL
2457200
-6.92
753.05
0.93
see any fresh formation in index by FIIs, Nifty may
PETRONET
4659000
-6.11
286.20
0.76
continue to remain in the range of 8000 - 8300. Thus,
COALINDIA
17480900
-5.60
314.00
1.65
one should remain light on positions and wait for further
WIPRO
8494000
-5.38
552.50
0.33
development on data front.
Historical Volatility
Put-Call Ratio
SCRIP
HV
SCRIP
PCR-OI
PCR-VOL
HDIL
50.38
NIFTY
1.11
0.90
UNITECH
112.31
BANKNIFTY
1.06
0.93
TATAPOWER
32.26
SBIN
0.94
0.63
CEATLTD
34.30
RELIANCE
0.54
0.48
IOB
39.81
SUNPHARMA
0.35
0.32
Strategy Date
Symbol
Strategy
Status
May 30, 2016
TCS
Ratio Bull Call Spread
Active
June 06, 2016
NIFTY
Long Call
Exited at Cost
June 13, 2016
ONGC
Ratio Bull Call Spread
Active
2
Technical & Derivatives Report
June 20, 2016
FII Statistics for 17-June 2016
Turnover on 17-June 2016
Open Interest
No. of
Turnover
Change
Detail
Buy
Sell
Net
Instrument
Value
Contracts
( in Cr. )
(%)
Contracts
Change (%)
(in Cr.)
INDEX
INDEX
1509.57
1989.84
(480.27)
225496
13595.06
(0.10)
255739
14966.18
-35.98
FUTURES
FUTURES
INDEX
INDEX
19774.06
20430.33
(656.27)
1158171
70217.28
3.25
2623233
156428.91
-53.68
OPTIONS
OPTIONS
STOCK
4843.65
4934.50
(90.85)
1089262
54008.52
0.72
STOCK
FUTURES
519217
27087.88
-11.25
FUTURES
STOCK
STOCK
2453.38
2499.03
(45.64)
110924
5723.47
2.90
OPTIONS
297492
15788.14
-17.00
OPTIONS
TOTAL
28580.66
29853.69
(1273.03)
2583853
143544.33
1.86
TOTAL
3695681
214271.11
-47.82
Nifty Spot = 8170.20
Lot Size = 75
Bull-Call Spreads
Bear-Put Spreads
Action
Strike
Price
Risk
Reward
BEP
Action
Strike
Price
Risk
Reward
BEP
Buy
8200
87.60
Buy
8100
75.35
41.50
58.50
8241.50
25.80
74.20
8074.20
Sell
8300
46.10
Sell
8000
49.55
Buy
8200
87.60
Buy
8100
75.35
67.20
132.80
8267.20
43.00
157.00
8057.00
Sell
8400
20.40
Sell
7900
32.35
Buy
8300
46.10
Buy
8000
49.55
25.70
74.30
8325.70
17.20
82.80
7982.80
Sell
8400
20.40
Sell
7900
32.35
Note: Above mentioned Bullish or Bearish Spreads in Nifty (June Series) are given as an information and not as a recommendation.
Nifty Put-Call Analysis
3
Technical & Derivatives Report
June 20, 2016
Daily Pivot Levels for Nifty Constituents
Scrips
S2
S1
PIVOT
R1
R2
ACC
1,538
1,547
1,553
1,562
1,568
ADANIPORTS
205
206
208
209
211
AMBUJACEM
233
234
236
237
239
ASIANPAINT
982
991
1,003
1,012
1,024
AUROPHARMA
714
721
732
739
749
AXISBANK
519
523
529
532
538
BAJAJ-AUTO
2,542
2,562
2,575
2,595
2,609
BANKBARODA
146
148
151
153
155
BHEL
120
121
123
124
125
BPCL
990
997
1,009
1,016
1,027
BHARTIARTL
339
348
353
362
368
INFRATEL
325
332
341
348
357
BOSCH
21,666
21,871
22,016
22,220
22,365
CIPLA
481
484
487
490
493
COALINDIA
305
309
312
316
318
DRREDDY
2,937
2,970
3,033
3,065
3,128
EICHERMOT
18,564
18,672
18,783
18,890
19,001
GAIL
382
384
386
389
391
GRASIM
4,278
4,302
4,326
4,350
4,374
HCLTECH
745
749
752
756
759
HDFCBANK
1,159
1,164
1,171
1,177
1,184
HDFC
1,199
1,213
1,225
1,239
1,250
HEROMOTOCO
2,995
3,013
3,034
3,052
3,073
HINDALCO
117
118
119
120
121
HINDUNILVR
867
874
880
887
892
ICICIBANK
232
235
239
242
246
IDEA
99
100
101
102
103
INDUSINDBK
1,075
1,087
1,097
1,109
1,120
INFY
1,165
1,172
1,182
1,190
1,200
ITC
353
357
359
362
364
KOTAKBANK
741
746
754
758
766
LT
1,455
1,468
1,485
1,498
1,515
LUPIN
1,445
1,454
1,466
1,475
1,487
M&M
1,327
1,336
1,348
1,356
1,368
MARUTI
4,057
4,086
4,122
4,151
4,187
NTPC
150
151
152
153
154
ONGC
209
210
211
212
214
POWERGRID
151
154
156
159
161
RELIANCE
966
970
975
979
983
SBIN
208
211
214
217
220
SUNPHARMA
729
736
747
754
765
TCS
2,540
2,571
2,591
2,622
2,642
TATAMTRDVR
307
310
312
314
316
TATAMOTORS
454
459
462
468
471
TATAPOWER
70
72
74
76
78
TATASTEEL
318
322
328
331
337
TECHM
527
531
537
541
546
ULTRACEMCO
3,254
3,279
3,301
3,326
3,348
WIPRO
547
549
552
554
557
YESBANK
1,054
1,062
1,069
1,077
1,084
ZEEL
444
447
453
456
461
4
Technical & Derivatives Report
June 20, 2016
Research Team Tel: 022 - 39357800
For Technical Queries
For Derivatives Queries
DISCLAIMER
Angel Broking Private Limited (hereinafter referred to as “Angel”) is a registered Member of National Stock Exchange of India Limited,
Bombay Stock Exchange Limited and MCX Stock Exchange Limited. It is also registered as a Depository Participant with CDSL and
Portfolio Manager with SEBI. It also has registration with AMFI as a Mutual Fund Distributor. Angel Broking Private Limited is a
registered entity with SEBI for Research Analyst in terms of SEBI (Research Analyst) Regulations, 2014 vide registration number
INH000000164. Angel or its associates has not been debarred/ suspended by SEBI or any other regulatory authority for accessing
/dealing in securities Market. Angel or its associates including its relatives/analyst do not hold any financial interest/beneficial
ownership of more than 1% in the company covered by Analyst. Angel or its associates/analyst has not received any compensation /
managed or co-managed public offering of securities of the company covered by Analyst during the past twelve months. Angel/analyst
has not served as an officer, director or employee of company covered by Analyst and has not been engaged in market making activity
of the company covered by Analyst.
This document is solely for the personal information of the recipient, and must not be singularly used as the basis of any investment
decision. Nothing in this document should be construed as investment or financial advice. Each recipient of this document should
make such investigations as they deem necessary to arrive at an independent evaluation of an investment in the securities of the
companies referred to in this document (including the merits and risks involved), and should consult their own advisors to determine
the merits and risks of such an investment.
Reports based on technical and derivative analysis center on studying charts of a stock's price movement, outstanding positions and
trading volume, as opposed to focusing on a company's fundamentals and, as such, may not match with a report on a company's
fundamentals.
The information in this document has been printed on the basis of publicly available information, internal data and other reliable
sources believed to be true, but we do not represent that it is accurate or complete and it should not be relied on as such, as this
document is for general guidance only. Angel Broking Pvt. Limited or any of its affiliates/ group companies shall not be in any way
responsible for any loss or damage that may arise to any person from any inadvertent error in the information contained in this report.
Angel Broking Pvt. Limited has not independently verified all the information contained within this document. Accordingly, we cannot
testify, nor make any representation or warranty, express or implied, to the accuracy, contents or data contained within this document.
While Angel Broking Pvt. Limited endeavors to update on a reasonable basis the information discussed in this material, there may be
regulatory, compliance, or other reasons that prevent us from doing so.
This document is being supplied to you solely for your information, and its contents, information or data may not be reproduced,
redistributed or passed on, directly or indirectly.
Neither Angel Broking Pvt. Limited, nor its directors, employees or affiliates shall be liable for any loss or damage that may arise from
or in connection with the use of this information.
Note: Please refer to the important ‘Stock Holding Disclosure' report on the Angel website (Research Section). Also, please refer to the
latest update on respective stocks for the disclosure status in respect of those stocks. Angel Broking Pvt. Limited and its affiliates may
have investment positions in the stocks recommended in this report.
5