Technical & Derivatives Report
April 20, 2016
Sensex (25816) / Nifty (7915)
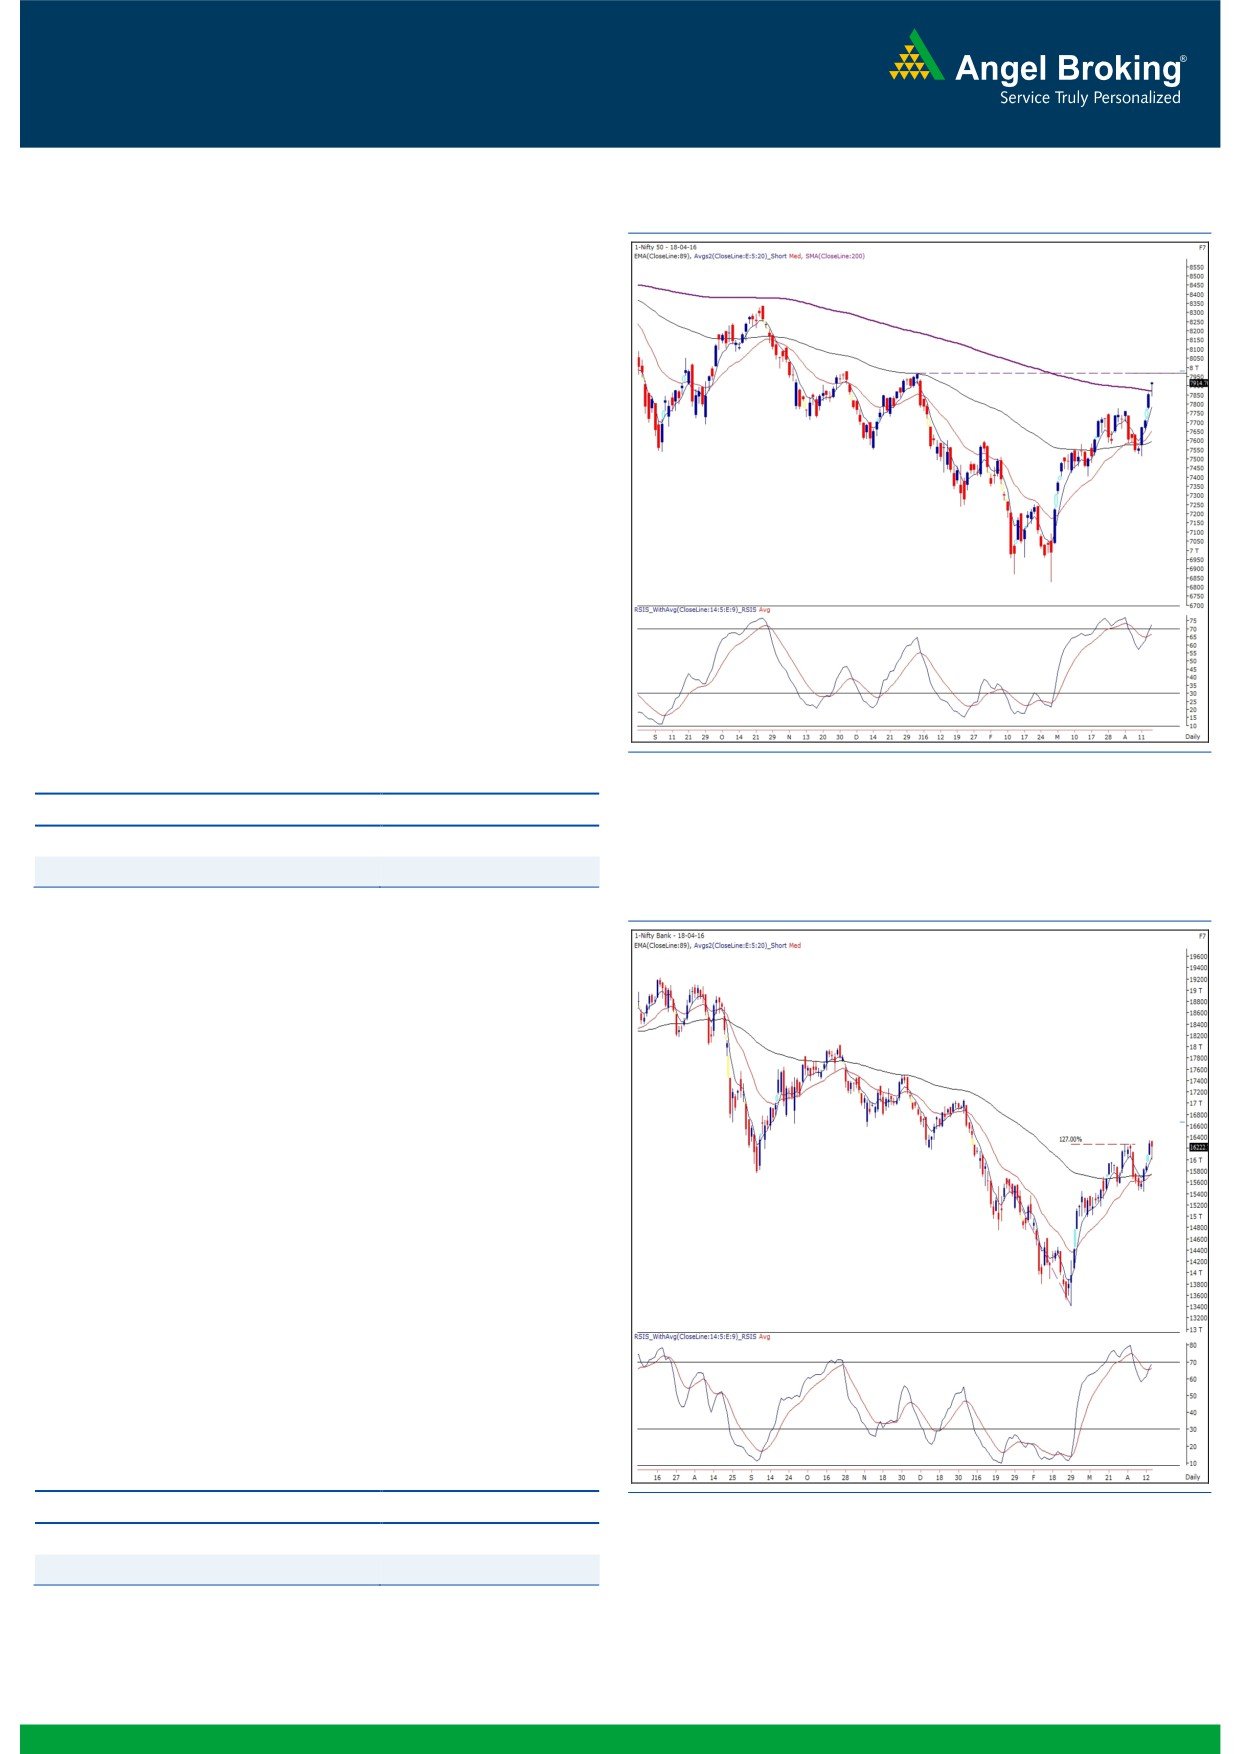
Exhibit 1: Nifty Daily Chart
On Monday, finally, the Nifty reached and closed marginally
above the mostly observed technical evidence i.e. ‘200 SMA’
placed around 7875. Generally, this development is considered
as a positive signal for the market. But, on this occasion, despite
seeing a strong momentum in last four sessions, we are a bit
skeptical about going long at current level (at least in indices).
The important reason behind this approach is the strong hurdle at
7972 (January month swing high) which is likely to act as an
immediate hurdle. Also, prices crossing ‘200 SMA’ for 2 - 3 days
cannot be considered as an extremely bullish signal. We need to
wait for the index to sustain and maintain its position above this
hurdle in order to expect a move beyond the 8000 mark. Thus, as
of now, traders are advised to lighten up their long positions in
index in the zone of 7930 - 7972 and then wait for further
developments. In case of a minor profit booking, we may see
Nifty correcting back to 7842 - 7775 levels. Traders are advised
to keep focusing on individual stocks which have a strong chart
structure.
Key Levels
Support 1 - 7842
Resistance 1 - 7930
Support 2 - 7775
Resistance 2 - 7972
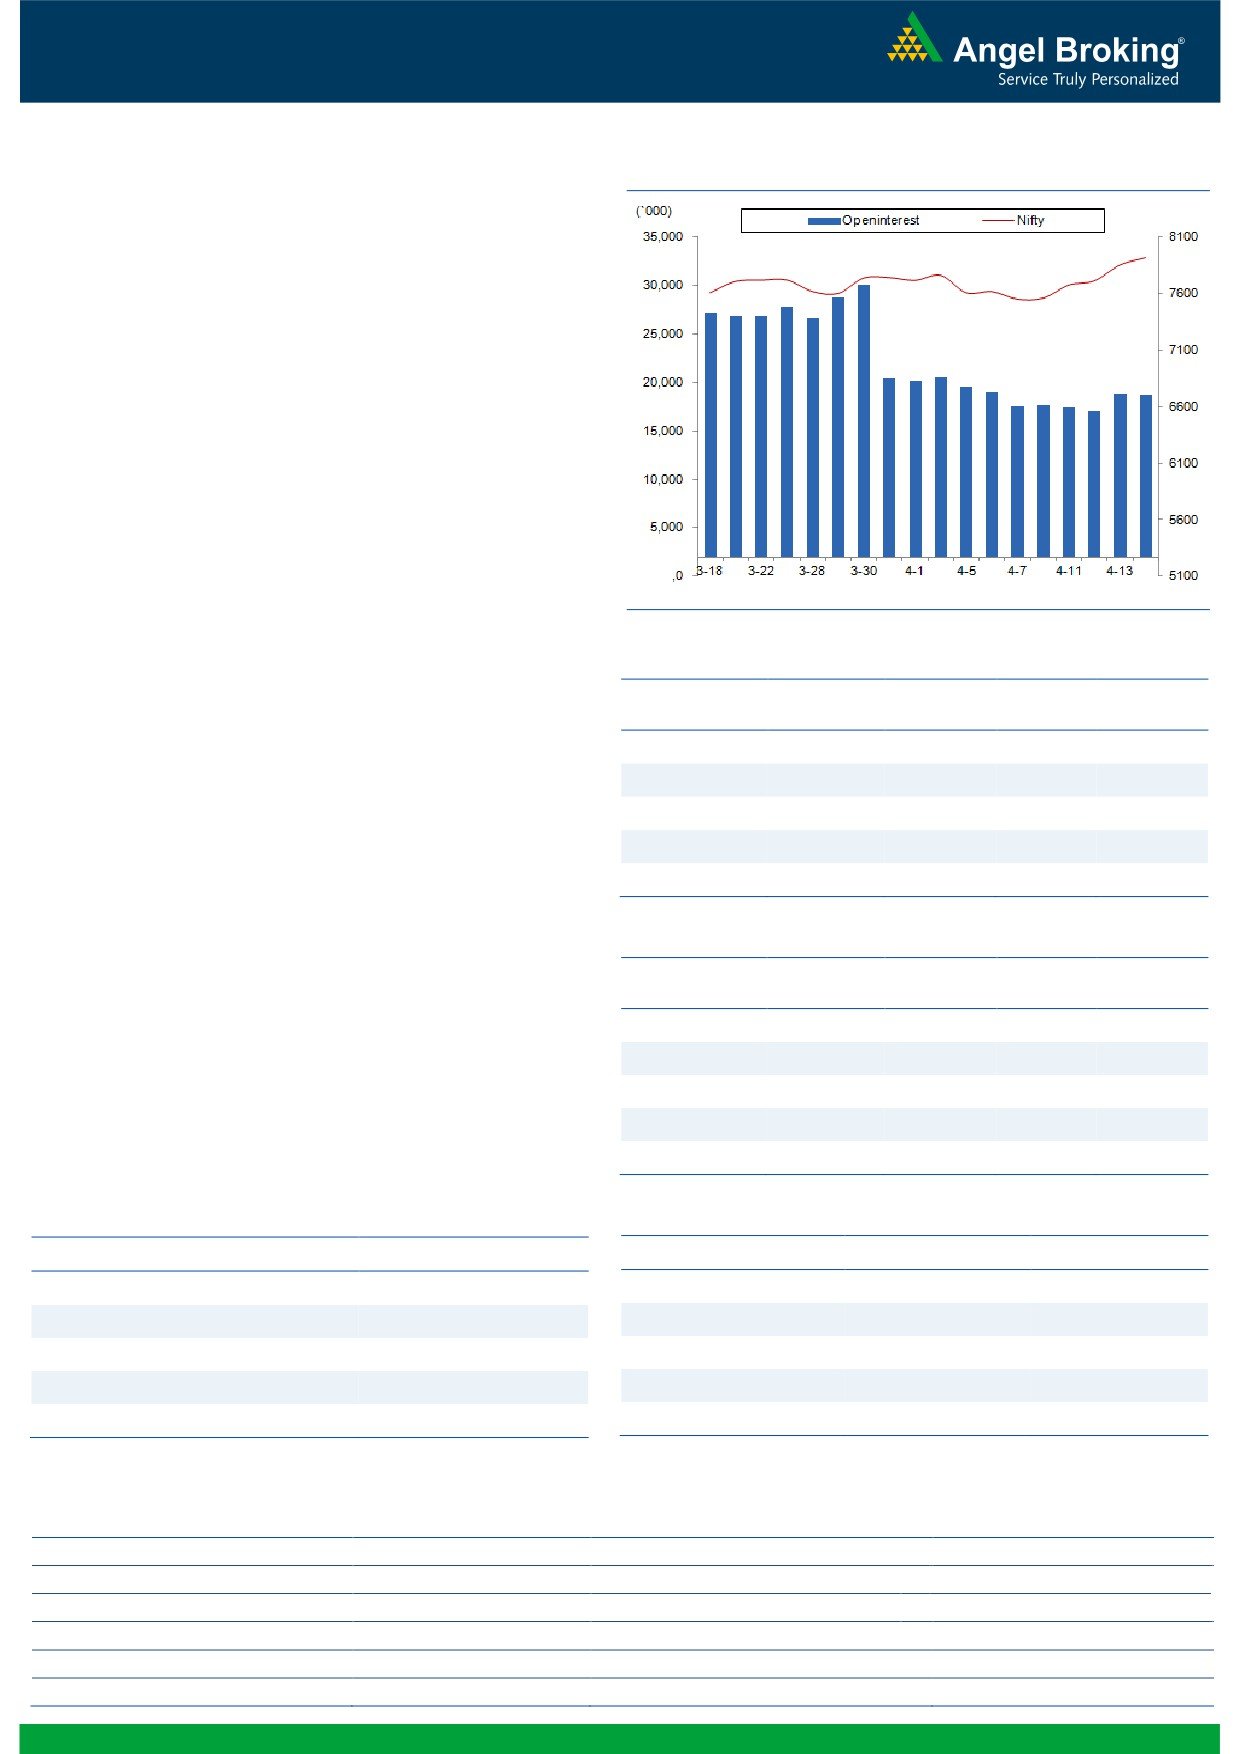
Exhibit 2: Nifty Bank Daily Chart
Nifty Bank Outlook - (16223)
The Nifty Bank index opened on a flat note on Monday and
started correcting from the first tick. Post the sharp correction in
initial hour of trade, the banking index rebounded from lower
levels and traded in a sideways direction for remaining part of the
session. Eventually, the Nifty Bank index closed with marginal loss
of 0.34 percent over its previous close.
The overall chart structure remains positive as there is no sign of
reversal seen on charts. Currently, the index is trading near its
resistance of 127% reciprocal retracement level (16500 - 16550)
of the previous corrective move from 16283 to 15440, which
coincides with the ‘Super Trend’ resistance and ’89 EMA’ on
weekly chart. However, we should not pre-emt any reversal as of
now and wait for further developments. Traders are hence
advised to continue to trade in the direction of the trend and
follow strict risk management strategy on their trading positions.
Intraday support for Nifty Bank is placed around 16140 and
15975 whereas resistance are seen around 16390 and 16510.
Key Levels
Support 1 - 16140
Resistance 1 - 16390
Support 2 - 15975
Resistance 2 - 16510
1
Technical & Derivatives Report
April 20, 2016
Comments
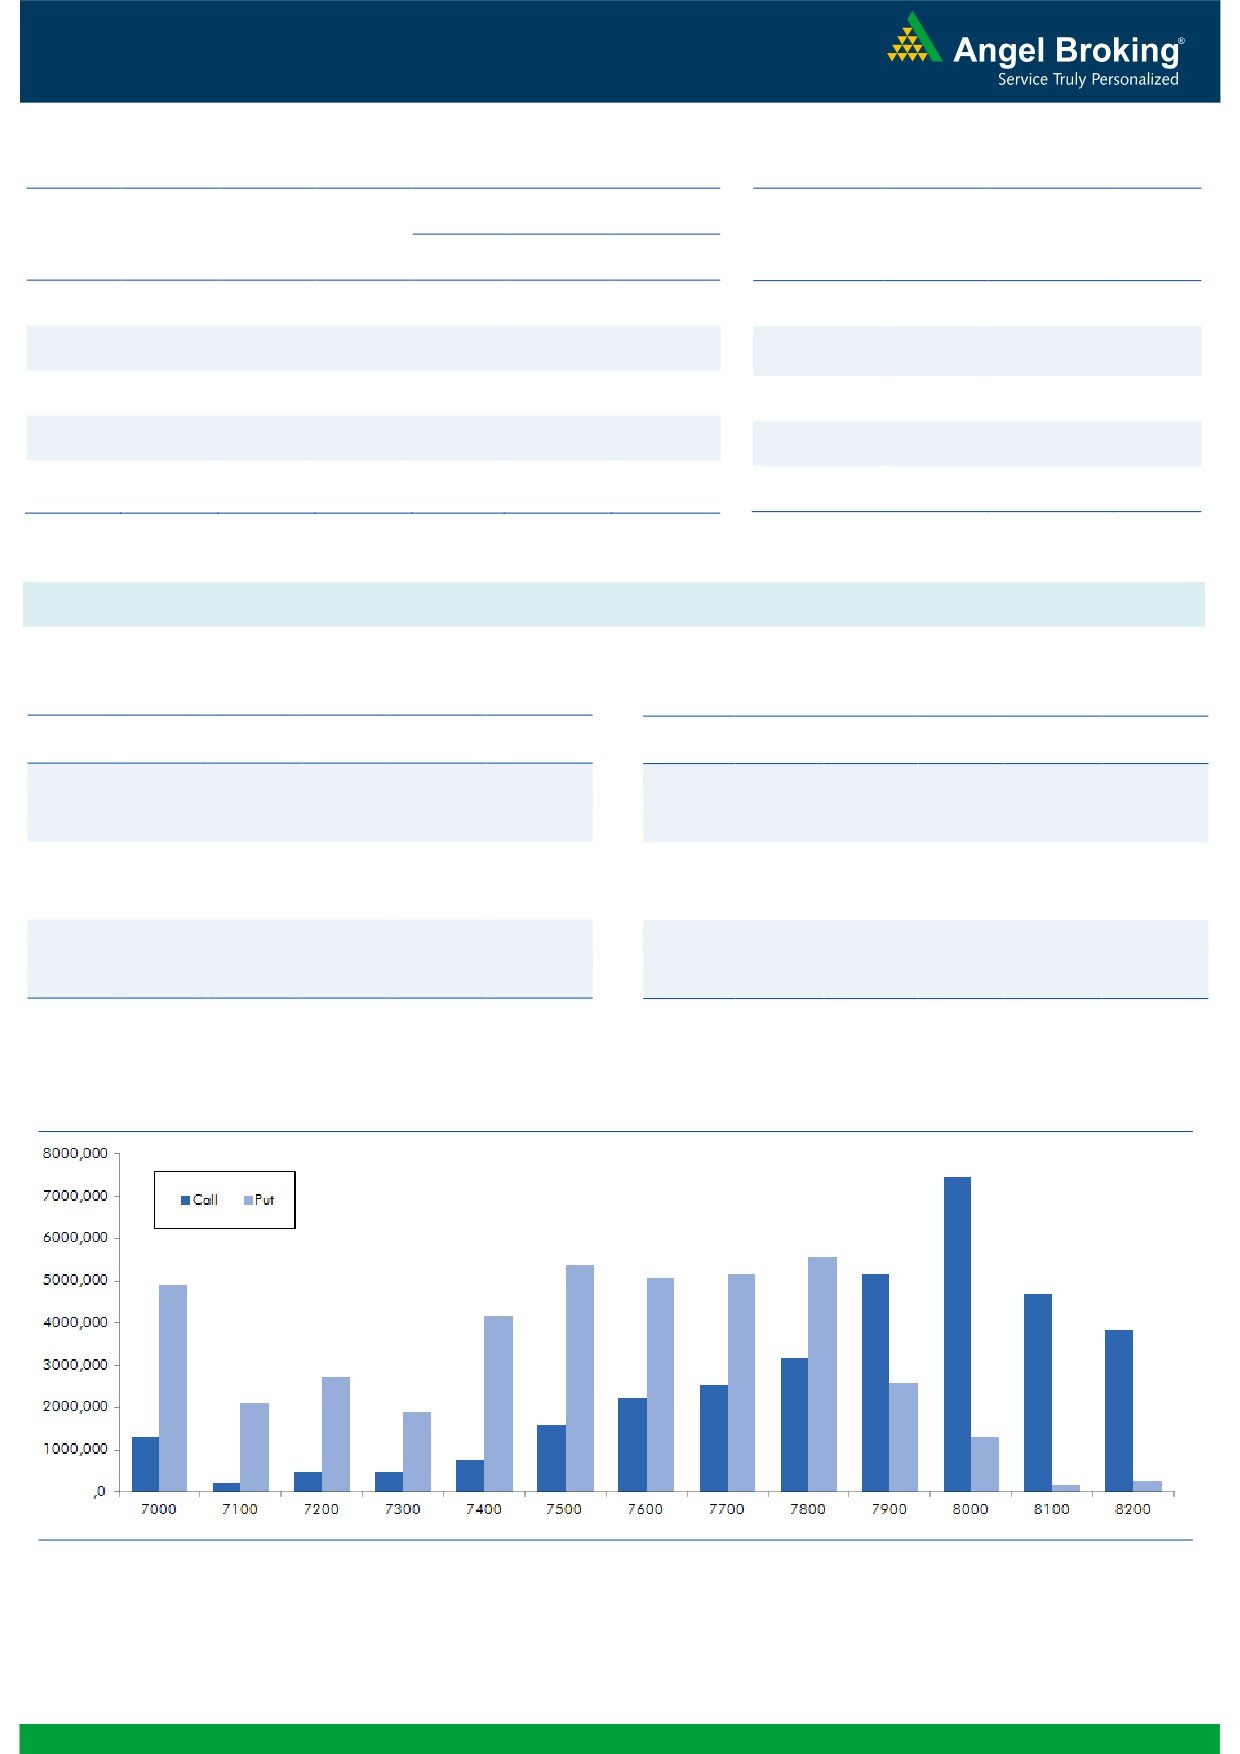
Nifty Vs OI
The Nifty futures open interest has decreased by 0.46%
BankNifty futures open interest has decreased by 2.16%
as market closed at 7914.70 levels.
The Nifty April future closed at a premium of 5.60 points
against a premium of 17.40 points. The May series
closed at a premium of 41.10 points.
The Implied Volatility of at the money options has
increased from 13.10% to 15.16%.
The total OI of the market is Rs. 2,21,662/- cr. and the
stock futures OI is Rs. 57,214/- cr.
Few of the liquid counters where we have seen high cost
of carry are JPASSOCIAT, UNITECH, GMRINFRA,
ADANIPOWER and GODREJIND.
Views
FIIs continue buying in cash market segment; they
OI Gainers
bought equities to the tune of Rs. 978 crores. While in
OI
PRICE
SCRIP
OI
PRICE
Index Futures, they were net buyers of Rs. 631 crores with
CHG. (%)
CHG. (%)
decline in OI, suggesting covering of shorts in last
CUMMINSIND
307200
15.84
892.50
-1.90
trading session.
VOLTAS
4520000
12.77
294.65
3.64
In Index Options front, FIIs were net buyers of Rs. 655
TITAN
6363000
10.99
360.20
2.14
crores with some rise in OI. In call options, we hardly
TCS
4185400
9.96
2529.40
-0.14
saw any meaningful OI addition.
8100 call options
DABUR
4072000
9.11
273.40
2.22
remained comparatively active in terms of volume and it
also added some build-up. Whereas, in put options,
OI Losers
build-up was scattered in the range of
7500-7900
OI
PRICE
SCRIP
OI
PRICE
strikes. Huge OI addition was visible in
7800 put
CHG. (%)
CHG. (%)
options. Maximum OI in current series is visible in 8000
PIDILITIND
880000
-9.93
626.45
1.81
call and
7500 put options. After continuous profit
ICICIBANK
42352100
-8.81
237.00
-1.88
booking, we witnessed formation of fresh long positions
HDFC
10837600
-8.21
1133.60
1.44
in Index Futures in last week. One should trade with a
JSWENERGY
5862000
-6.86
71.60
2.29
positive bias till we see any meaningful change in data.
LUPIN
4623000
-6.61
1576.40
1.75
Historical Volatility
Put-Call Ratio
SCRIP
HV
SCRIP
PCR-OI
PCR-VOL
INFY
38.06
NIFTY
1.08
1.05
BPCL
38.05
BANKNIFTY
0.92
0.75
AMARAJABAT
35.10
INFY
0.56
0.60
PETRONET
44.16
SBIN
0.36
0.31
ULTRACEMCO
37.30
TCS
1.10
0.82
Strategy Date
Symbol
Strategy
Status
April 04, 2016
TCS
Ratio Bear Put Spread
Active
April 11, 2016
ITC
Short Strangle
Active
April 18, 2016
NIFTY
Long Call
Active
2
Technical & Derivatives Report
April 20, 2016
FII Statistics for 18-April 2016
Turnover on 18-April 2016
Open Interest
No. of
Turnover
Change
Detail
Buy
Sell
Net
Instrument
Value
Contracts
( in Cr. )
(%)
Contracts
Change (%)
(in Cr.)
INDEX
INDEX
2253.67
1622.66
631.01
241742
13946.09
(1.40)
269176
14867.72
-18.38
FUTURES
FUTURES
INDEX
INDEX
27103.23
26448.65
654.58
1140157
66851.35
0.53
3093641
178755.82
-23.64
OPTIONS
OPTIONS
STOCK
4991.32
3964.86
1026.46
1005566
48441.80
0.01
STOCK
FUTURES
540251
27512.98
-9.75
FUTURES
STOCK
STOCK
3535.18
3610.05
(74.88)
82356
4029.63
8.57
OPTIONS
383847
20302.87
-1.07
OPTIONS
TOTAL
37883.39
35646.22
2237.17
2469821
133268.87
0.37
TOTAL
4286915
241439.40
-20.40
Nifty Spot = 7914.70
Lot Size = 75
Bull-Call Spreads
Bear-Put Spreads
Action
Strike
Price
Risk
Reward
BEP
Action
Strike
Price
Risk
Reward
BEP
Buy
7900
88.95
Buy
7900
71.55
47.20
52.80
7947.20
31.65
68.35
7868.35
Sell
8000
41.75
Sell
7800
39.90
Buy
7900
88.95
Buy
7900
71.55
72.90
127.10
7972.90
49.45
150.55
7850.55
Sell
8100
16.05
Sell
7700
22.10
Buy
8000
41.75
Buy
7800
39.90
25.70
74.30
8025.70
17.80
82.20
7782.20
Sell
8100
16.05
Sell
7700
22.10
Note: Above mentioned Bullish or Bearish Spreads in Nifty (April Series) are given as an information and not as a recommendation.
Nifty Put-Call Analysis
3
Technical & Derivatives Report
April 20, 2016
Daily Pivot Levels for Nifty Constituents
Scrips
S2
S1
PIVOT
R1
R2
ACC
1,425
1,445
1,457
1,476
1,489
ADANIPORTS
223
227
232
236
241
AMBUJACEM
224
226
230
233
237
ASIANPAINT
871
878
882
890
894
AUROPHARMA
771
777
783
789
795
AXISBANK
434
440
443
448
452
BAJAJ-AUTO
2,483
2,514
2,562
2,593
2,641
BANKBARODA
144
146
149
151
154
BHEL
129
131
133
134
136
BPCL
904
937
958
991
1,013
BHARTIARTL
347
353
358
364
369
INFRATEL
381
389
400
407
418
BOSCH
19,499
19,780
20,015
20,296
20,531
CIPLA
500
512
519
531
538
COALINDIA
272
274
276
278
281
DRREDDY
2,987
3,039
3,074
3,126
3,161
EICHERMOT
19,579
19,924
20,262
20,606
20,945
GAIL
351
355
362
366
372
GRASIM
3,974
4,032
4,071
4,129
4,168
HCLTECH
837
845
853
861
869
HDFCBANK
1,063
1,076
1,084
1,096
1,104
HDFC
1,076
1,104
1,122
1,150
1,168
HEROMOTOCO
2,972
3,013
3,087
3,128
3,201
HINDALCO
93
95
96
98
99
HINDUNILVR
878
889
897
907
915
ICICIBANK
229
233
239
243
248
IDEA
113
117
119
123
126
INDUSINDBK
970
979
986
996
1,003
INFY
1,212
1,226
1,247
1,260
1,281
ITC
328
332
335
339
342
KOTAKBANK
644
664
677
697
711
LT
1,192
1,222
1,240
1,270
1,288
LUPIN
1,517
1,546
1,572
1,601
1,627
M&M
1,299
1,320
1,337
1,358
1,376
MARUTI
3,646
3,683
3,716
3,753
3,786
NTPC
135
137
138
141
142
ONGC
203
205
208
211
214
POWERGRID
141
144
145
148
149
RELIANCE
1,051
1,058
1,062
1,069
1,074
SBIN
182
184
188
190
194
SUNPHARMA
822
830
835
844
849
TCS
2,391
2,455
2,504
2,569
2,618
TATAMTRDVR
294
298
300
303
306
TATAMOTORS
399
403
407
411
414
TATAPOWER
68
69
70
70
71
TATASTEEL
324
330
333
339
343
TECHM
467
472
477
482
487
ULTRACEMCO
3,170
3,288
3,353
3,470
3,535
WIPRO
573
581
588
595
602
YESBANK
848
871
884
907
920
ZEEL
393
400
405
412
417
4
Technical & Derivatives Report
April 20, 2016
Research Team Tel: 022 - 39357800
For Technical Queries
For Derivatives Queries
DISCLAIMER
Angel Broking Private Limited (hereinafter referred to as “Angel”) is a registered Member of National Stock Exchange of India Limited,
Bombay Stock Exchange Limited and MCX Stock Exchange Limited. It is also registered as a Depository Participant with CDSL and
Portfolio Manager with SEBI. It also has registration with AMFI as a Mutual Fund Distributor. Angel Broking Private Limited is a
registered entity with SEBI for Research Analyst in terms of SEBI (Research Analyst) Regulations, 2014 vide registration number
INH000000164. Angel or its associates has not been debarred/ suspended by SEBI or any other regulatory authority for accessing
/dealing in securities Market. Angel or its associates including its relatives/analyst do not hold any financial interest/beneficial
ownership of more than 1% in the company covered by Analyst. Angel or its associates/analyst has not received any compensation /
managed or co-managed public offering of securities of the company covered by Analyst during the past twelve months. Angel/analyst
has not served as an officer, director or employee of company covered by Analyst and has not been engaged in market making activity
of the company covered by Analyst.
This document is solely for the personal information of the recipient, and must not be singularly used as the basis of any investment
decision. Nothing in this document should be construed as investment or financial advice. Each recipient of this document should
make such investigations as they deem necessary to arrive at an independent evaluation of an investment in the securities of the
companies referred to in this document (including the merits and risks involved), and should consult their own advisors to determine
the merits and risks of such an investment.
Reports based on technical and derivative analysis center on studying charts of a stock's price movement, outstanding positions and
trading volume, as opposed to focusing on a company's fundamentals and, as such, may not match with a report on a company's
fundamentals.
The information in this document has been printed on the basis of publicly available information, internal data and other reliable
sources believed to be true, but we do not represent that it is accurate or complete and it should not be relied on as such, as this
document is for general guidance only. Angel Broking Pvt. Limited or any of its affiliates/ group companies shall not be in any way
responsible for any loss or damage that may arise to any person from any inadvertent error in the information contained in this report.
Angel Broking Pvt. Limited has not independently verified all the information contained within this document. Accordingly, we cannot
testify, nor make any representation or warranty, express or implied, to the accuracy, contents or data contained within this document.
While Angel Broking Pvt. Limited endeavors to update on a reasonable basis the information discussed in this material, there may be
regulatory, compliance, or other reasons that prevent us from doing so.
This document is being supplied to you solely for your information, and its contents, information or data may not be reproduced,
redistributed or passed on, directly or indirectly.
Neither Angel Broking Pvt. Limited, nor its directors, employees or affiliates shall be liable for any loss or damage that may arise from
or in connection with the use of this information.
Note: Please refer to the important ‘Stock Holding Disclosure' report on the Angel website (Research Section). Also, please refer to the
latest update on respective stocks for the disclosure status in respect of those stocks. Angel Broking Pvt. Limited and its affiliates may
have investment positions in the stocks recommended in this report.
5