Technical & Derivatives Report
January 20, 2016
Sensex (24480) / Nifty (7435)
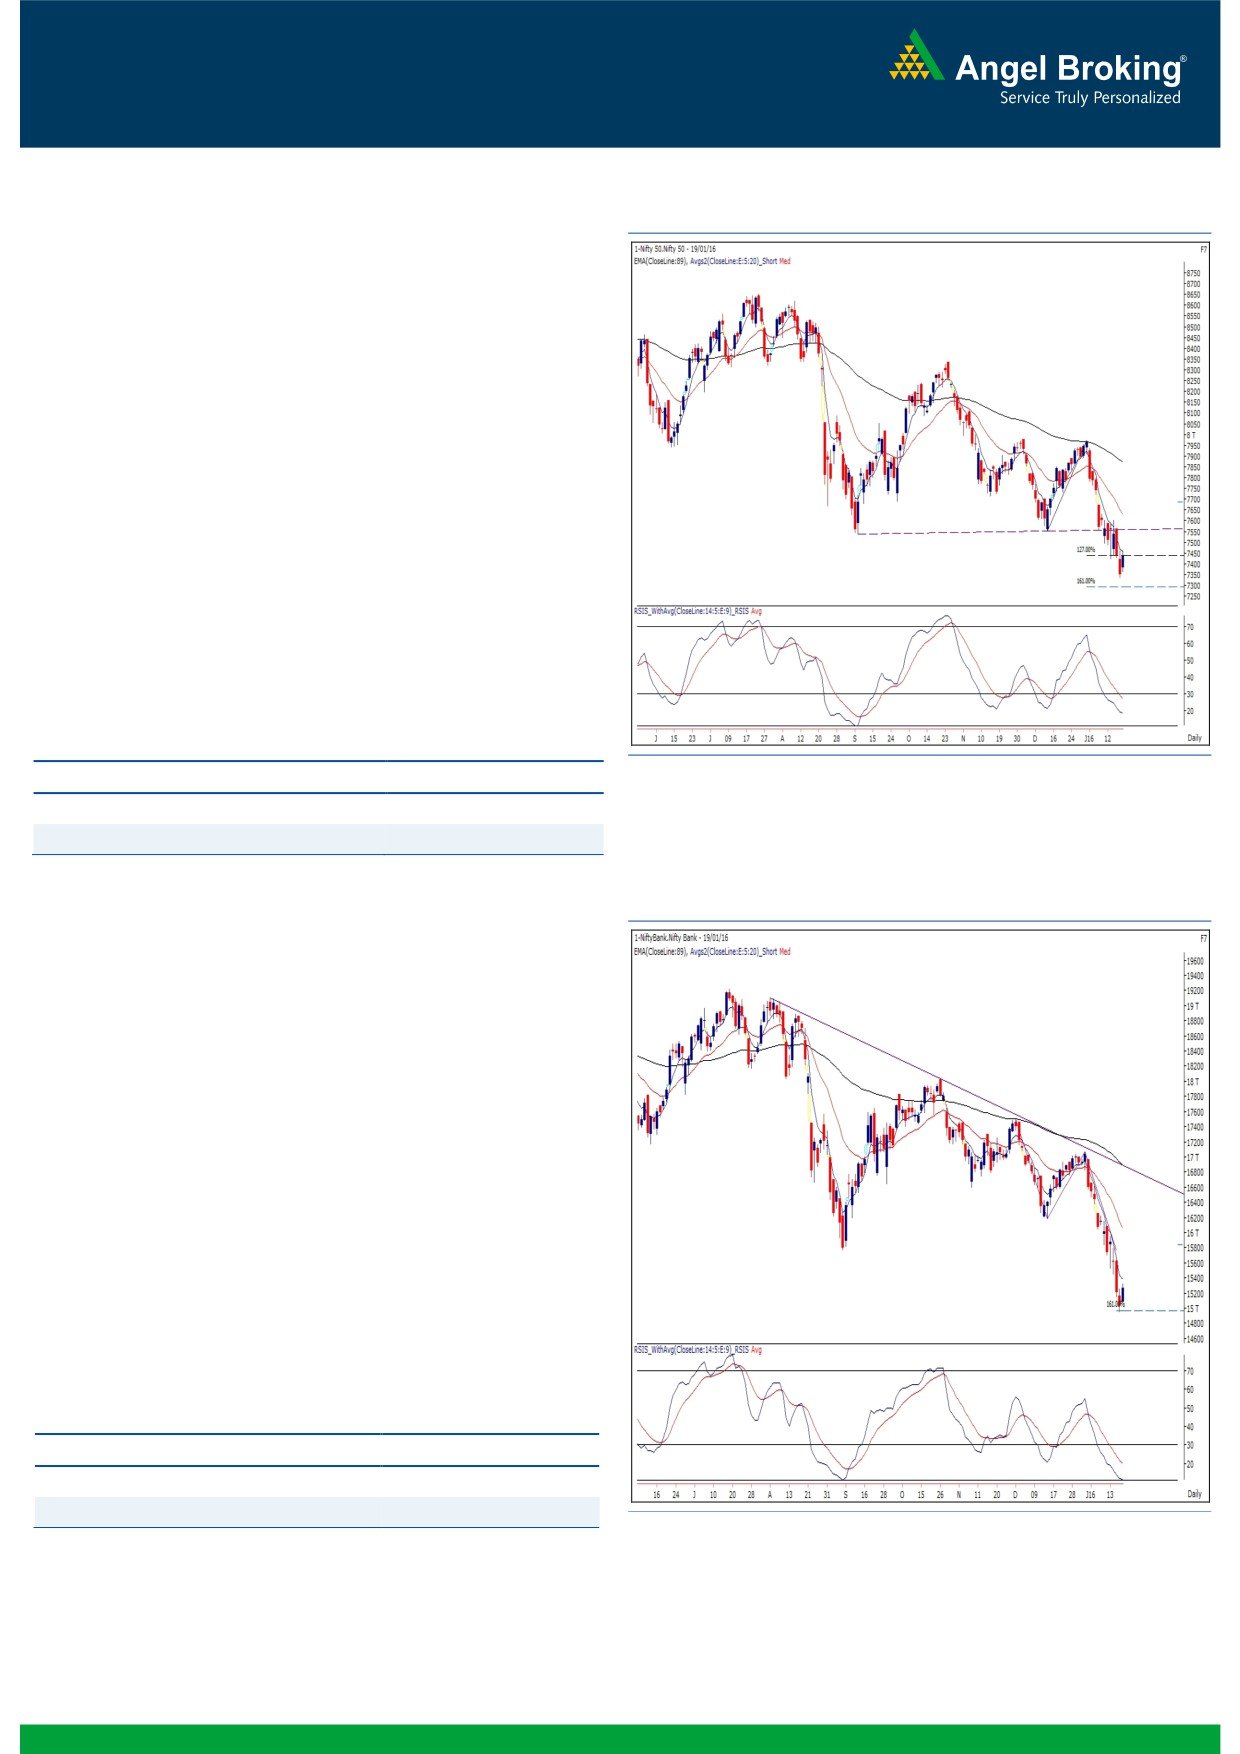
Exhibit 1: Nifty Daily Chart
Yesterday, our benchmark index opened with an upside gap
owing to positive cues from the Asian bourses. During the
remaining part of the day, the Nifty managed to give steady
up move to close with more than a percent gains. Yesterday,
we witnessed a relief rally across the globe, which certainly
had a rub-off effect on our market. We would have been more
convinced on this relief rally if the Nifty had tested 7320 -
7300 levels. Going forward, we would closely keep our eyes
on Monday’s high of 7463.65. If the Nifty manages to surpass
this level on a sustainable basis then we may witness a
continuation of this bounce towards 7520 - 7580 levels.
However, a failure to sustain above this level may trim its
previous day’s gains. In case of the second scenario, it’s
advisable not to short the index for smaller moves as we are
seeing a strong support zone around 7340 - 7300. Hence, it
would be advisable to cover short positions at the mentioned
support zone and wait for further market developments.
Key Levels
Support 1 - 7340
Resistance 1 - 7464
Support 2 - 7300
Resistance 2 - 7520
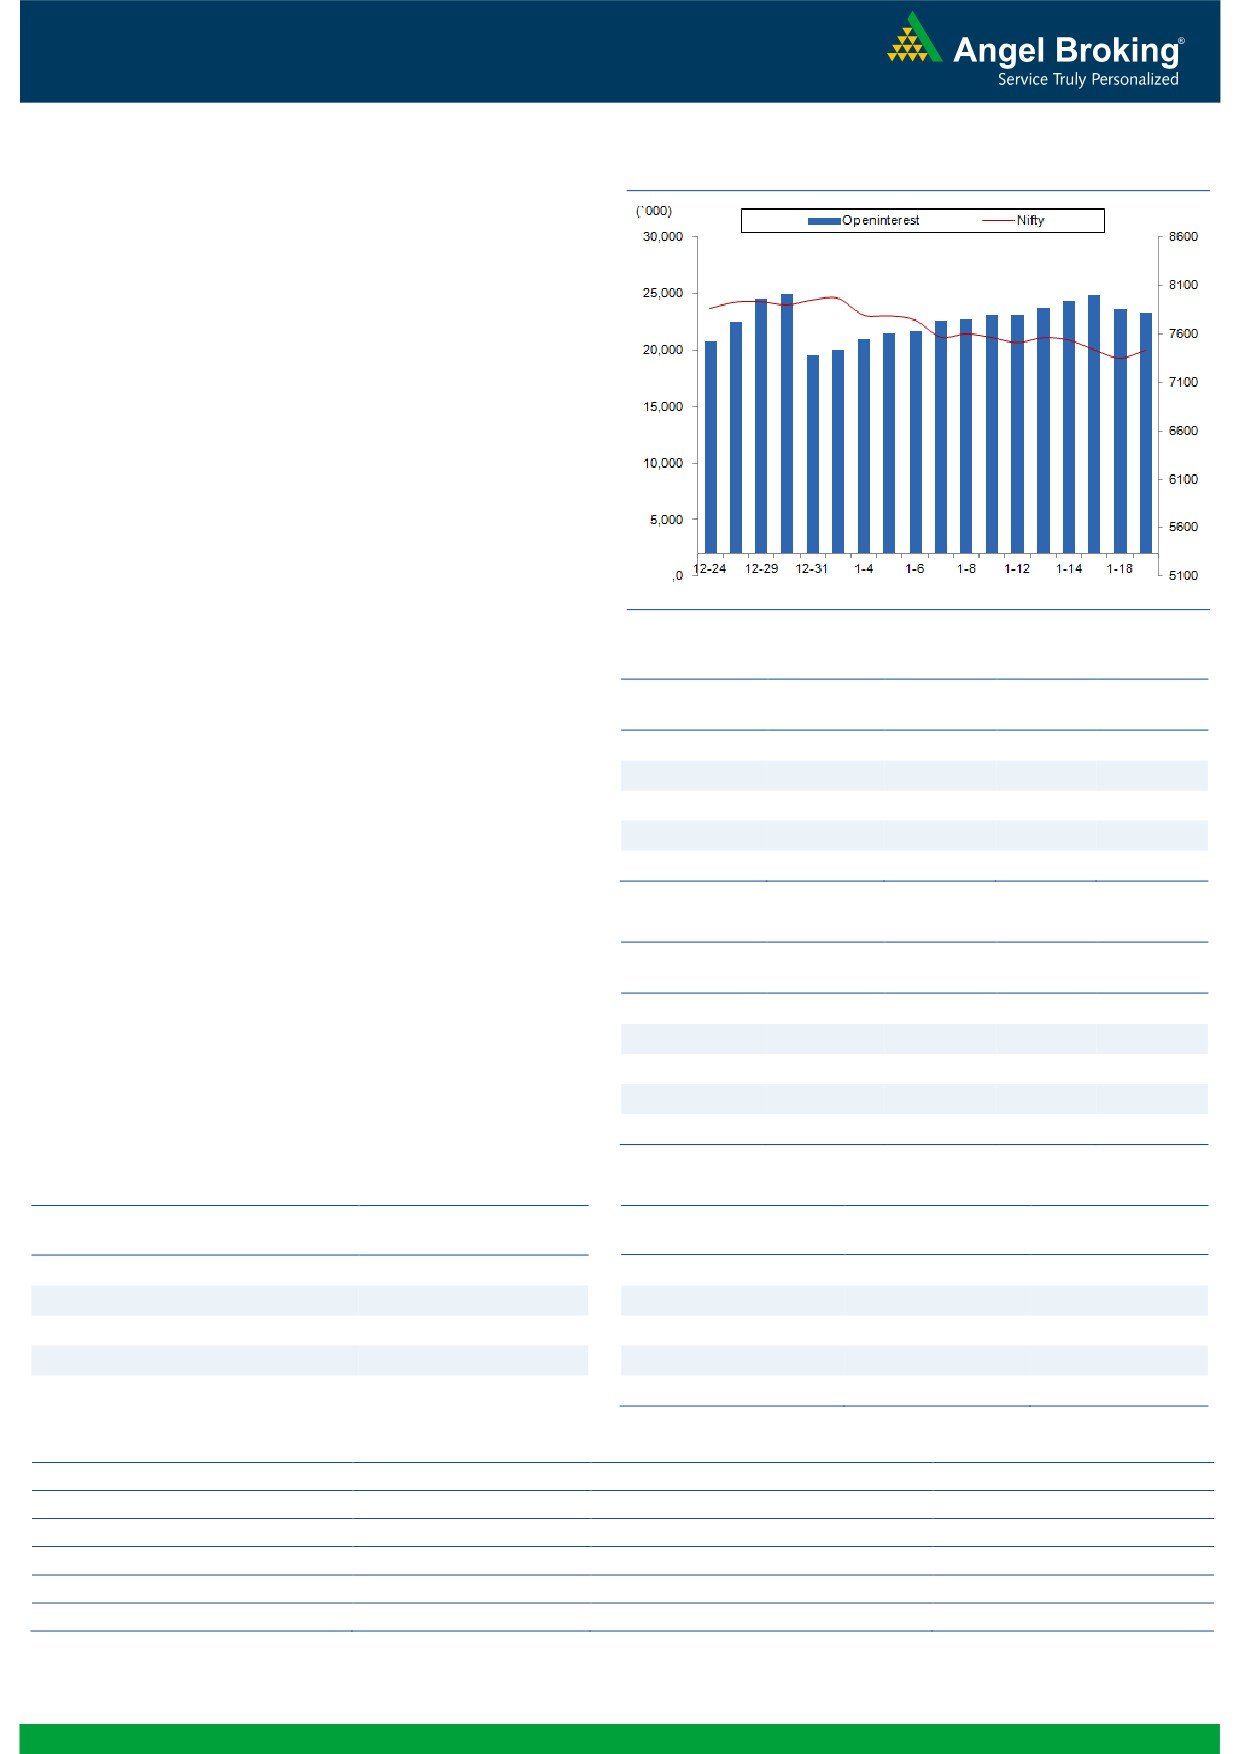
Exhibit 2: Bank Nifty Daily Chart
Bank Nifty Outlook - (15270)
The Nifty Bank index opened on a positive note and crept
higher throughout the session. Eventually, the banking index
ended the session with gains of 1.66 percent over its previous
close. After eleven trading sessions, the Nifty Bank index
managed to cross its previous day’s high, this shows some
relief for the Bulls. The index has moved higher from the
support zone in the weekly chart as we had mentioned in our
yesterday's report. The mentioned support also coincides with
a support of 161.80% retracement levels of the previous up
move in the daily chart. The 'RSI' indicator is in oversold zone
and is showing signs of pullback from the zone. Thus, the
index can give a pullback move in near term. The near term
support for the index are placed around 15086 and 14956
levels; whereas, resistances are seen around 15453 and
15650 levels.
Key Levels
Support 1 - 15086
Resistance 1 - 15453
Support 2 - 14956
Resistance 2 - 15650
1
Technical & Derivatives Report
January 20, 2016
Comments
Nifty Vs OI
The Nifty futures open interest has decreased by 1.25%
BankNifty futures open interest has decreased by 2.08%
as market closed at 7435.10.00 levels.
The Nifty January future closed at a premium of 3.00
points against a premium of 21.25 points. The February
series closed at a premium of 22.10 points.
The Implied Volatility of at the money options has
decreased from 18.43% to 15.94 %.
The total OI of the market is Rs. 2,51,471/- cr. and the
stock futures OI is Rs. 61,306/- cr.
Few of the liquid counters where we have seen high cost
of carry are JPASSOCIAT, UNITECH, NHPC, GMRINFRA
and HEXAWARE.
Views
OI Gainers
In equity segment, FIIs were net sellers to the tune of Rs.
OI
PRICE
858 crores. In Index Futures, they were net buyers of
SCRIP
OI
PRICE
CHG. (%)
CHG. (%)
worth Rs. 391 with marginal fall in OI, indicating blend
STAR
2188800
7.93
1053.85
3.43
of long build-up and short covering in last trading
M&M
3032000
7.87
1152.45
-1.51
session.
GODREJCP
152400
7.63
1212.30
0.10
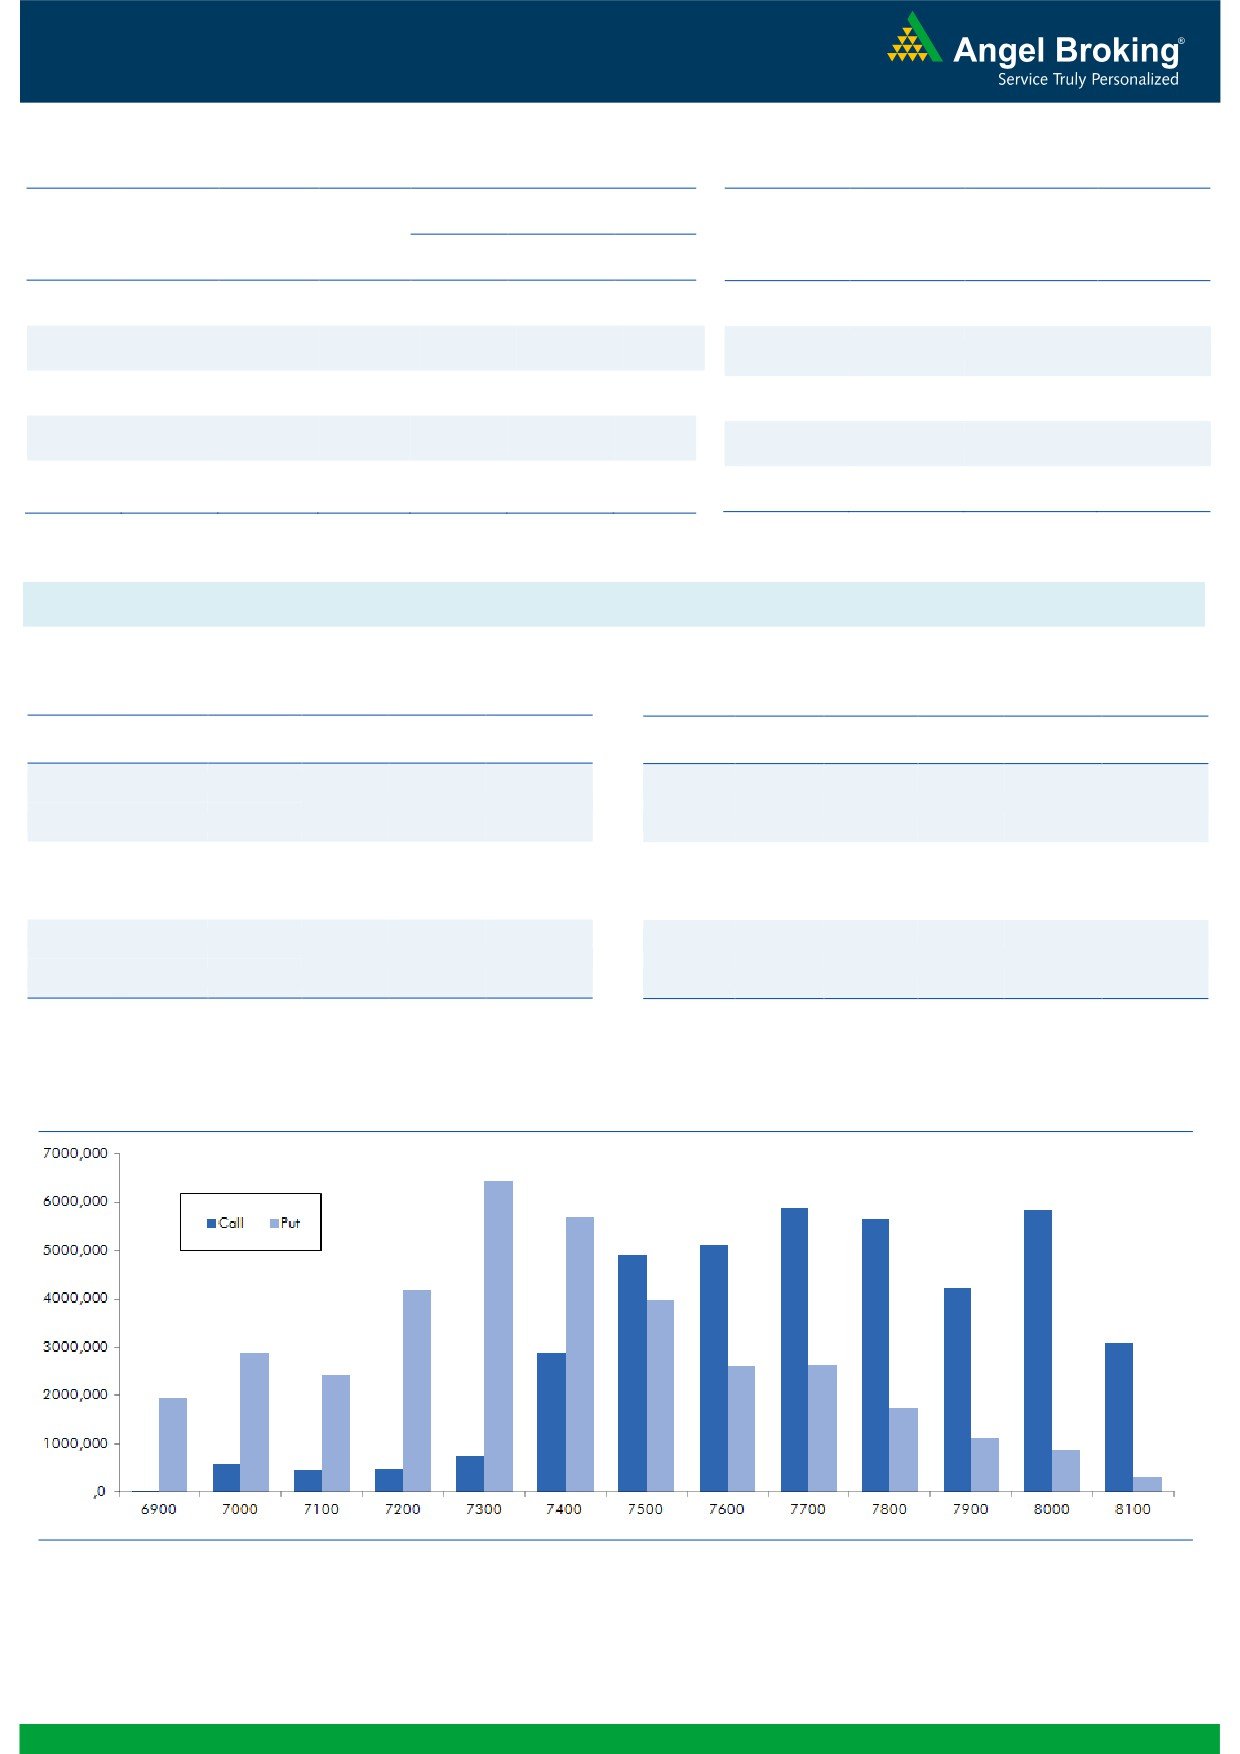
In Index Options front, they bought of Rs. 794 crores with
NHPC
37287000
7.22
19.50
1.56
rise in open interest. In call options, we hardly saw any
BHARTIARTL
24520800
6.54
309.95
3.77
meaningful activity. 7500 call option was most active
added some OI. Whereas, in put options, 6900 strike
OI Losers
added decent build-up with fall in IV’s, which suggests
OI
PRICE
writing in this strike. While, some unwinding was witness
SCRIP
OI
PRICE
CHG. (%)
CHG. (%)
in 7300 strike price. Maximum build-up in current series
WOCKPHARMA
2974125
-12.10
1212.25
0.24
is visible in 7700 call and 7300 put options. At current
ENGINERSIN
2270400
-9.47
211.40
7.56
juncture, 7300 put option has highest OI and this is the
OIL
1020000
-8.31
342.90
1.20
immediate support for market. Thus, we advise traders
IRB
6203400
-8.00
223.20
4.79
not to go short in this market at current levels.
ASIANPAINT
5516400
-6.95
846.90
-0.71
Historical Volatility
Put-Call Ratio
SCRIP
HV
SCRIP
PCR-OI
PCR-VOL
ADANIPORTS
47.58
NIFTY
0.81
0.73
APOLLOHOSP
34.50
BANKNIFTY
0.73
0.70
IBULHSGFIN
50.22
SBIN
0.33
0.33
AXISBANK
45.94
RELIANCE
0.47
0.45
BHARTIARTL
34.01
INFY
0.94
0.87
Strategy Date
Symbol
Strategy
Status
January 04, 2016
SBIN
Ratio Bear Put Spread
Loss booked on Jan 15, 2016
January 11, 2016
TCS
Short Strangle
Profit booked on Jan 18, 2016
January 18, 2016
HINDUNILVR
Short Strangle
Active
2
Technical & Derivatives Report
January 20, 2016
FII Statistics for 19-January 2015
Turnover on 19-January 2015
Open Interest
No. of
Turnover
Change
Detail
Buy
Sell
Net
Instrument
Value
Change
Contracts
( in Cr. )
(%)
Contracts
(in Cr.)
(%)
INDEX
INDEX
2316.31
1925.50
390.81
309777
16541.47
(0.86)
312062
16242.27
-13.39
FUTURES
FUTURES
INDEX
INDEX
33306.25
32512.46
793.79
1504074
82227.77
5.05
3824987
210998.19
-13.51
OPTIONS
OPTIONS
STOCK
4637.61
4394.54
243.06
1104396
49647.34
(0.26)
STOCK
FUTURES
578114
26640.28
-12.75
FUTURES
STOCK
STOCK
3338.03
3503.96
(165.93)
94675
4350.28
1.74
OPTIONS
414265
20437.78
-2.82
OPTIONS
TOTAL
43598.20
42336.47
1261.73
3012922
152766.87
2.32
TOTAL
5129428
274318.52
-12.71
Nifty Spot = 7435.10
Lot Size = 75
Bull-Call Spreads
Bear-Put Spreads
Action
Strike
Price
Risk
Reward
BEP
Action
Strike
Price
Risk
Reward
BEP
Buy
7500
45.10
Buy
7400
57.40
27.30
72.70
7527.30
26.75
73.25
7373.25
Sell
7600
17.80
Sell
7300
30.65
Buy
7500
45.10
Buy
7400
57.40
39.05
160.95
7539.05
41.10
158.90
7358.90
Sell
7700
6.05
Sell
7200
16.30
Buy
7600
17.80
Buy
7300
30.65
11.75
88.25
7611.75
14.35
85.65
7285.65
Sell
7700
6.05
Sell
7200
16.30
Note: Above mentioned Bullish or Bearish Spreads in Nifty (Jan. Series) are given as an information and not as a recommendation.
Nifty Put-Call Analysis
3
Technical & Derivatives Report
January 20, 2016
Daily Pivot Levels for Nifty 50 Stocks
Scrips
S2
S1
PIVOT
R1
R2
ACC
1,211
1,223
1,235
1,247
1,258
ADANIPORTS
213
223
228
238
244
AMBUJACEM
187
189
191
193
195
ASIANPAINT
804
825
847
867
889
AXISBANK
368
381
388
401
408
BAJAJ-AUTO
2,207
2,237
2,264
2,293
2,321
BANKBARODA
121
123
126
128
131
BHARTIARTL
293
302
307
316
321
BHEL
133
139
142
148
151
BOSCHLTD
17,604
17,808
17,949
18,152
18,293
BPCL
870
883
895
907
919
CAIRN
103
109
112
118
121
CIPLA
576
587
594
605
612
COALINDIA
298
303
308
313
318
DRREDDY
2,797
2,856
2,901
2,960
3,005
GAIL
332
337
343
349
355
GRASIM
3,466
3,495
3,514
3,542
3,561
HCLTECH
766
802
836
872
906
HDFC
1,121
1,137
1,147
1,163
1,173
HDFCBANK
1,022
1,029
1,033
1,040
1,044
HEROMOTOCO
2,424
2,453
2,476
2,506
2,528
HINDALCO
69
71
72
73
75
HINDUNILVR
799
805
813
819
827
ICICIBANK
222
225
228
232
235
IDEA
108
112
115
120
122
INDUSINDBK
879
888
897
905
914
INFY
1,112
1,126
1,142
1,156
1,173
ITC
309
312
315
317
320
KOTAKBANK
657
663
669
675
682
LT
1,045
1,084
1,108
1,147
1,172
LUPIN
1,677
1,688
1,707
1,718
1,736
M&M
1,118
1,135
1,151
1,168
1,184
MARUTI
4,123
4,160
4,203
4,240
4,283
NTPC
132
134
136
137
140
ONGC
208
213
216
221
224
PNB
90
91
92
94
95
POWERGRID
132
134
137
139
142
RELIANCE
1,000
1,022
1,036
1,058
1,072
SBIN
178
180
184
187
190
VEDL
65
67
69
71
73
SUNPHARMA
775
785
791
800
806
TATAMOTORS
336
345
351
360
366
TATAPOWER
61
63
64
65
67
TATASTEEL
227
233
237
242
246
TCS
2,251
2,265
2,283
2,297
2,314
TECHM
503
508
515
519
526
ULTRACEMCO
2,597
2,618
2,637
2,657
2,676
WIPRO
530
536
544
550
558
YESBANK
646
664
675
693
704
ZEEL
383
389
394
400
405
4
Technical & Derivatives Report
January 20, 2016
Research Team Tel: 022 - 39357800
For Technical Queries
For Derivatives Queries
DISCLAIMER
Angel Broking Private Limited (hereinafter referred to as “Angel”) is a registered Member of National Stock Exchange of India Limited,
Bombay Stock Exchange Limited and MCX Stock Exchange Limited. It is also registered as a Depository Participant with CDSL and
Portfolio Manager with SEBI. It also has registration with AMFI as a Mutual Fund Distributor. Angel Broking Private Limited is a
registered entity with SEBI for Research Analyst in terms of SEBI (Research Analyst) Regulations, 2014 vide registration number
INH000000164. Angel or its associates has not been debarred/ suspended by SEBI or any other regulatory authority for accessing
/dealing in securities Market. Angel or its associates including its relatives/analyst do not hold any financial interest/beneficial
ownership of more than 1% in the company covered by Analyst. Angel or its associates/analyst has not received any compensation /
managed or co-managed public offering of securities of the company covered by Analyst during the past twelve months. Angel/analyst
has not served as an officer, director or employee of company covered by Analyst and has not been engaged in market making activity
of the company covered by Analyst.
This document is solely for the personal information of the recipient, and must not be singularly used as the basis of any investment
decision. Nothing in this document should be construed as investment or financial advice. Each recipient of this document should
make such investigations as they deem necessary to arrive at an independent evaluation of an investment in the securities of the
companies referred to in this document (including the merits and risks involved), and should consult their own advisors to determine
the merits and risks of such an investment.
Reports based on technical and derivative analysis center on studying charts of a stock's price movement, outstanding positions and
trading volume, as opposed to focusing on a company's fundamentals and, as such, may not match with a report on a company's
fundamentals.
The information in this document has been printed on the basis of publicly available information, internal data and other reliable
sources believed to be true, but we do not represent that it is accurate or complete and it should not be relied on as such, as this
document is for general guidance only. Angel Broking Pvt. Limited or any of its affiliates/ group companies shall not be in any way
responsible for any loss or damage that may arise to any person from any inadvertent error in the information contained in this report.
Angel Broking Pvt. Limited has not independently verified all the information contained within this document. Accordingly, we cannot
testify, nor make any representation or warranty, express or implied, to the accuracy, contents or data contained within this document.
While Angel Broking Pvt. Limited endeavors to update on a reasonable basis the information discussed in this material, there may be
regulatory, compliance, or other reasons that prevent us from doing so.
This document is being supplied to you solely for your information, and its contents, information or data may not be reproduced,
redistributed or passed on, directly or indirectly.
Neither Angel Broking Pvt. Limited, nor its directors, employees or affiliates shall be liable for any loss or damage that may arise from
or in connection with the use of this information.
Note: Please refer to the important ‘Stock Holding Disclosure' report on the Angel website (Research Section). Also, please refer to the
latest update on respective stocks for the disclosure status in respect of those stocks. Angel Broking Pvt. Limited and its affiliates may
have investment positions in the stocks recommended in this report.
5