Technical & Derivatives Report
October 19, 2016
Sensex (28051) / Nifty (8678)
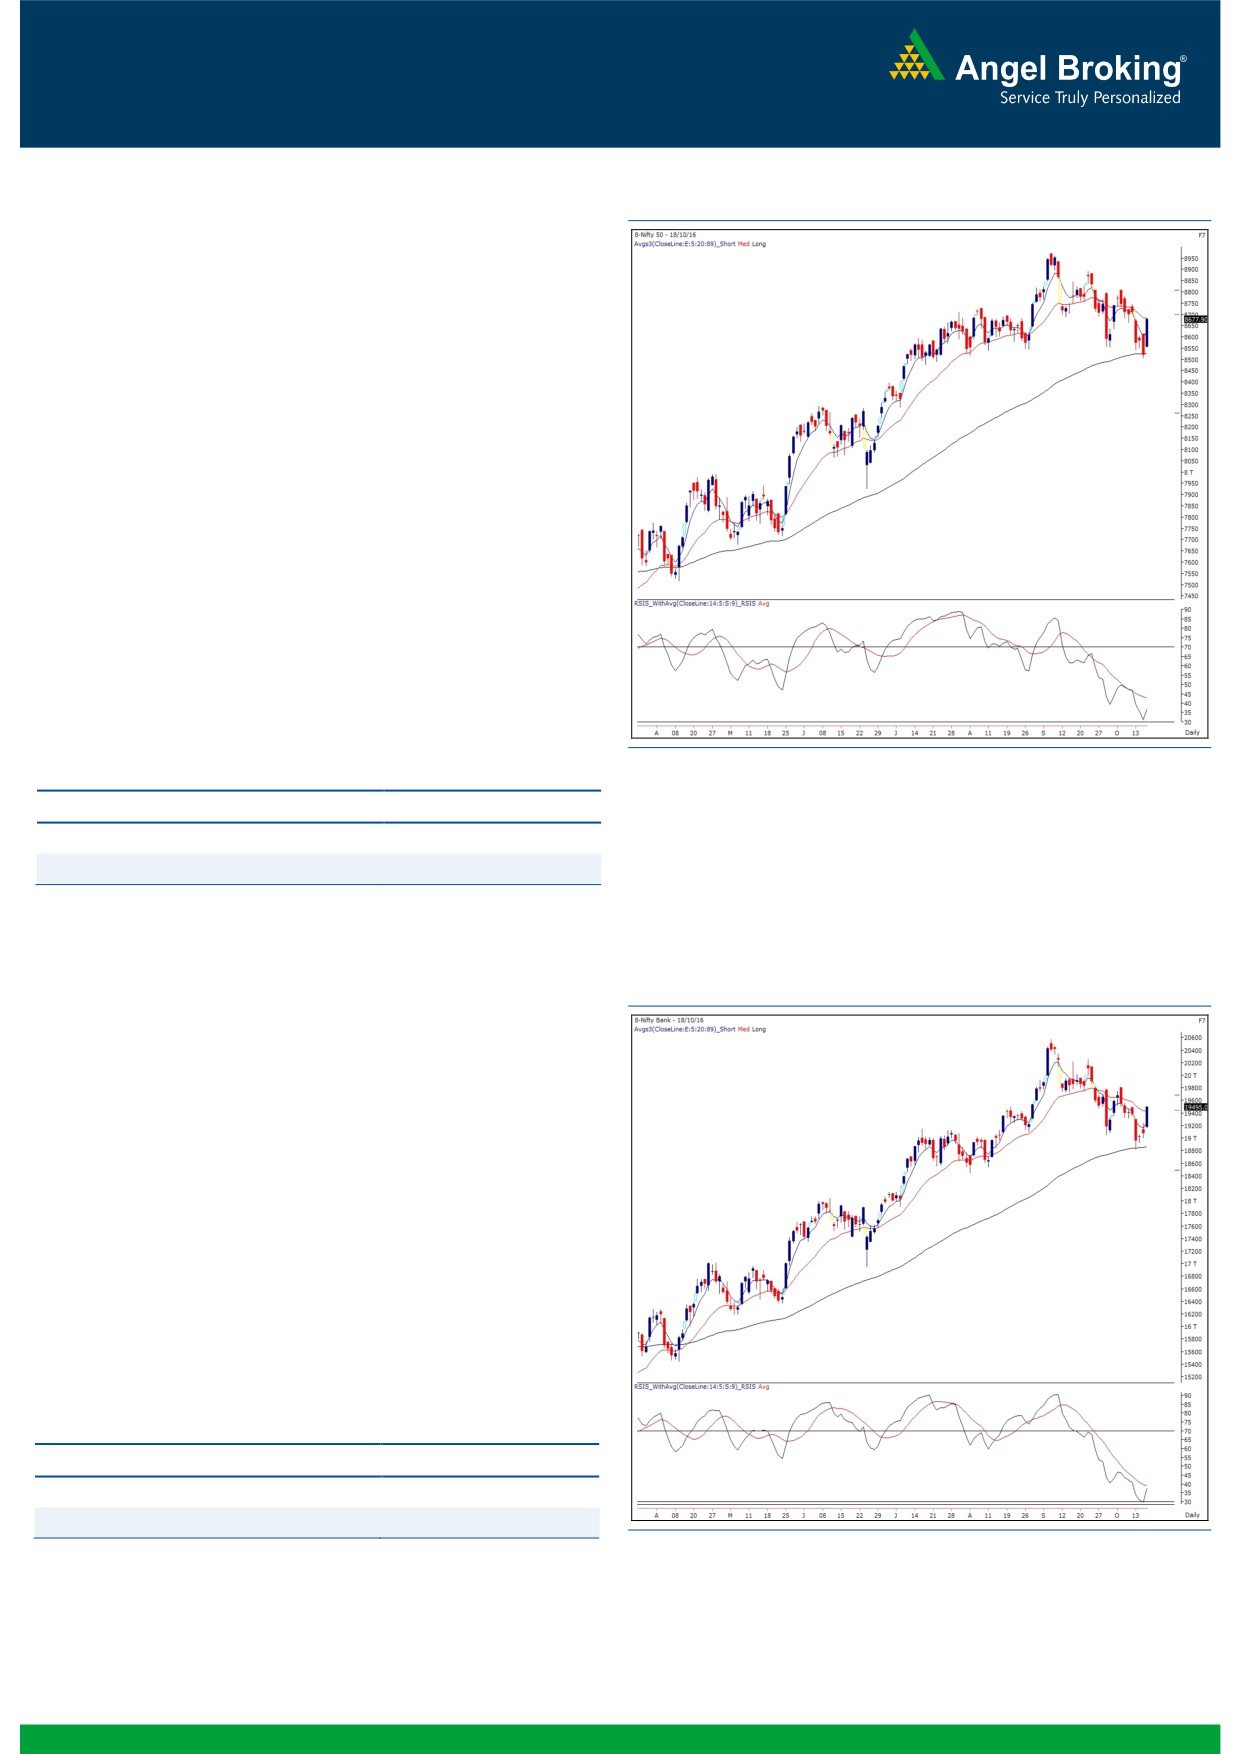
Exhibit 1: Nifty Daily Chart
Yesterday, the Nifty opened on a positive note as indicated by
SGX Nifty in opening trades. The Bulls were active from the initial
trades and kept the ball in their court throughout the session. By
closing, the index posted gains of 1.85 percent over its previous
session's close.
Yesterday's sharp upmove was a bit surprising to us as the index
posted a sharp upmove and formed a large bullish candle.
However, due to the reasons mentioned in our earlier reports, we
still believe that there is higher probability of the current upmove
being just a pullback rally which would retrace the recent fall and
then resume the corrective move. Hence, we continue to advise
traders not to participate aggressively in the pullback rally and
look for reversal signs at higher levels on the intraday charts.
Untill the index crosses the recent swing high of 8746, the 'Lower
Top Lower Bottom' structure will remain intact on hourly chart.
The intraday supports for the Nifty index are placed around 8615
and 8575 whereas resistances are seen around 8705 and 8746.
Key Levels
Support 1 - 8615
Resistance 1 - 8705
Support 2 - 8575
Resistance 2 - 8746
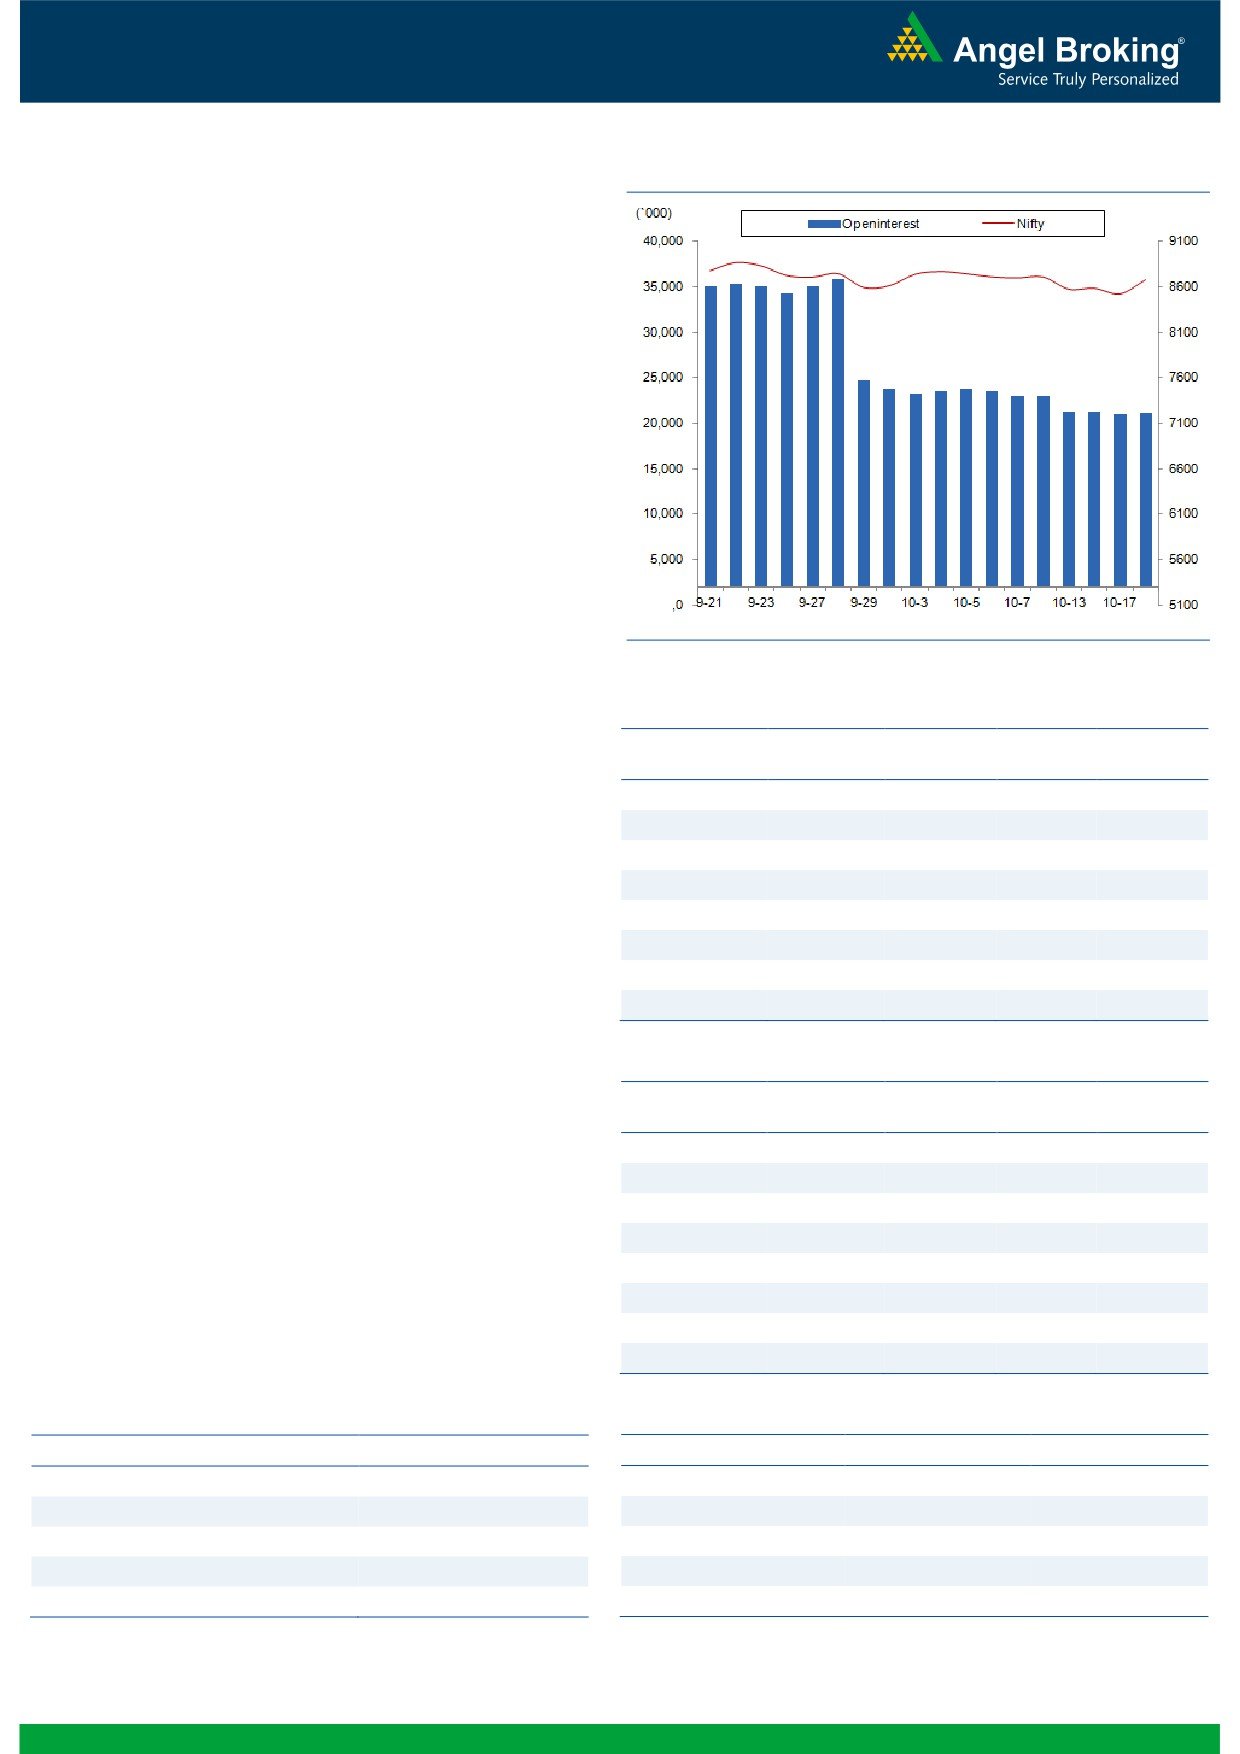
Exhibit 2: Nifty Bank Daily Chart
Nifty Bank Outlook - (19495)
The Nifty Bank index opened on a positive note and rallied higher
throughout the session to end the day with gains of 2.23 percent
over its previous session's close.
Although we have been mentioning about the probability of a
pullback rally in the index due to the cluster of supports in range
of 18795-18841, the velocity of upmove seen yesterday was
certainly not expected by us. On daily charts, the lower top lower
bottom structure is still intact and untill the same is violated, we
advise traders to wait on sidelines for further price development.
The intraday support for the Nifty Bank index are placed around
19355 and 19240 whereas resistances are seen around 19615
and 19775.
Key Levels
Support 1 - 19355
Resistance 1 - 19615
Support 2 - 19240
Resistance 2 - 19775
1
Technical & Derivatives Report
October 19, 2016
Comments
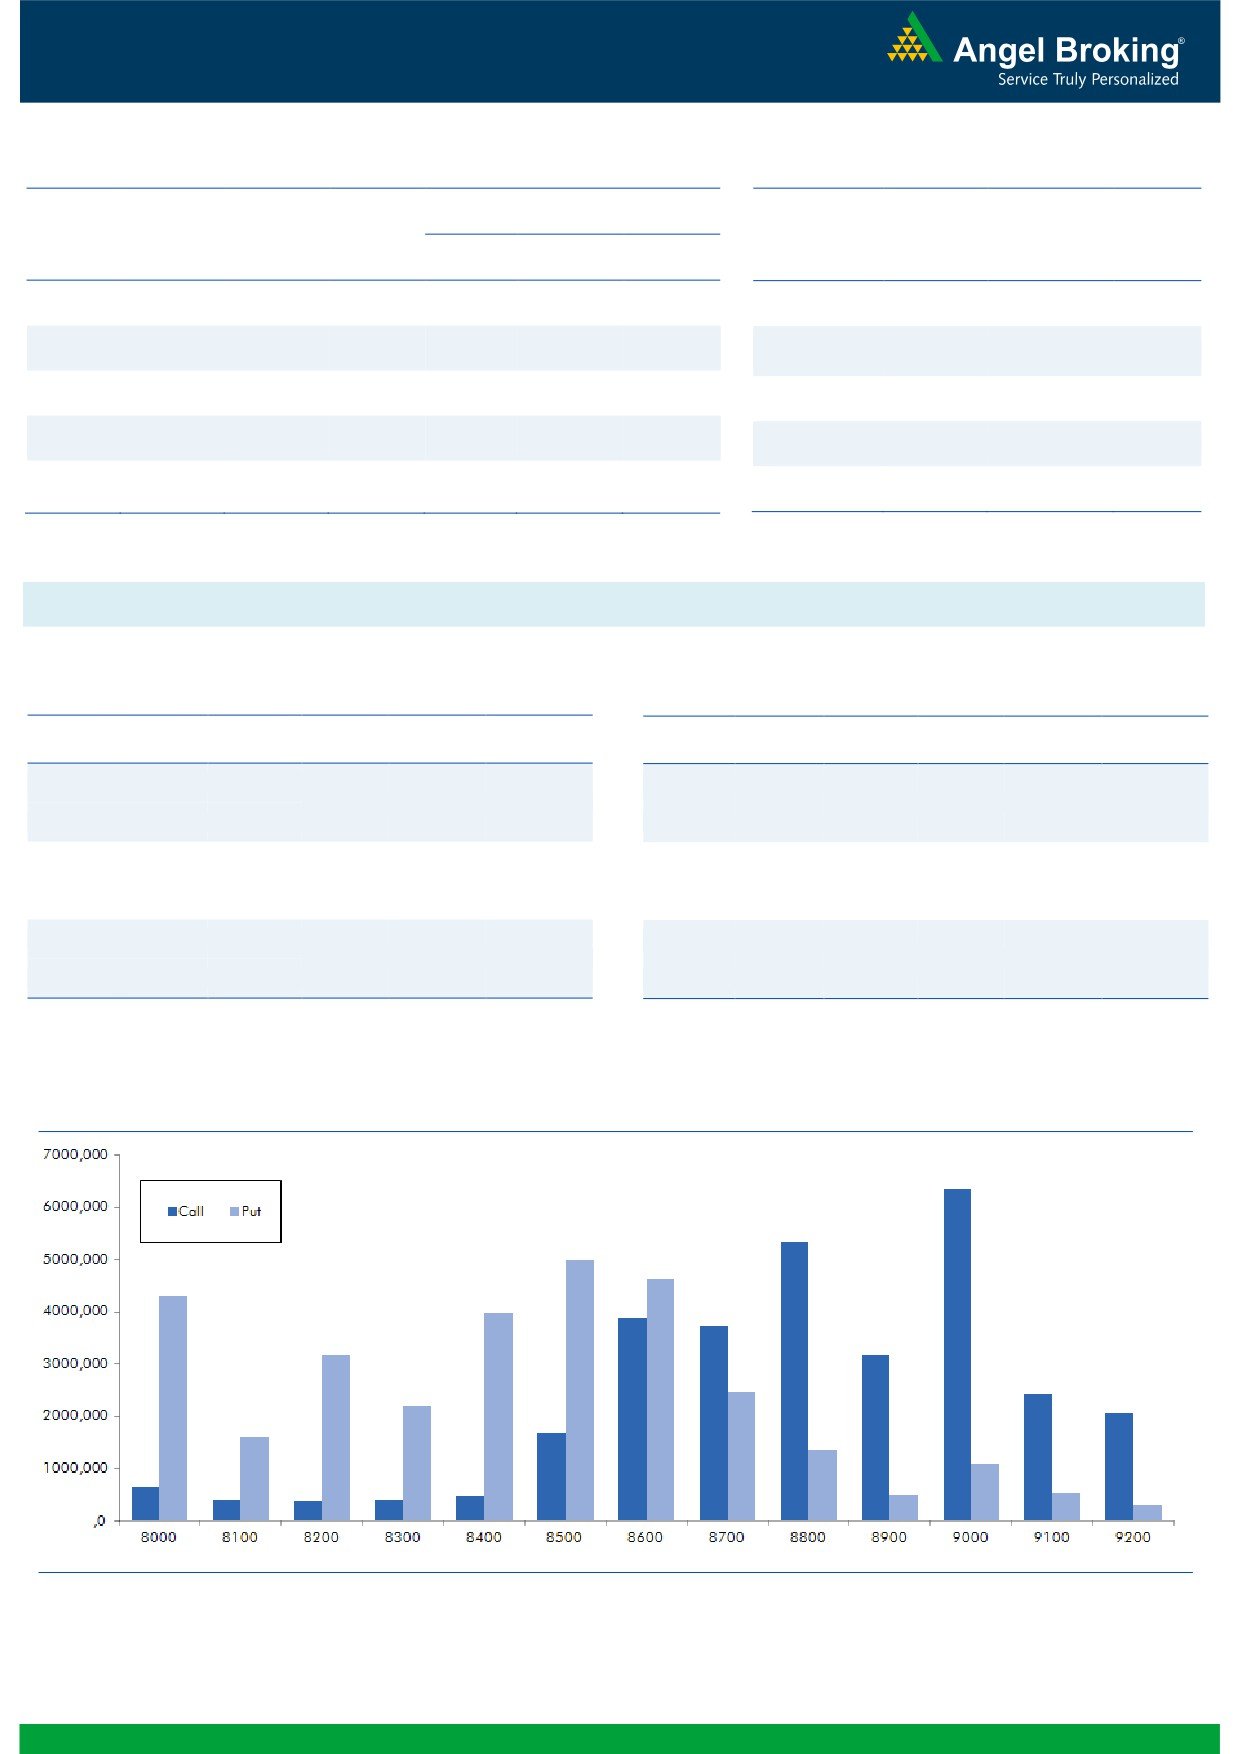
Nifty Vs OI
The Nifty futures open interest has increased by 0.40%
BankNifty futures open interest has decreased by 6.31%
as market closed at 8677.90 levels.
The Nifty October future closed with a premium of 1.95
against the premium of 3.50 points in last trading
session. The November series closed at a premium of
41.15 points.
The Implied Volatility of at the money options has
decreased from 14.78% to 12.87%. At the same time,
the PCR-OI of Nifty has increased from 0.87 to 0.96
levels.
The total OI of the market is Rs. 2,79,503/- cr. and the
stock futures OI is Rs. 80,460/- cr.
Few of the liquid counters where we have seen high cost
of carry are ANDHRABANK, IDFC, INFRATEL, PIDILITIND
and SINTEX.
Views
Yesterday, FIIs were net buyer in cash market segment to
OI Gainers
the tune of Rs. 345 crores. While, in index futures they
OI
PRICE
SCRIP
OI
PRICE
CHG. (%)
CHG. (%)
were net sellers of Rs. 730 crores with rise in open
IOC
31176000
97.19
321.95
0.34
interest, suggesting fresh short formation in last trading
HINDZINC
8361600
25.26
246.05
2.07
sessions.
HAVELLS
4398000
23.12
431.60
1.68
On Index Options front, FIIs bought of worth Rs. 3057ng.com
ARVIND
5866000
21.65
358.80
2.34
crores with marginal change in OI. In call options, we
TORNTPOWER
1686000
19.32
170.80
-0.15
hardly saw any strike price adding relevant open interest.
MINDTREE
3418400
18.56
478.30
-2.29
However, good amount of unwinding was visible in
MRF
49800
16.94
51826.65
3.75
8500-9000 call options, these is mostly covering of
shorts made earlier. While, in put options, 8600-8700
L&TFH
41805000
12.66
101.10
2.22
strikes added some positions. Maximum OI in October
series is placed at 9000 call and 8500 put options.
OI Losers
Despite, Nifty bounced more than 150 points, we saw
OI
PRICE
SCRIP
OI
PRICE
FIIs forming fresh short positions in Index Futures
CHG. (%)
CHG. (%)
DCBBANK
2367000
-6.90
127.35
0.79
yesterday and these short were formed in November
HDFC
11690500
-5.16
1355.50
3.72
series. Yesterday, we saw good amount of short covering
ORIENTBANK
14280000
-4.38
127.60
3.53
in call options by FIIs, creating uncertainty for Nifty
HINDPETRO
20913900
-4.11
439.70
0.46
closing below 8650-8700 levels. While, we witness good
amount of long formation in BankNifty call options
ALBK
16790000
-3.73
75.50
2.79
19600 and 19700. Thus, the above data indicates
TCS
4315750
-3.69
2396.95
1.65
market may show some strength in current series but the
SIEMENS
817500
-3.65
1234.30
2.06
trend remains negative for short term.
CIPLA
6901000
-3.10
593.10
1.19
Historical Volatility
Put-Call Ratio
SCRIP
HV
SCRIP
PCR-OI
PCR-VOL
DIVISLAB
29.12
NIFTY
0.96
0.99
LICHSGFIN
44.34
BANKNIFTY
1.30
0.89
TECHM
32.63
INFY
0.50
0.55
HCLTECH
25.03
ICICIBANK
0.99
0.56
HDFC
32.61
RELIANCE
0.43
0.37
2
Technical & Derivatives Report
October 19, 2016
FII Statistics for 18, October 2016
Turnover on 18, October 2016
Open Interest
No. of
Turnover
Change
Detail
Buy
Sell
Net
Instrument
Value
Change
Contracts
( in Cr. )
(%)
Contracts
(in Cr.)
(%)
INDEX
INDEX
2237.11
2966.91
(729.80)
221591
14854.53
3.27
284849
19786.08
16.42
FUTURES
FUTURES
INDEX
INDEX
45216.86
42159.37
3057.48
1101643
73613.29
0.74
5030151
353136.50
27.65
OPTIONS
OPTIONS
STOCK
7668.41
6445.04
1223.37
882800
58457.74
0.62
STOCK
FUTURES
594681
43006.26
5.62
FUTURES
STOCK
STOCK
5049.19
5001.70
47.49
111232
7491.70
5.63
OPTIONS
398015
29011.73
-0.64
OPTIONS
TOTAL
60171.58
56573.03
3598.55
2317266
154417.27
1.15
TOTAL
6307696
444940.56
22.38
Nifty Spot = 8677.90
Lot Size = 75
Bull-Call Spreads
Bear-Put Spreads
Action
Strike
Price
Risk
Reward
BEP
Action
Strike
Price
Risk
Reward
BEP
Buy
8700
59.55
Buy
8700
77.80
34.30
65.70
8734.30
38.25
61.75
8661.75
Sell
8800
25.25
Sell
8600
39.55
Buy
8700
59.55
Buy
8700
77.80
49.45
150.55
8749.45
58.20
141.80
8641.80
Sell
8900
10.10
Sell
8500
19.60
Buy
8800
25.25
Buy
8600
39.55
15.15
84.85
8815.15
19.95
80.05
8580.05
Sell
8900
10.10
Sell
8500
19.60
Note: Above mentioned Bullish or Bearish Spreads in Nifty (October Series) are given as an information and not as a recommendation.
Nifty Put-Call Analysis
3
Technical & Derivatives Report
October 19, 2016
Daily Pivot Levels for Nifty Constituents
Scrips
S2
S1
PIVOT
R1
R2
ACC
1,581
1,598
1,608
1,626
1,636
ADANIPORTS
245
256
263
273
280
AMBUJACEM
241
246
249
254
257
ASIANPAINT
1,150
1,162
1,178
1,190
1,206
AUROPHARMA
802
819
828
845
854
AXISBANK
513
523
528
538
544
BAJAJ-AUTO
2,732
2,762
2,786
2,817
2,841
BANKBARODA
150
153
154
157
159
BHEL
131
133
135
138
140
BPCL
638
647
655
665
673
BHARTIARTL
293
300
304
311
315
INFRATEL
344
350
357
362
369
BOSCH
22,026
22,256
22,410
22,639
22,793
CIPLA
578
585
590
597
601
COALINDIA
310
311
313
314
316
DRREDDY
3,007
3,026
3,040
3,059
3,073
EICHERMOT
24,476
24,773
24,996
25,293
25,517
GAIL
422
426
430
434
438
GRASIM
967
973
978
984
989
HCLTECH
803
819
828
843
852
HDFCBANK
1,231
1,245
1,252
1,266
1,273
HDFC
1,289
1,322
1,340
1,373
1,391
HEROMOTOCO
3,353
3,381
3,408
3,437
3,464
HINDALCO
148
150
152
154
156
HINDUNILVR
846
851
854
859
862
ICICIBANK
255
263
267
275
279
IDEA
70
71
73
74
75
INDUSINDBK
1,197
1,204
1,212
1,218
1,226
INFY
1,022
1,031
1,036
1,044
1,049
ITC
238
242
244
248
251
KOTAKBANK
765
771
776
782
787
LT
1,436
1,462
1,477
1,503
1,518
LUPIN
1,435
1,458
1,473
1,496
1,511
M&M
1,311
1,322
1,329
1,340
1,346
MARUTI
5,552
5,589
5,617
5,655
5,683
NTPC
146
147
148
149
150
ONGC
271
274
277
280
284
POWERGRID
174
175
176
178
179
RELIANCE
1,055
1,068
1,075
1,089
1,096
SBIN
252
255
256
258
260
SUNPHARMA
732
738
741
747
751
TCS
2,329
2,365
2,390
2,426
2,451
TATAMTRDVR
355
359
362
367
370
TATAMOTORS
546
550
553
557
560
TATAPOWER
77
78
78
79
80
TATASTEEL
407
416
421
430
436
TECHM
396
410
421
435
446
ULTRACEMCO
3,957
3,990
4,020
4,053
4,083
WIPRO
469
476
480
487
491
YESBANK
1,239
1,265
1,281
1,307
1,323
ZEEL
489
502
511
523
532
4
Technical & Derivatives Report
October 19, 2016
Research Team Tel: 022 - 39357800
For Technical Queries
For Derivatives Queries
DISCLAIMER
Angel Broking Private Limited (hereinafter referred to as “Angel”) is a registered Member of National Stock Exchange of India Limited,
Bombay Stock Exchange Limited and Metropolitan Stock Exchange Limited. It is also registered as a Depository Participant with CDSL
and Portfolio Manager with SEBI. It also has registration with AMFI as a Mutual Fund Distributor. Angel Broking Private Limited is a
registered entity with SEBI for Research Analyst in terms of SEBI (Research Analyst) Regulations, 2014 vide registration number
INH000000164. Angel or its associates has not been debarred/ suspended by SEBI or any other regulatory authority for accessing
/dealing in securities Market. Angel or its associates/analyst has not received any compensation / managed or co-managed public
offering of securities of the company covered by Analyst during the past twelve months.
This document is solely for the personal information of the recipient, and must not be singularly used as the basis of any investment
decision. Nothing in this document should be construed as investment or financial advice. Each recipient of this document should
make such investigations as they deem necessary to arrive at an independent evaluation of an investment in the securities of the
companies referred to in this document (including the merits and risks involved), and should consult their own advisors to determine
the merits and risks of such an investment.
Reports based on technical and derivative analysis center on studying charts of a stock's price movement, outstanding positions and
trading volume, as opposed to focusing on a company's fundamentals and, as such, may not match with a report on a company's
fundamentals. Investors are advised to refer the Fundamental and Technical Research Reports available on our website to evaluate the
contrary view, if any.
The information in this document has been printed on the basis of publicly available information, internal data and other reliable
sources believed to be true, but we do not represent that it is accurate or complete and it should not be relied on as such, as this
document is for general guidance only. Angel Broking Pvt. Limited or any of its affiliates/ group companies shall not be in any way
responsible for any loss or damage that may arise to any person from any inadvertent error in the information contained in this report.
Angel Broking Pvt. Limited has not independently verified all the information contained within this document. Accordingly, we cannot
testify, nor make any representation or warranty, express or implied, to the accuracy, contents or data contained within this document.
While Angel Broking Pvt. Limited endeavors to update on a reasonable basis the information discussed in this material, there may be
regulatory, compliance, or other reasons that prevent us from doing so.
This document is being supplied to you solely for your information, and its contents, information or data may not be reproduced,
redistributed or passed on, directly or indirectly.
Neither Angel Broking Pvt. Limited, nor its directors, employees or affiliates shall be liable for any loss or damage that may arise from
or in connection with the use of this information.
5