Technical & Derivatives Report
October 19, 2015
Sensex (27215) / Nifty (8238)
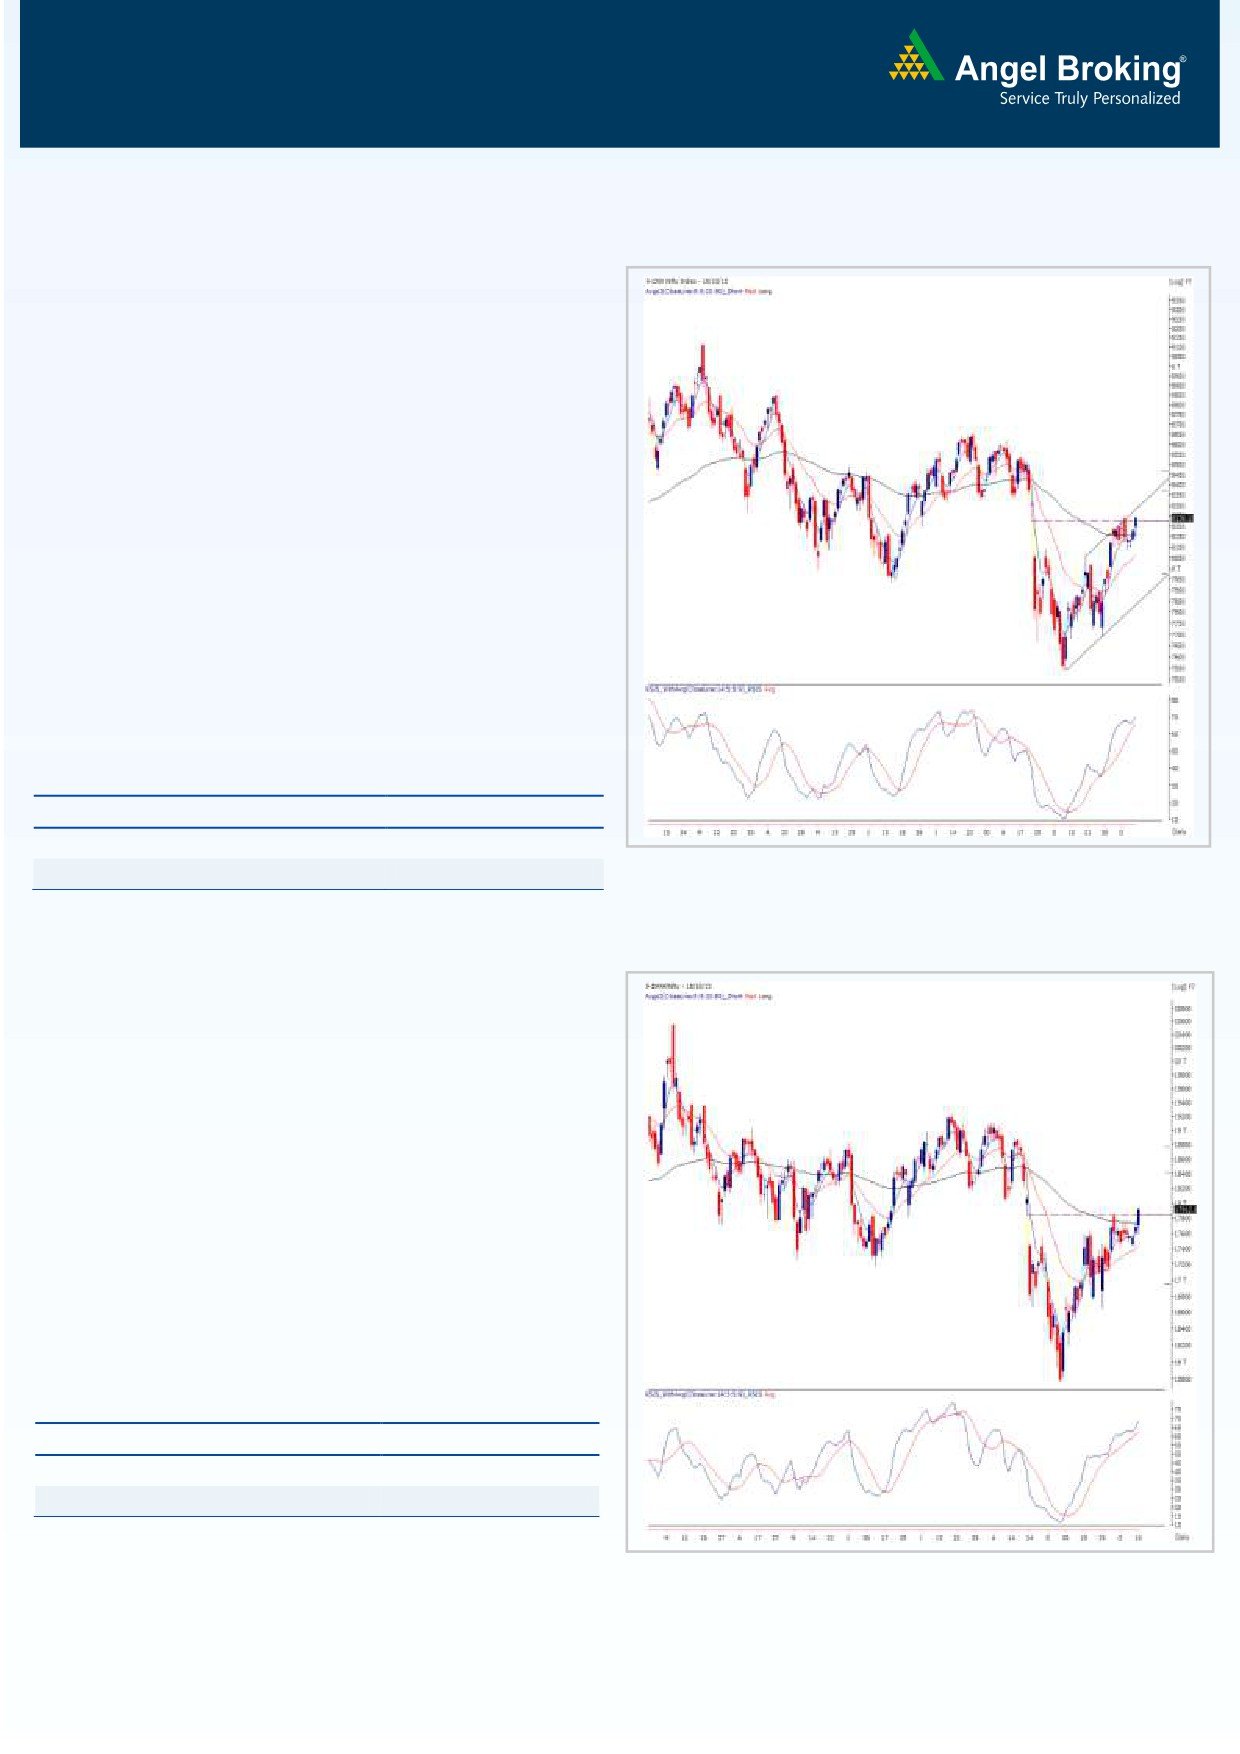
Exhibit 1: Nifty Daily Chart
For most part of the concluded week, the Nifty was largely
confined within the range of 8250 - 8050. A strong surge in the
penultimate hour of Friday's session surprised most of the
participants and the Nifty resultantly managed to close the week a
tad below the 8250 mark, which is the highest point in the last
two months.
Going forward, considering a strong weekly close, if the Nifty
manages to sustain above 8250 for an hour in today’s session
then we may witness an extension of this up move towards 8350 -
8400 levels. On the lower side, 8050 has become a major
support for the Nifty. Only a move below this support may apply
brakes on the ongoing optimism. We expect individual stocks to
perform well in the coming week as well, and we therefore
recommend traders to follow a stock specific strategy with proper
exits in place.
Key Levels
Support 1 - 8190
Resistance 1 - 8250
Support 2 - 8140
Resistance 2 - 8315
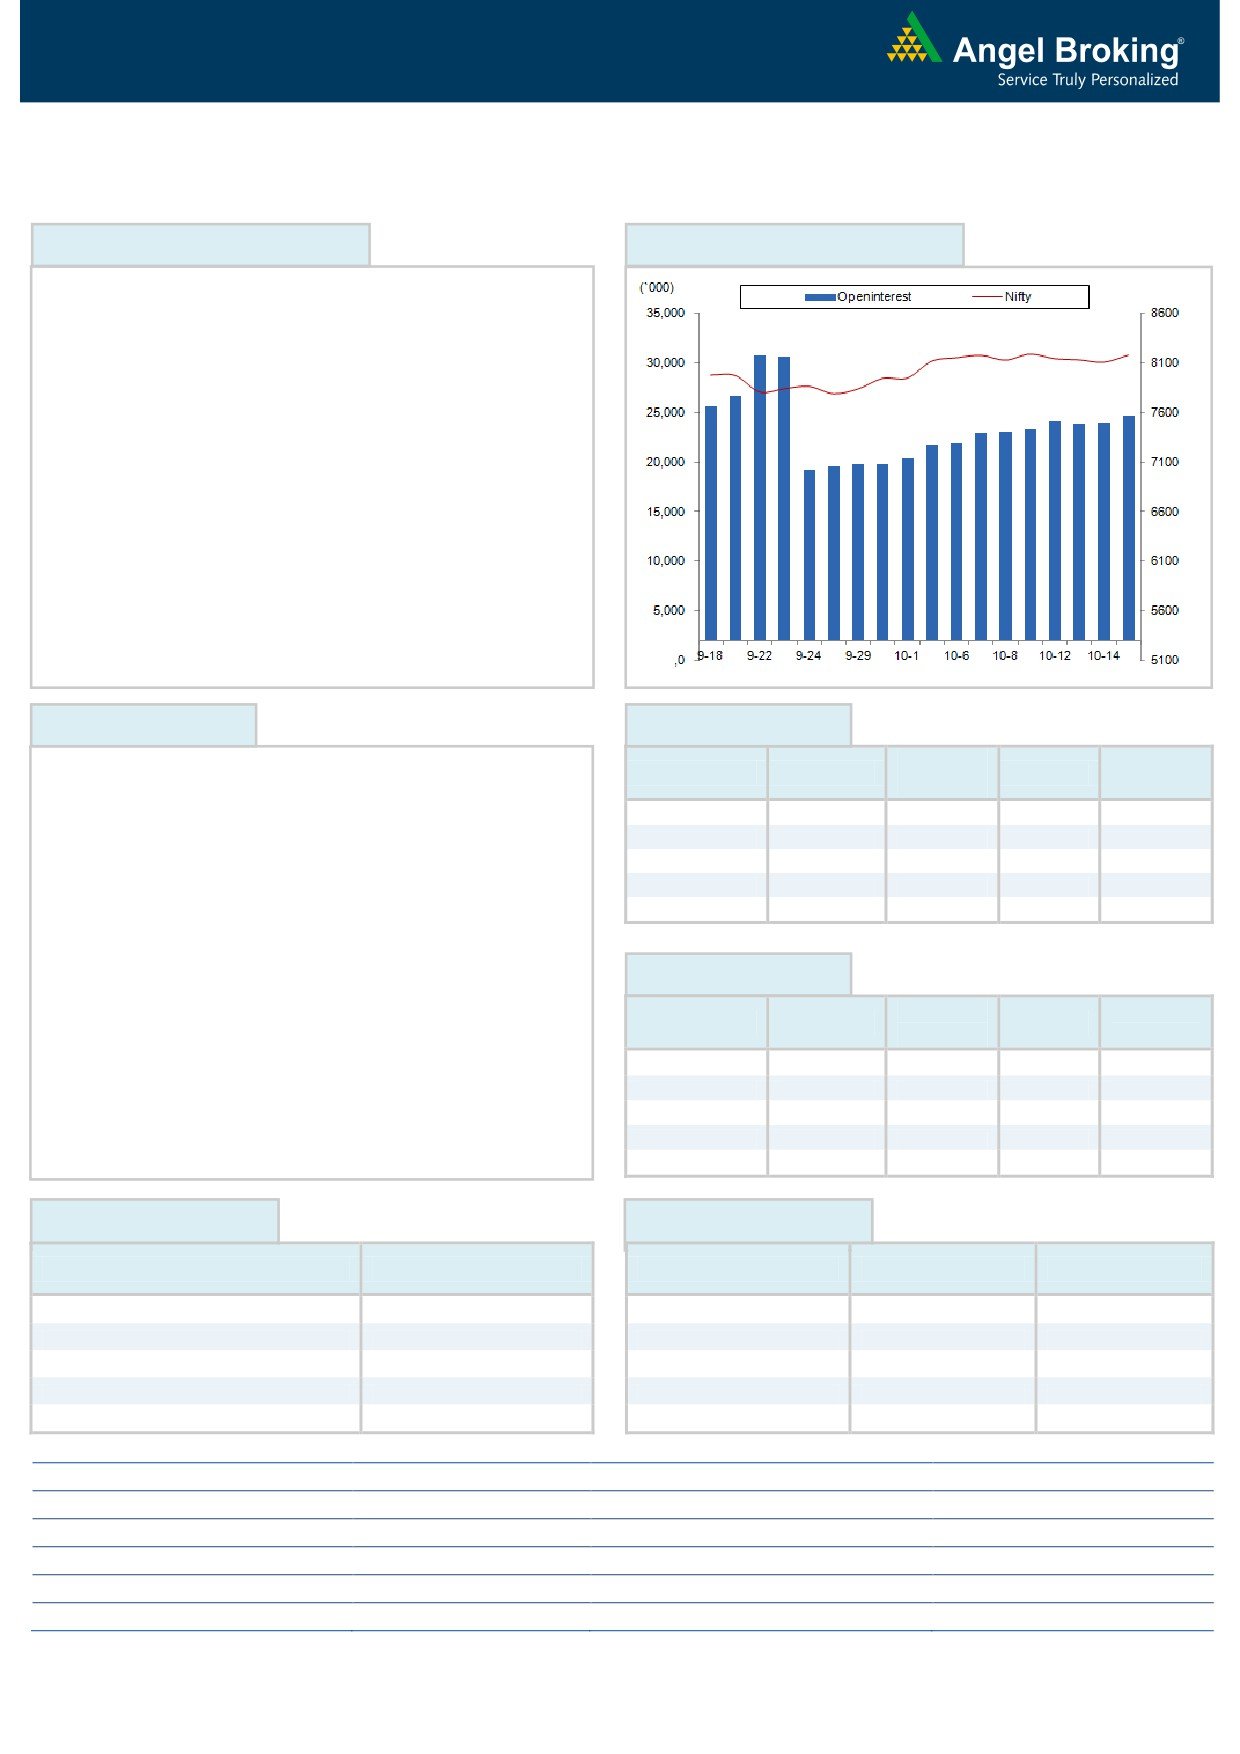
Bank Nifty Outlook - (17913)
Exhibit 2: Bank Nifty Daily Chart
The Bank Nifty opened with a marginal upside gap on Friday and
started falling in the initial hour of the trading. But, the fall
arrested around the previous day’s low and then remained in the
sideways direction throughout the remaining part of first half of
the session. However, the banking index rallied sharply in the
latter half of the session and as a result, the Bank Nifty ended
with gains of 1.28 percent. With Friday’s price action, the Bank
Nifty finally broke the silence and posted a decisive close above
its major hurdle of
17842
-
17900 levels. The positive
momentum in banking counters may continue for upcoming days
too. Going forward, the immediate resistance for the index is
placed at 18100 and 18230 levels. On the flipside, 17800 and
17650 levels will now act as support in coming trading session.
Key Levels
Support 1 - 17800
Resistance 1 - 18100
Support 2 - 17650
Resistance 2 - 18230
1
Technical & Derivatives Report
October 19, 2015
Comments
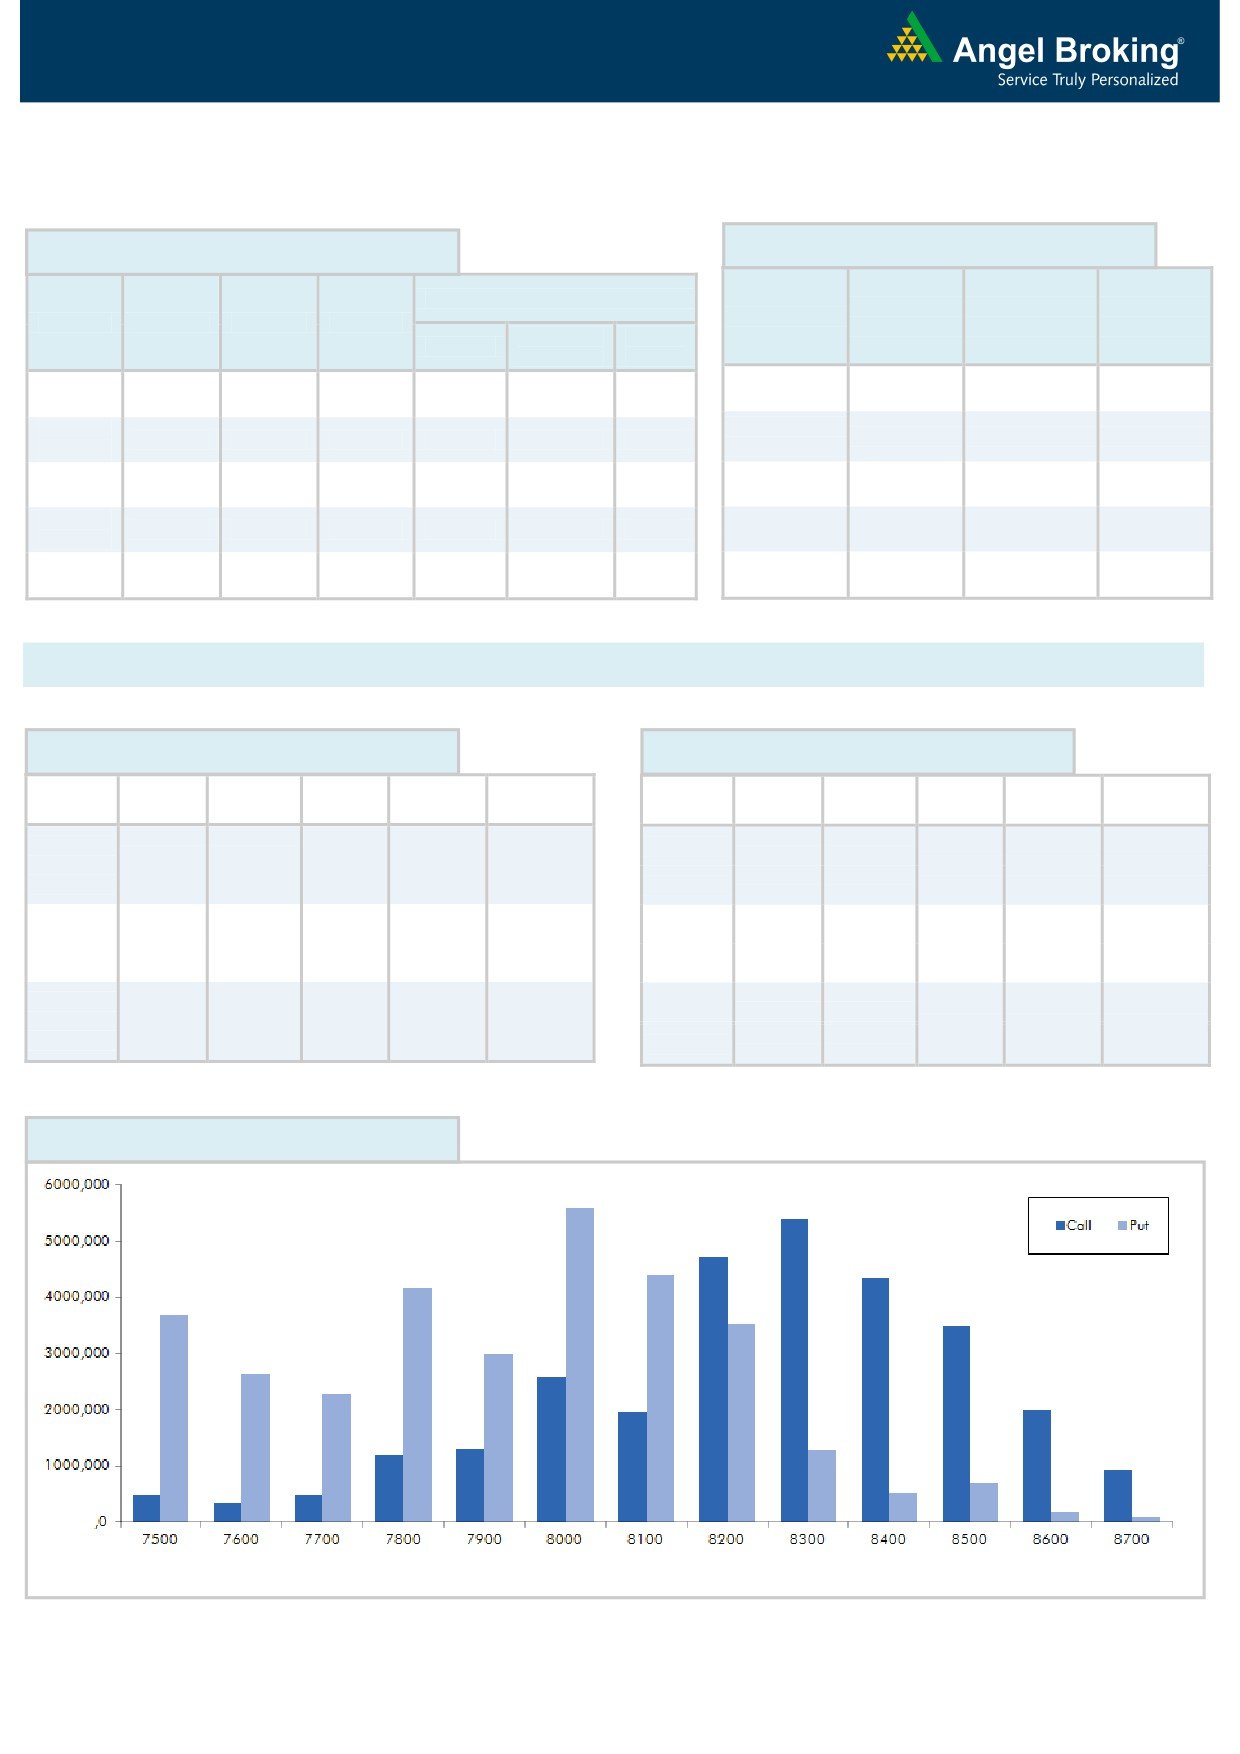
Nifty Vs OI
The Nifty futures open interest has increased by 3.25%
BankNifty futures open interest has increased by 3.16%
as market closed at 8238.15 levels.
The Nifty October future closed at a premium of 21.30
points against a premium of 7.50 points. The November
series closed at a premium of 59.95 points.
The Implied Volatility of at the money options has
decreased from 13.81% to 12.84%.
The total OI of the market is Rs. 2,31,143/- cr. and the
stock futures OI is Rs. 61,651/- cr.
Few of the liquid counters where we have seen high cost
of carry are AMTEKAUTO, UNITECH, IDFC, IOC and
AMBUJACEM.
Views
OI Gainers
OI
PRICE
FIIs bought in equity segment to the tune of Rs. 437
SCRIP
OI
PRICE
CHG. (%)
CHG. (%)
crores. While in Index Futures they sold of Rs. 831 crores
MINDTREE
675150
28.72
1425.75
1.67
with marginal change in OI, suggesting mix of long
IOC
9000800
13.42
407.75
0.73
unwinding and short formation in last trading session.
TV18BRDCST
19176000
12.35
32.90
-0.15
BEML
212000
12.17
1229.95
0.13
In Index Options front, they bought of Rs. 217 crores
NCC
5440000
12.03
81.85
0.55
with good amount of rise in OI. In call options, we saw
meaningful build-up in
8300-8400 call options,
OI Losers
followed by unwinding in 8100 & 8200 call options.
OI
PRICE
While in put options, good amount of OI addition was
SCRIP
OI
PRICE
CHG. (%)
CHG. (%)
seen in 8100-8300 strikes, some unwinding was also
ZEEL
8835800
-6.31
423.60
1.10
visible in 8000 put strike. Maximum OI is seen in 8300
MARUTI
2710500
-5.10
4452.35
1.56
call and 8000 put options. From last 2-3 trading
SYNDIBANK
7562000
-4.76
94.70
0.37
session, FIIs are forming fresh shorts, avoid going long.
AMARAJABAT
714600
-3.93
1000.25
0.31
GODREJIND
2635400
-3.34
359.20
0.27
Historical Volatility
Put-Call Ratio
SCRIP
HV
SCRIP
PCR-OI
PCR-VOL
CROMPGREAV
48.68
NIFTY
1.02
0.98
NMDC
45.85
BANKNIFTY
0.98
0.75
SRTRANSFIN
44.89
INFY
0.30
0.28
LT
34.60
TATAMOTORS
1.28
0.81
BIOCON
30.28
RELIANCE
0.94
0.73
Strategy Date
Symbol
Strategy
Status
September 28, 2015
NIFTY
Long Strangle
Profit booked on October 16, 2015
October 05, 2015
SBIN
Ratio Bear Put Spread
Active
October 12, 2015
LT
Long Put Ladder
Active
2
Technical & Derivatives Report
October 19, 2015
Turnover on 16-October 2015
FII Statistics for 16-October 2015
Open Interest
No. of
Turnover
Change
Instrument
Detail
Buy
Sell
Net
Contracts
( in Cr. )
(%)
Value
Change
Contracts
(in Cr.)
(%)
INDEX
INDEX
615813
16939.91
16.53
1122.81
1954.26
(831.44)
990835
24881.67
(0.23)
FUTURES
FUTURES
INDEX
INDEX
11422.64
11205.17
217.48
2332985
74049.18
4.71
6839723
158270.01
20.67
OPTIONS
OPTIONS
STOCK
STOCK
2518.07
2975.68
(457.60)
1804826
48744.39
0.09
861121
23554.52
4.99
FUTURES
FUTURES
STOCK
STOCK
2024.22
2046.58
(22.37)
129743
3539.59
(1.77)
528553
14033.34
5.14
OPTIONS
OPTIONS
TOTAL
17087.75
18181.68
(1093.94)
5258389
151214.83
1.98
TOTAL
8845210
212797.78
17.26
Nifty Spot = 8238.15
Lot Size = 25
Bull-Call Spreads
Bear-Put Spreads
Action
Strike
Price
Risk
Reward
BEP
Action
Strike
Price
Risk
Reward
BEP
Buy
Buy
8300
61.45
8200
57.10
35.10
24.25
75.75
8175.75
Sell
Sell
8400
26.35
8100
32.85
Buy
Buy
8300
61.45
8200
57.10
52.05
147.95
8352.05
37.65
162.35
8162.35
Sell
Sell
8500
9.40
8000
19.45
Buy
Buy
8400
26.35
8100
32.85
16.95
83.05
8416.95
13.40
86.60
8086.60
Sell
Sell
8500
9.40
8000
19.45
Nifty Put-Call Analysis
3
Technical & Derivatives Report
October 19, 2015
Daily Pivot Levels for Nifty 50 Stocks
Scrips
S2
S1
PIVOT
R1
R2
ACC
1,394
1,352
1,373
1,386
1,407
AMBUJACEM
212
207
209
212
215
ASIANPAINT
883
858
870
878
890
AXISBANK
505
485
495
501
511
BAJAJ-AUTO
2,462
2,410
2,436
2,462
2,487
BANKBARODA
178
173
175
178
180
BHARTIARTL
350
336
343
348
354
BHEL
214
208
211
212
215
BOSCHLTD
21,068
20,756
20,912
21,096
21,251
BPCL
911
892
902
908
918
CAIRN
160
155
158
160
162
CIPLA
679
665
672
676
684
COALINDIA
339
331
335
339
343
DRREDDY
4,265
4,116
4,190
4,235
4,310
GAIL
325
319
322
324
327
GRASIM
3,649
3,593
3,621
3,643
3,671
HCLTECH
841
830
836
841
846
HDFC
1,312
1,271
1,292
1,304
1,324
HDFCBANK
1,100
1,079
1,090
1,096
1,106
HEROMOTOCO
2,584
2,546
2,565
2,578
2,596
HINDALCO
88
84
86
88
89
HINDUNILVR
785
777
781
786
790
ICICIBANK
284
288
294
IDEA
150
145
148
150
153
INDUSINDBK
963
944
953
960
969
INFY
1,095
1,084
1,089
1,095
1,101
ITC
349
341
345
347
351
KOTAKBANK
659
639
649
655
666
LT
1,605
1,532
1,569
1,589
1,625
LUPIN
2,055
2,000
2,028
2,063
2,090
M&M
1,289
1,257
1,273
1,284
1,300
MARUTI
4,450
4,351
4,401
4,431
4,480
NMDC
105
98
101
103
107
NTPC
127
124
125
127
128
ONGC
264
254
259
262
267
PNB
138
134
136
138
140
POWERGRID
135
132
134
135
136
RELIANCE
912
899
906
910
917
SBIN
255
245
250
253
259
VEDL
109
105
107
109
111
SUNPHARMA
889
876
883
887
894
TATAMOTORS
386
376
381
386
391
TATAPOWER
70
61
66
68
72
TATASTEEL
253
244
249
253
257
TCS
2,474
2,457
2,465
2,479
2,487
TECHM
546
539
542
547
550
ULTRACEMCO
2,955
2,871
2,913
2,944
2,986
WIPRO
577
558
568
575
584
YESBANK
773
744
759
767
781
ZEEL
423
409
416
421
429
4
Technical & Derivatives Report
October 19, 2015
Research Team Tel: 022 - 39357800
For Technical Queries
For Derivatives Queries
DISCLAIMER
Angel Broking Private Limited (hereinafter referred to as “Angel”) is a registered Member of National Stock Exchange of India Limited,
Bombay Stock Exchange Limited and MCX Stock Exchange Limited. It is also registered as a Depository Participant with CDSL and
Portfolio Manager with SEBI. It also has registration with AMFI as a Mutual Fund Distributor. Angel Broking Private Limited is a
registered entity with SEBI for Research Analyst in terms of SEBI (Research Analyst) Regulations, 2014 vide registration number
INH000000164. Angel or its associates has not been debarred/ suspended by SEBI or any other regulatory authority for accessing
/dealing in securities Market. Angel or its associates including its relatives/analyst do not hold any financial interest/beneficial
ownership of more than 1% in the company covered by Analyst. Angel or its associates/analyst has not received any compensation /
managed or co-managed public offering of securities of the company covered by Analyst during the past twelve months. Angel/analyst
has not served as an officer, director or employee of company covered by Analyst and has not been engaged in market making activity
of the company covered by Analyst.
This document is solely for the personal information of the recipient, and must not be singularly used as the basis of any investment
decision. Nothing in this document should be construed as investment or financial advice. Each recipient of this document should
make such investigations as they deem necessary to arrive at an independent evaluation of an investment in the securities of the
companies referred to in this document (including the merits and risks involved), and should consult their own advisors to determine
the merits and risks of such an investment.
Reports based on technical and derivative analysis center on studying charts of a stock's price movement, outstanding positions and
trading volume, as opposed to focusing on a company's fundamentals and, as such, may not match with a report on a company's
fundamentals.
The information in this document has been printed on the basis of publicly available information, internal data and other reliable
sources believed to be true, but we do not represent that it is accurate or complete and it should not be relied on as such, as this
document is for general guidance only. Angel Broking Pvt. Limited or any of its affiliates/ group companies shall not be in any way
responsible for any loss or damage that may arise to any person from any inadvertent error in the information contained in this report.
Angel Broking Pvt. Limited has not independently verified all the information contained within this document. Accordingly, we cannot
testify, nor make any representation or warranty, express or implied, to the accuracy, contents or data contained within this document.
While Angel Broking Pvt. Limited endeavors to update on a reasonable basis the information discussed in this material, there may be
regulatory, compliance, or other reasons that prevent us from doing so.
This document is being supplied to you solely for your information, and its contents, information or data may not be reproduced,
redistributed or passed on, directly or indirectly.
Neither Angel Broking Pvt. Limited, nor its directors, employees or affiliates shall be liable for any loss or damage that may arise from
or in connection with the use of this information.
Note: Please refer to the important ‘Stock Holding Disclosure' report on the Angel website (Research Section). Also, please refer to the
latest update on respective stocks for the disclosure status in respect of those stocks. Angel Broking Pvt. Limited and its affiliates may
5