Technical & Derivatives Report
September 19, 2016
Sensex (28599) / Nifty (8780)
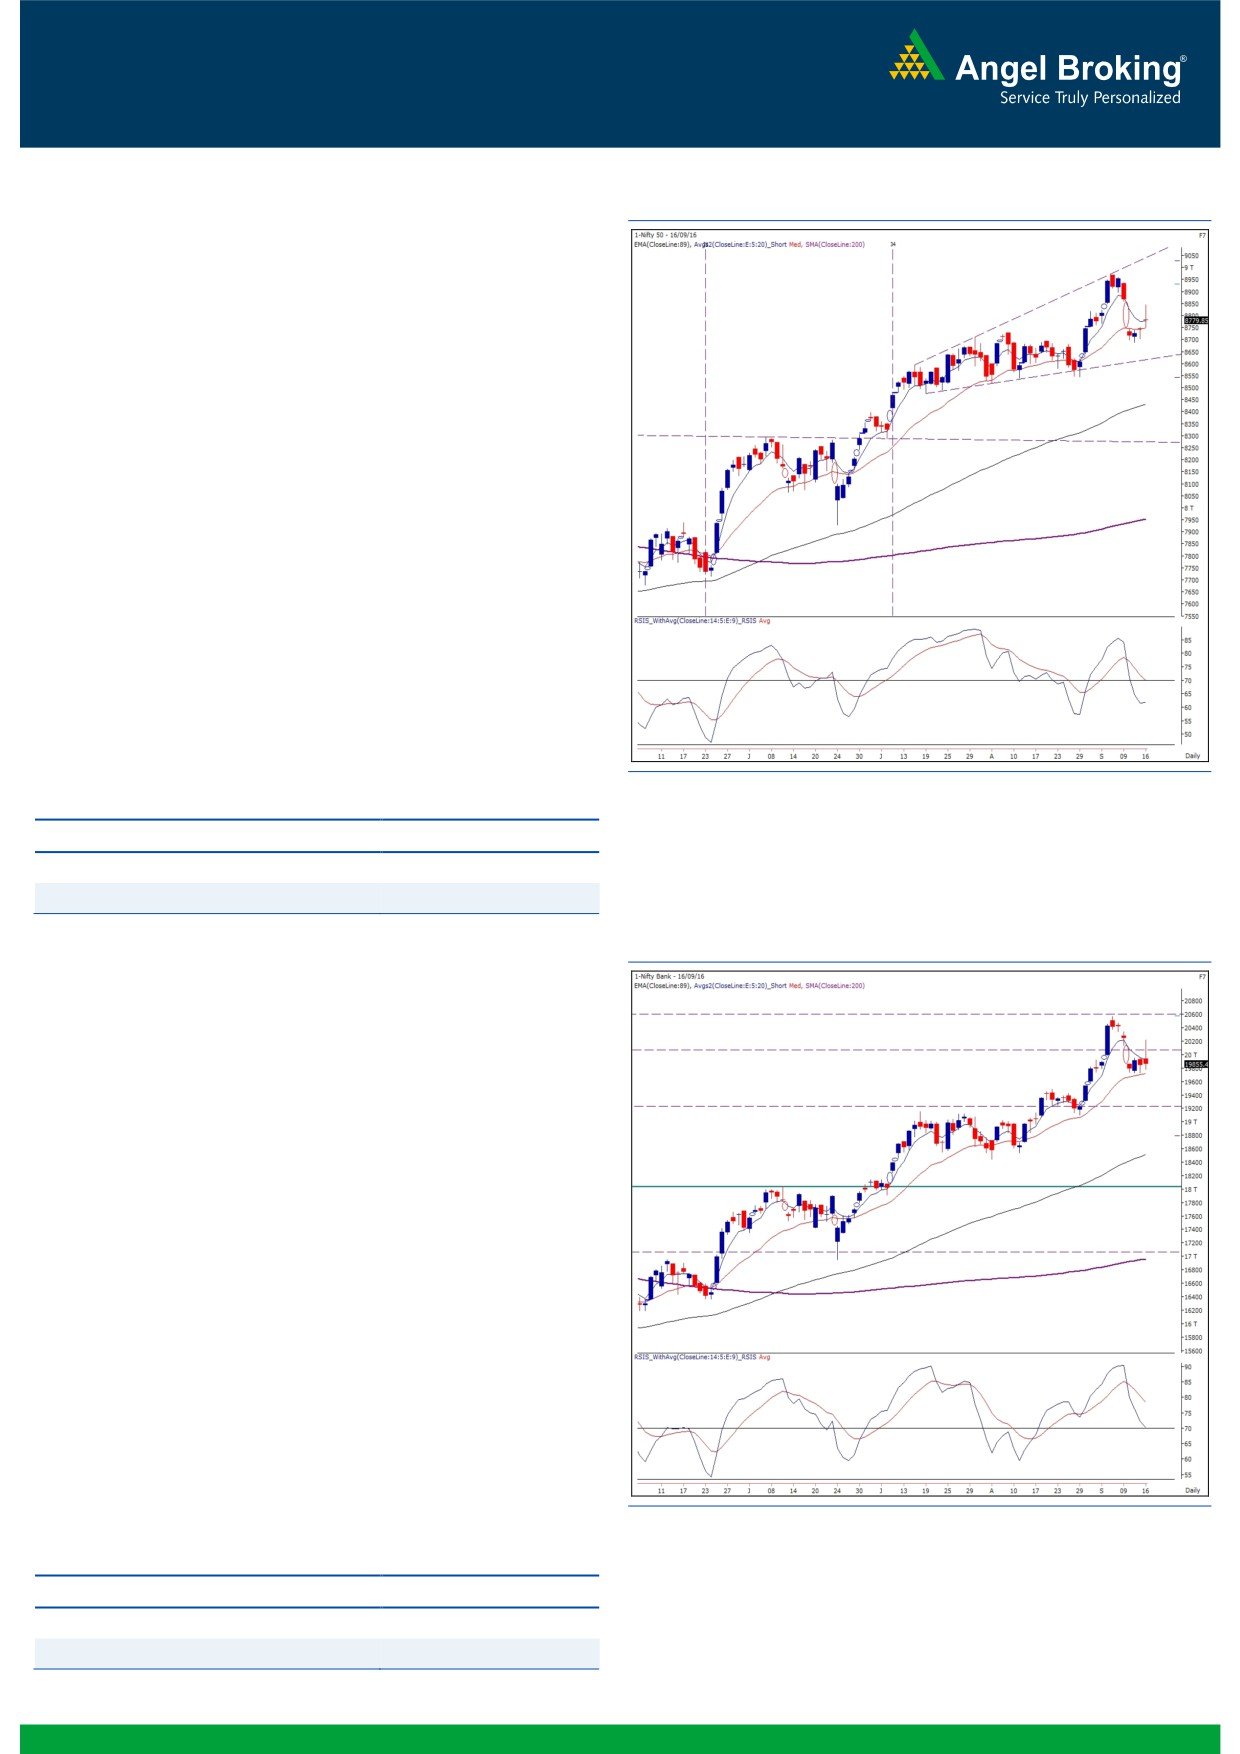
Exhibit 1: Nifty Daily Chart
On Friday’s trading session, the Nifty gave a gap up opening and
rallied higher in first couple of hours; however, the bears showed
their dominance in the latter half of the day to end the session
near its opening point.
It was a profit taking week for the active participants who have
been riding this northward rally from last few months. The price
development of last week confirms an ‘Island Reversal’ pattern on
weekly charts. Although, with a very small margin, the impact of
overall structure (i.e. previous week’s ‘Shooting Star’) around the
strong resistance of 9000 does not bode well for the bulls. Thus,
as long as the high of 8968.70 remains unbroken, the Nifty is
now likely to remain a bit under pressure in the near term before
beginning the next upward rally beyond 9000. On the downside,
the Nifty may immediately slide towards 8688-8543 levels. In the
forthcoming week, we may see market trading with enhanced
volatility on account of major global events. Thus, traders are
advised to stay light on positions, follow strict stop losses and
avoid taking undue risks.
Key Levels
Support 1 - 8688
Resistance 1 - 8850
Support 2 - 8642
Resistance 2 - 8968
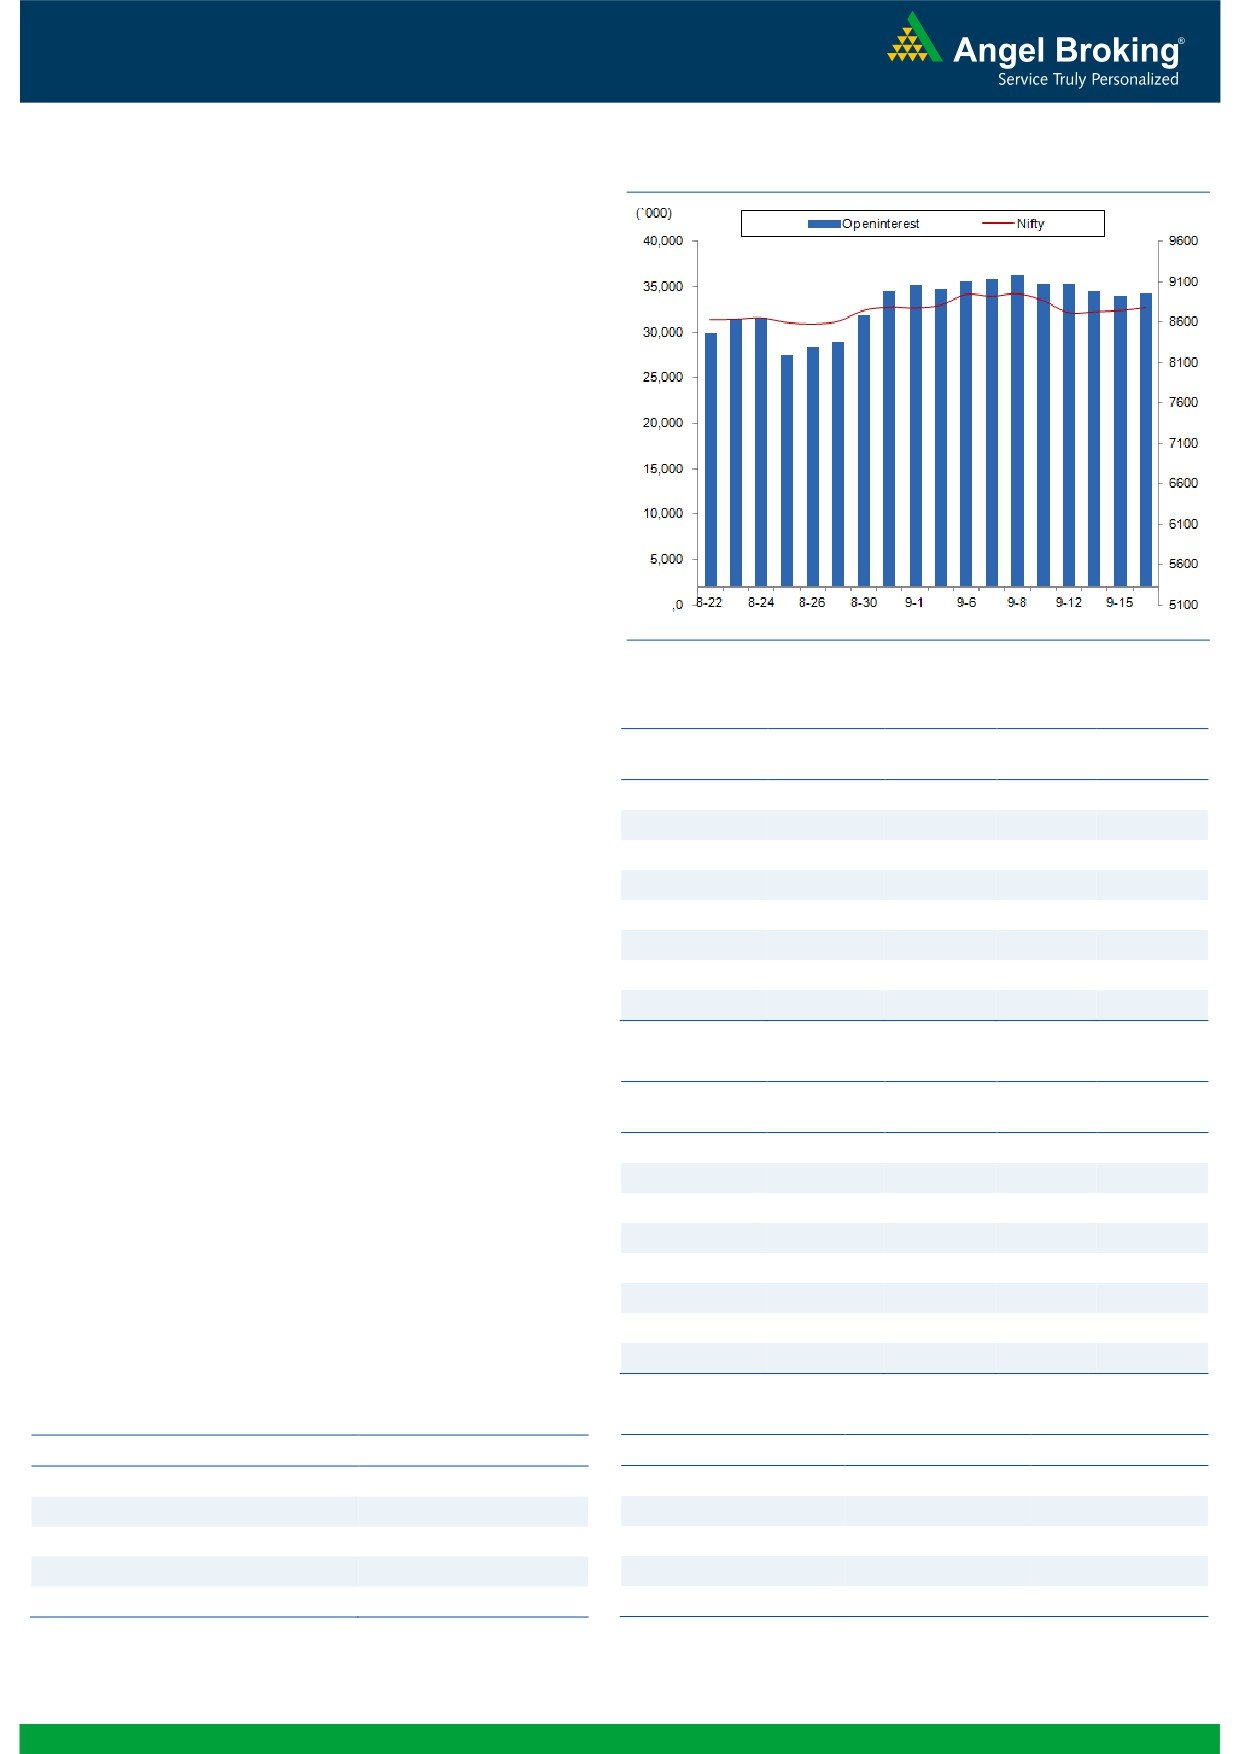
Exhibit 2: Nifty Bank Daily Chart
Nifty Bank Outlook - (19855)
Post flat opening, the Nifty Bank index rallied higher during initial
couple of hours on Friday. The index filled the Monday's gap
completely during the day.However, owing to the selling pressure
on the index heavyweight stocks in last couple of hours, the index
retraced lower and ended the session almost flat.
Even post a positive momentum in the index during first half on
Monday; the Nifty Bank index saw some selling pressure at the
end. Lack of follow up buying and the formation of bearish
pattern in some of the index heavyweights indicate higher
probability of another leg of corrective move in near term. Post
gap down opening on Monday, the Nifty Bank index has taken
support above the '20DEMA' which is placed around 19715.
Hence, in near term, 19715 would be crucial level to watch as
breach of the same could lead to increasing bearish momentum
in the index and stocks. With short term perspective, traders are
advised to trade cautiously and trade with negative bias. The
intraday support for the index are placed around 19715 and
19495 whereas resistances are seen around 19960 and 20220.
Key Levels
Support 1 - 19715
Resistance 1 - 19960
Support 2 - 19495
Resistance 2 - 20220
1
Technical & Derivatives Report
September 19, 2016
Comments
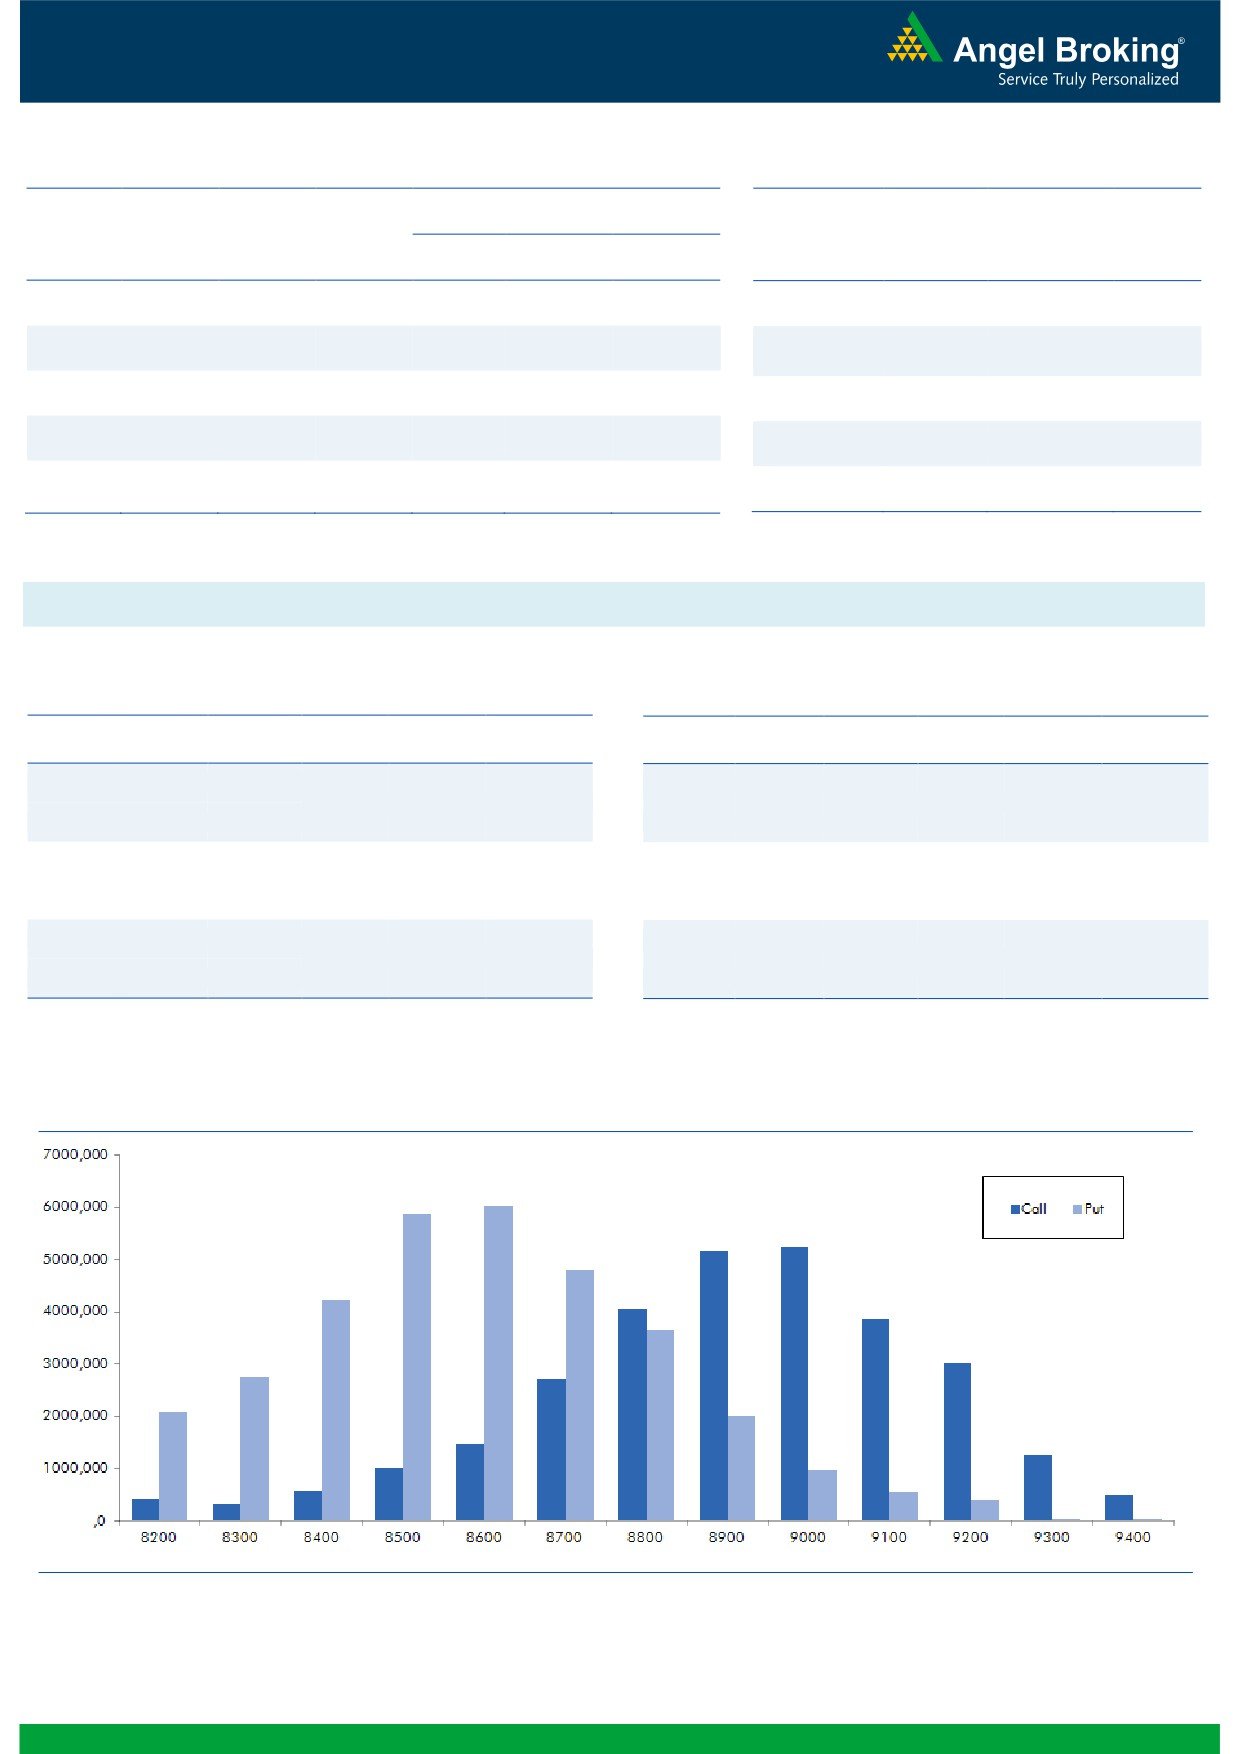
Nifty Vs OI
The Nifty futures open interest has increased by 0.55%
BankNifty futures open interest has decreased by 1.17%
as market closed at 8779.85 levels.
The Nifty September future closed with a premium of
28.35 points against a premium of 30.95 points in
previous session. The October series closed at a
premium of 66.80 points.
The Implied Volatility of at the money options has
decreased from 13.24% to 12.55%. At the same time,
the PCR-OI of Nifty has increased from 1.07 to 1.10.
The total OI of the market is Rs. 2,98,720/- cr. and the
stock futures OI is Rs. 85,072/- cr.
Few of the liquid counters where we have seen high cost
of carry are GMRINFRA, IBREALEST, SAIL, PTC and
JSWENERGY.
Views
FIIs were net buyers in both cash market segment and
OI Gainers
Index Futures. They bought equities to the tune of Rs. 661
OI
PRICE
SCRIP
OI
PRICE
crores. While, they were net buyers in index future of Rs.
CHG. (%)
CHG. (%)
427 crores with some rise in OI, indicating blend of short
TVSMOTOR
6174000
20.35
339.25
5.26
covering and some long formation in last trading
WOCKPHARMA
4556400
18.08
910.20
8.10
session.
UBL
1060500
14.77
832.30
1.12
www.angelbroking.com
On Index Options front, FIIs bought of Rs. 779 crores
HAVELLS
3692000
13.53
411.35
-0.18
with rise in OI. Yesterday, in call options we hardly saw
DHFL
14286000
11.99
282.40
-1.31
any meaningful OI addition. Some unwinding was visible
ADANIENT
21040000
11.02
69.50
-2.73
in 9000 call options. While in put options, 8800 strikes
ARVIND
6170000
10.18
332.90
5.05
added decent amount of positions and we believe these
TORNTPHARM
396800
9.25
1599.60
-2.23
are long formation. Highest OI in September series is
placed at 9000 call and 8600 put option.
OI Losers
We witness FIIs booking profits and formation of fresh
OI
PRICE
shorts in Index Futures last week. Seeing the continous
SCRIP
OI
PRICE
CHG. (%)
CHG. (%)
selling figure in Index Futures, we believe Nifty may
SUNTV
8630000
-12.28
496.85
-2.50
remain under pressure. Thus, traders should avoid
OIL
1511300
-9.84
401.10
2.64
holding longs as we expect Nifty to test 8600-8650 levels
RELINFRA
12382500
-8.26
591.35
1.27
in near term.
RECLTD
21900000
-8.25
232.70
1.00
Large cap counters that added long positions yesterday
CROMPGREAV
17436000
-7.57
81.15
0.87
are BPCL, EICHERMOT, HDFCBANK and INFY. While,
CEATLTD
1979600
-6.70
1065.70
0.10
counters like YESBANK, TATAMOTORS, TATASTEEL and
NCC
28976000
-6.24
87.75
1.45
ASIANPAINTadded short positions.
PFC
26754000
-6.09
118.95
-0.42
Historical Volatility
Put-Call Ratio
SCRIP
HV
SCRIP
PCR-OI
PCR-VOL
WOCKPHARMA
63.60
NIFTY
1.10
1.02
TVSMOTOR
42.10
BANKNIFTY
1.22
0.98
ARVIND
41.57
YESBANK
0.49
0.67
OIL
24.58
RELIANCE
0.71
0.51
SINTEX
45.32
ICICIBANK
0.48
0.40
2
Technical & Derivatives Report
September 19, 2016
FII Statistics for 16, September 2016
Turnover on 16, September 2016
Open Interest
No. of
Turnover
Change
Detail
Buy
Sell
Net
Instrument
Value
Contracts
( in Cr. )
(%)
Contracts
Change (%)
(in Cr.)
INDEX
INDEX
2858.16
2431.27
426.89
462577
31142.18
0.75
315368
22599.40
70.43
FUTURES
FUTURES
INDEX
INDEX
55735.65
54956.33
779.31
1273747
86139.72
1.41
4435212
319372.44
-25.50
OPTIONS
OPTIONS
STOCK
9175.56
9697.57
(522.01)
924996
61464.71
1.51
STOCK
FUTURES
765256
54449.50
49.30
FUTURES
STOCK
STOCK
7873.45
7864.54
8.91
119769
8266.21
4.55
OPTIONS
518071
37455.86
62.96
OPTIONS
TOTAL
75642.81
74949.70
693.11
2781089
187012.82
1.46
TOTAL
6033907
433877.21
-13.47
Nifty Spot = 8779.85
Lot Size = 75
Bull-Call Spreads
Bear-Put Spreads
Action
Strike
Price
Risk
Reward
BEP
Action
Strike
Price
Risk
Reward
BEP
Buy
8800
87.20
Buy
8800
81.35
44.60
55.40
8844.60
33.70
66.30
8766.30
Sell
8900
42.60
Sell
8700
47.65
Buy
8800
87.20
Buy
8800
81.35
69.00
131.00
8869.00
53.00
147.00
8747.00
Sell
9000
18.20
Sell
8600
28.35
Buy
8900
42.60
Buy
8700
47.65
24.40
75.60
8924.40
19.30
80.70
8680.70
Sell
9000
18.20
Sell
8600
28.35
Note: Above mentioned Bullish or Bearish Spreads in Nifty (September Series) are given as an information and not as a recommendation.
Nifty Put-Call Analysis
3
Technical & Derivatives Report
September 19, 2016
Daily Pivot Levels for Nifty Constituents
Scrips
S2
S1
PIVOT
R1
R2
ACC
1,600
1,613
1,627
1,640
1,653
ADANIPORTS
264
268
271
275
279
AMBUJACEM
258
260
264
266
269
ASIANPAINT
1,134
1,144
1,163
1,174
1,192
AUROPHARMA
773
779
789
795
806
AXISBANK
582
592
602
612
622
BAJAJ-AUTO
2,884
2,933
2,982
3,031
3,080
BANKBARODA
160
162
167
169
174
BHEL
141
144
149
151
156
BPCL
564
571
576
584
589
BHARTIARTL
318
321
324
326
329
INFRATEL
342
347
351
356
360
BOSCH
22,902
23,170
23,385
23,653
23,868
CIPLA
582
588
592
598
602
COALINDIA
320
322
325
327
329
DRREDDY
3,111
3,131
3,154
3,174
3,198
EICHERMOT
22,220
22,678
22,959
23,416
23,698
GAIL
382
385
390
394
399
GRASIM
4,702
4,778
4,826
4,901
4,949
HCLTECH
767
777
784
794
801
HDFCBANK
1,275
1,286
1,295
1,307
1,316
HDFC
1,378
1,388
1,402
1,412
1,426
HEROMOTOCO
3,462
3,525
3,584
3,648
3,706
HINDALCO
138
140
144
146
150
HINDUNILVR
897
905
917
924
936
ICICIBANK
260
264
270
273
279
IDEA
82
84
85
86
87
INDUSINDBK
1,142
1,156
1,176
1,190
1,210
INFY
1,028
1,044
1,054
1,070
1,081
ITC
253
256
259
263
266
KOTAKBANK
795
801
810
816
826
LT
1,450
1,461
1,480
1,492
1,511
LUPIN
1,513
1,525
1,540
1,552
1,567
M&M
1,383
1,395
1,413
1,425
1,443
MARUTI
5,409
5,491
5,555
5,638
5,702
NTPC
150
151
154
156
159
ONGC
245
248
250
253
255
POWERGRID
169
173
177
180
184
RELIANCE
1,041
1,058
1,076
1,093
1,111
SBIN
248
251
257
260
265
SUNPHARMA
774
779
786
791
799
TCS
2,297
2,329
2,353
2,385
2,409
TATAMTRDVR
344
349
355
359
365
TATAMOTORS
533
541
554
562
576
TATAPOWER
74
75
75
76
77
TATASTEEL
348
354
363
368
377
TECHM
454
460
464
470
474
ULTRACEMCO
3,800
3,862
3,945
4,007
4,090
WIPRO
476
478
480
482
484
YESBANK
1,109
1,139
1,189
1,220
1,270
ZEEL
504
512
524
532
544
4
Technical & Derivatives Report
September 19, 2016
Research Team Tel: 022 - 39357800
For Technical Queries
For Derivatives Queries
DISCLAIMER
Angel Broking Private Limited (hereinafter referred to as “Angel”) is a registered Member of National Stock Exchange of India Limited,
Bombay Stock Exchange Limited and Metropolitan Stock Exchange Limited. It is also registered as a Depository Participant with CDSL
and Portfolio Manager with SEBI. It also has registration with AMFI as a Mutual Fund Distributor. Angel Broking Private Limited is a
registered entity with SEBI for Research Analyst in terms of SEBI (Research Analyst) Regulations, 2014 vide registration number
INH000000164. Angel or its associates has not been debarred/ suspended by SEBI or any other regulatory authority for accessing
/dealing in securities Market. Angel or its associates/analyst has not received any compensation / managed or co-managed public
offering of securities of the company covered by Analyst during the past twelve months.
This document is solely for the personal information of the recipient, and must not be singularly used as the basis of any investment
decision. Nothing in this document should be construed as investment or financial advice. Each recipient of this document should
make such investigations as they deem necessary to arrive at an independent evaluation of an investment in the securities of the
companies referred to in this document (including the merits and risks involved), and should consult their own advisors to determine
the merits and risks of such an investment.
Reports based on technical and derivative analysis center on studying charts of a stock's price movement, outstanding positions and
trading volume, as opposed to focusing on a company's fundamentals and, as such, may not match with a report on a company's
fundamentals. Investors are advised to refer the Fundamental and Technical Research Reports available on our website to evaluate the
contrary view, if any.
The information in this document has been printed on the basis of publicly available information, internal data and other reliable
sources believed to be true, but we do not represent that it is accurate or complete and it should not be relied on as such, as this
document is for general guidance only. Angel Broking Pvt. Limited or any of its affiliates/ group companies shall not be in any way
responsible for any loss or damage that may arise to any person from any inadvertent error in the information contained in this report.
Angel Broking Pvt. Limited has not independently verified all the information contained within this document. Accordingly, we cannot
testify, nor make any representation or warranty, express or implied, to the accuracy, contents or data contained within this document.
While Angel Broking Pvt. Limited endeavors to update on a reasonable basis the information discussed in this material, there may be
regulatory, compliance, or other reasons that prevent us from doing so.
This document is being supplied to you solely for your information, and its contents, information or data may not be reproduced,
redistributed or passed on, directly or indirectly.
Neither Angel Broking Pvt. Limited, nor its directors, employees or affiliates shall be liable for any loss or damage that may arise from
or in connection with the use of this information.
5