Technical & Derivatives Report
July 19, 2016
Sensex (27747) / Nifty (8509)
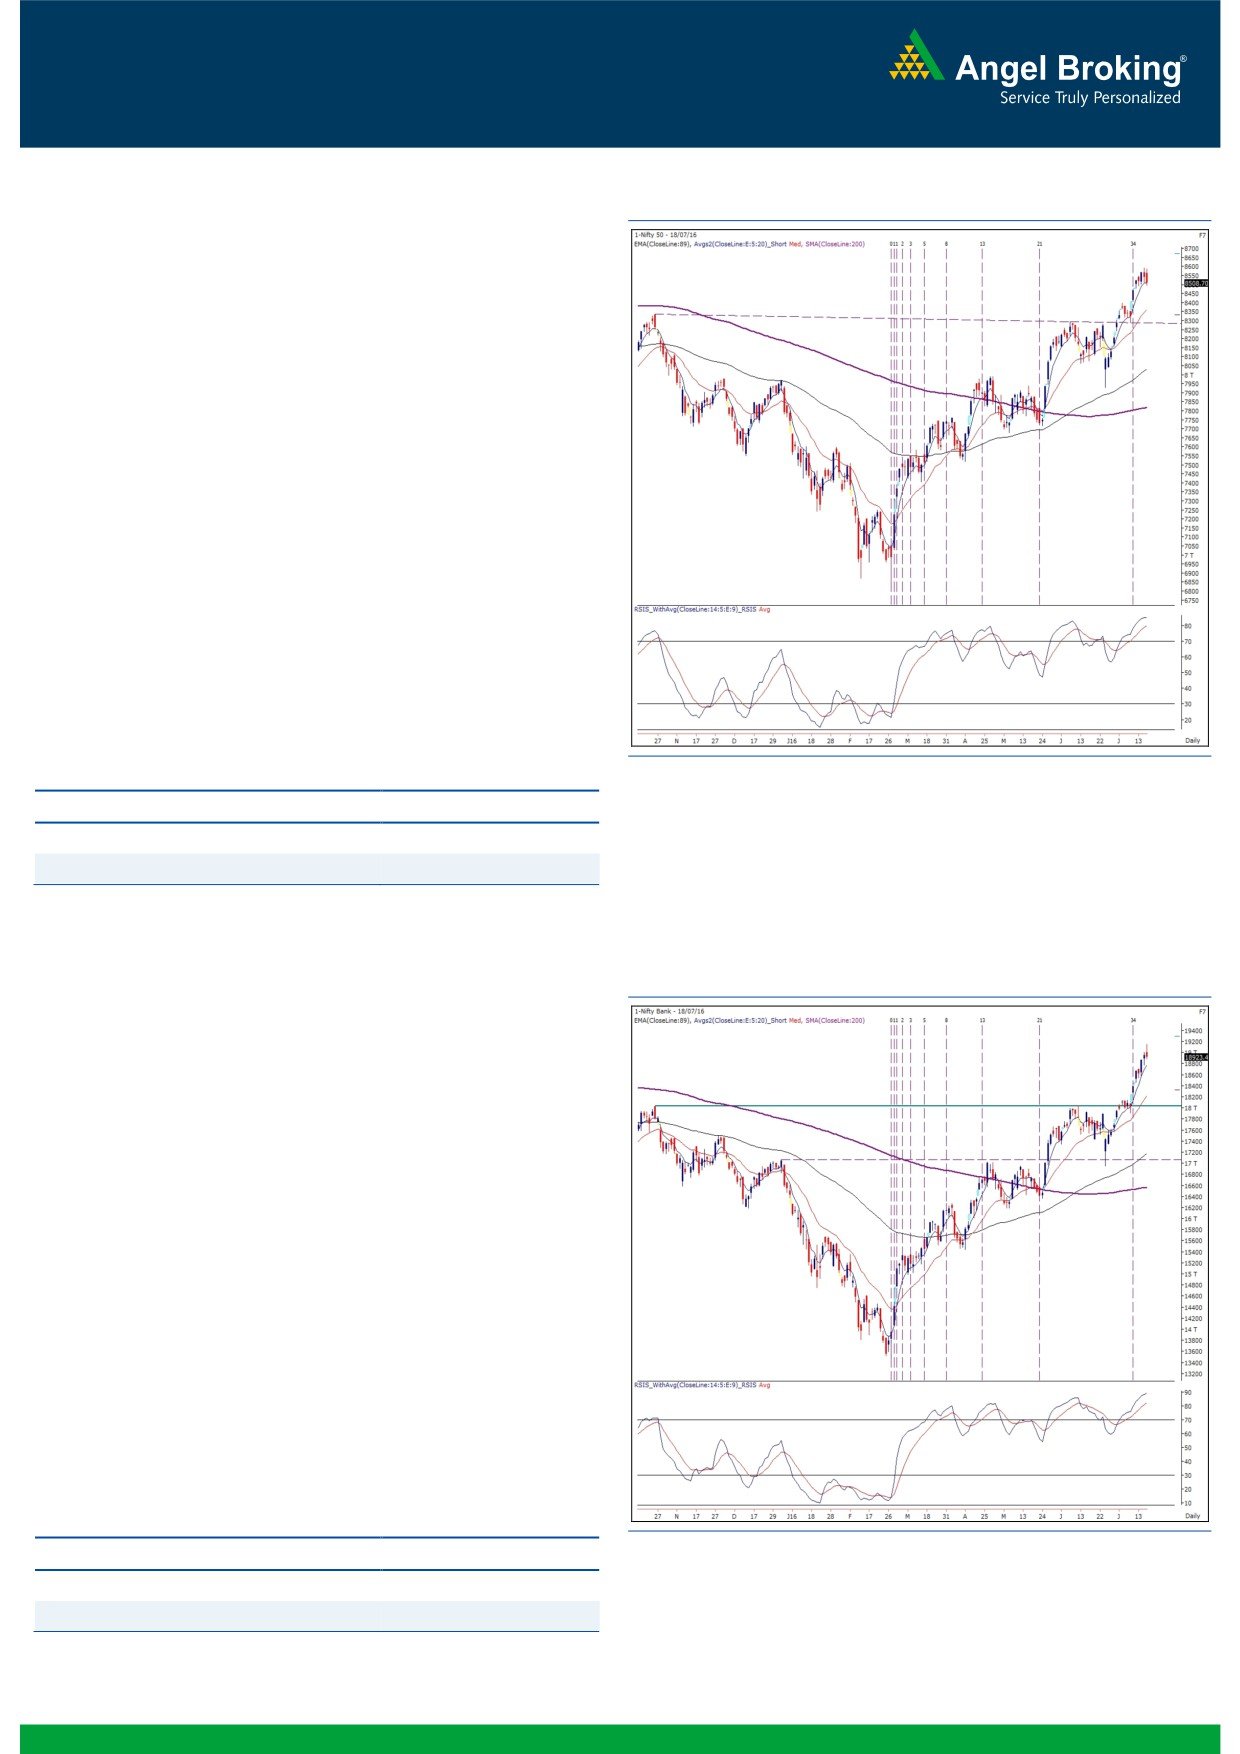
Exhibit 1: Nifty Daily Chart
The opening session of the week began with a mildly positive bias
owing to mixed global cues. Subsequently, the index maintained
its positivity throughout the first half and at one point of time, the
Nifty was at a kissing distance from the 8600 mark. However, a
strong bout of selling in the latter half dragged the index lowers to
close tad above the support level of 8500.
Yesterday, for the first time in last four weeks, we saw some hint
of decent profit booking. Thus, going forward, momentum traders
should keep a close eye on intraday support level of 8493. In
case of a sustainable move below this level, we may see an
extension of yesterday’s profit booking towards 8443 - 8400.
However, traders should keep in mind that this would just be a
corrective leg of the higher degree uptrend and thus, shouldn’t be
participating aggressively on the short side. On the flipside, we
maintain our directionally positive stance on the market and
expect this Nifty to test 8606 - 8655 levels. Traders are advised to
adopt a stock specific approach and trade with strict stop losses.
Key Levels
Support 1 - 8443
Resistance 1 - 8606
Support 2 - 8400
Resistance 2 - 8655
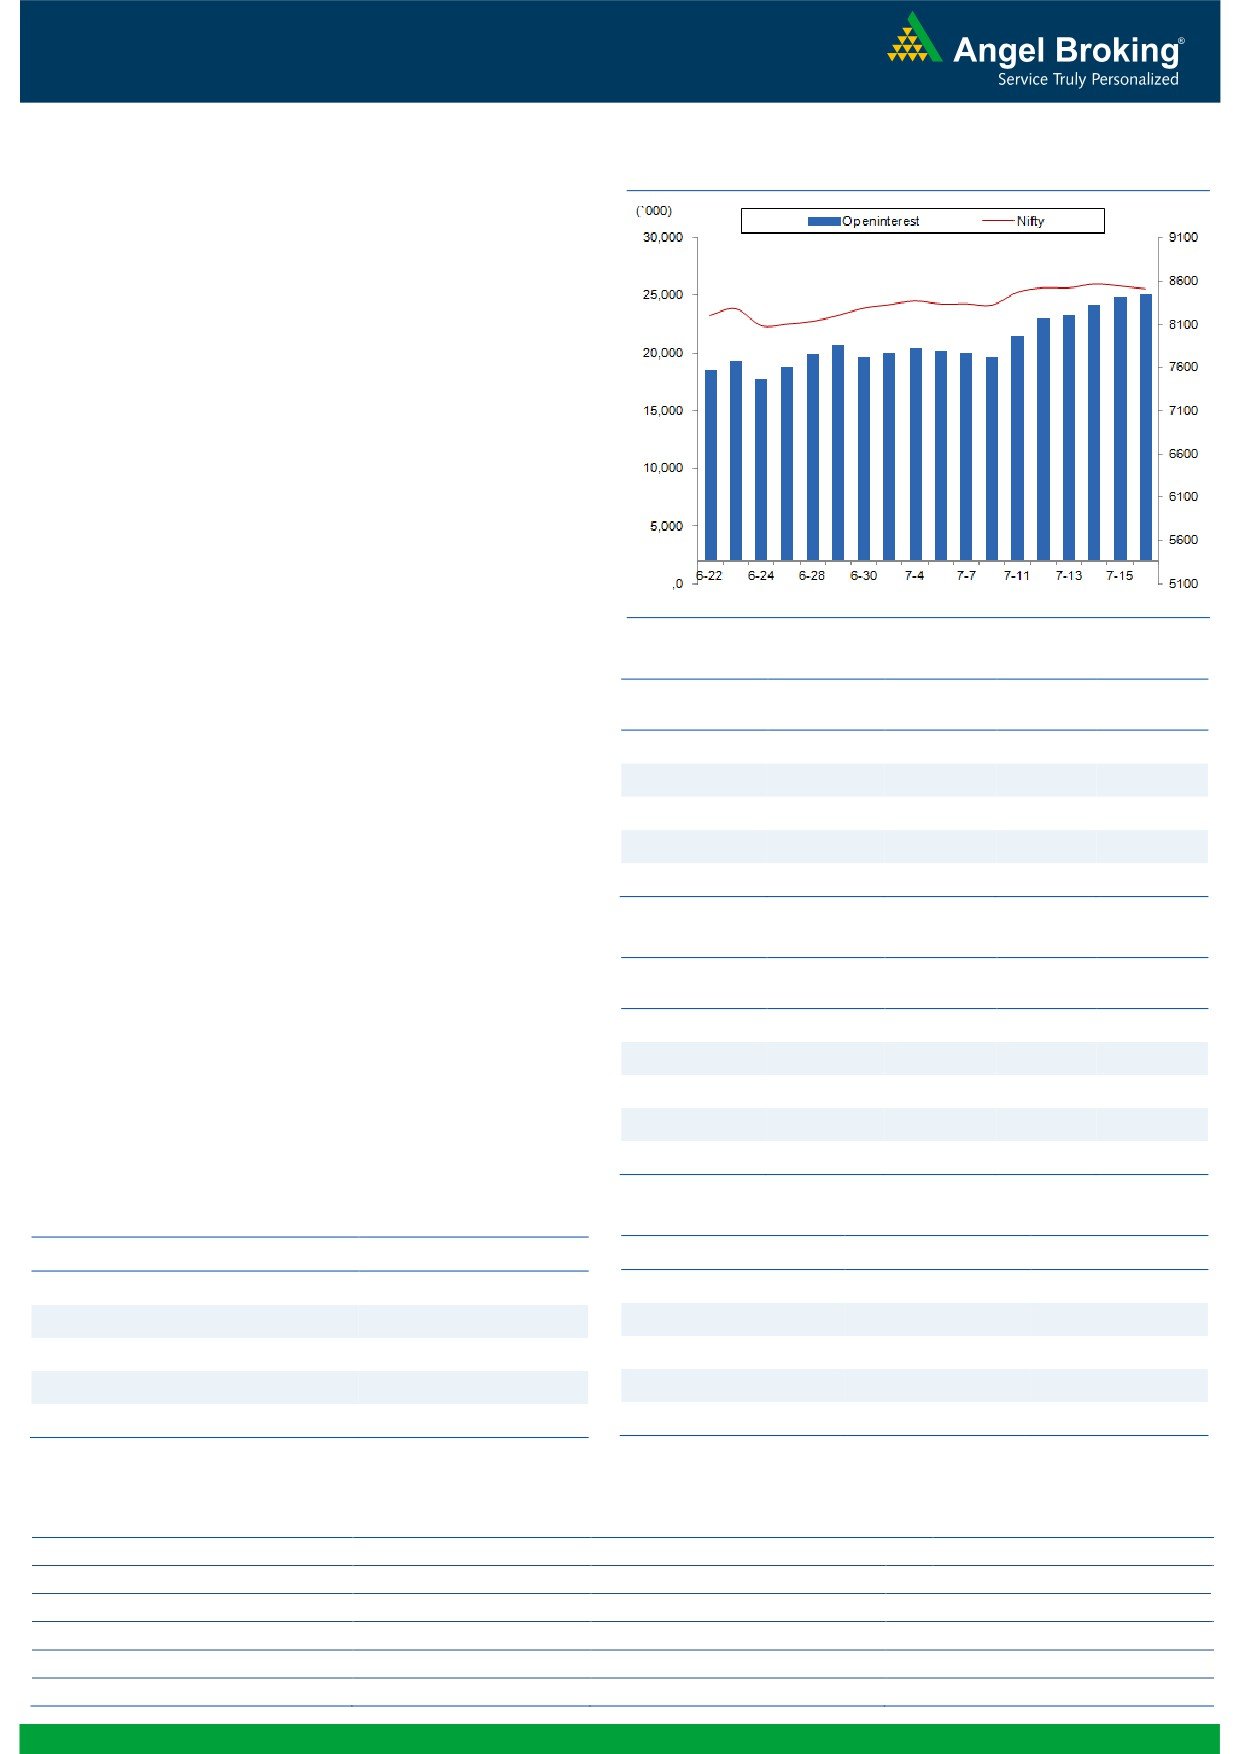
Nifty Bank Outlook - (18923)
Exhibit 2: Nifty Bank Daily Chart
In yesterday's trading session, the Nifty Bank index rallied higher
post opening; however, corrective action in last couple of hours
eroded intraday gains and the index ended the session with
marginal losses of 0.16 percent over Friday's close.
In our yesterday's report, we had highlighted the resistance level
of 19229 (July 2015 high) and due to the overbought momentum
readings near the resistance, we were expecting a possible profit
booking around the resistance. The index approached near the
resistance area in initial couple of hours yesterday, which was
followed by a corrective move during the closing. Although, the
broader trend still remains up, corrective move within the uptrend
cannot be ruled out near the resistance. Hence, we continue to
advise traders to lighten up their positions around the resistance
and wait for dips to re-enter into long positions. The intraday
support for the index is placed around 18770 and 18710;
whereas, resistances are seen around 19150 and 19229.
Key Levels
Support 1 - 18770
Resistance 1 - 19150
Support 2 - 18710
Resistance 2 - 19229
1
Technical & Derivatives Report
July 19, 2016
Comments
Nifty Vs OI
The Nifty futures open interest has increased by 0.96%
BankNifty futures open interest has increased by 0.31%
as market closed at 8508.70 levels.
The Nifty July future closed with a premium of 11.80
points against a premium of 13.45 points in previous
session. The August series closed at a premium of 48.15
points.
The Implied Volatility of at the money options has
increased from 13.61% to 14.40%.
The total OI of the market is Rs. 2,66,900/- cr. and the
stock futures OI is Rs. 70,489/- cr.
Few of the liquid counters where we have seen high cost
of carry are IFCI, RECLTD, SOUTHBANK, ALBK and
POWERGRID.
Views
OI Gainers
FIIs were net buyer in both cash market and Index
OI
PRICE
Futures segment. They bought equities to the tune of
SCRIP
OI
PRICE
CHG. (%)
CHG. (%)
Rs. 599 crores. While, they bought Index Futures worth
MINDTREE
2150400
58.87
607.30
-4.98
Rs. 807 crores with rise in open interest, indicating
ICIL
606000
17.44
868.70
-5.08
formation of long positions in last trading session.
WIPRO
6036000
13.33
551.70
-0.57
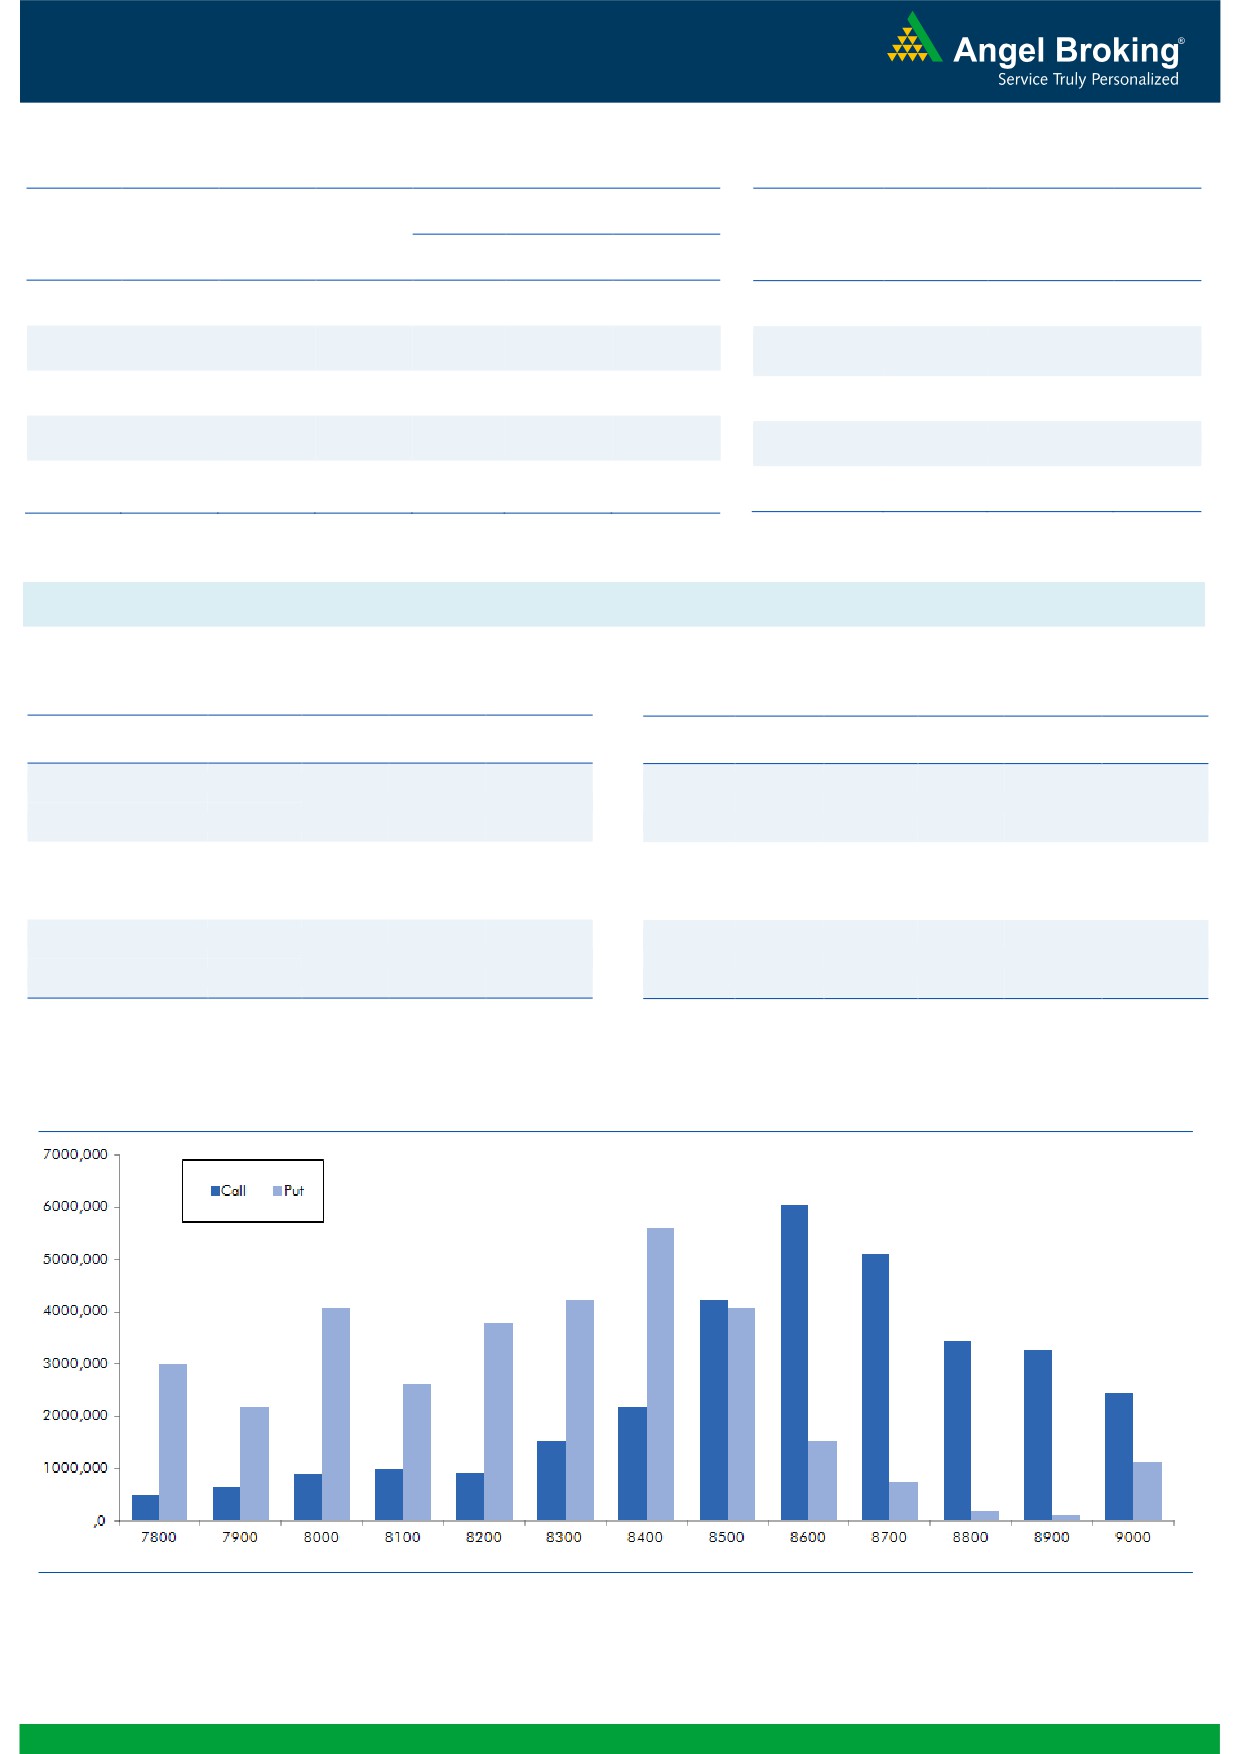
In Index Options segment, FIIs were net seller worth
Rs. 642 crores with rise in open interest. In call options,
OIL
1108400
7.77
362.30
-3.39
8500 - 8650 strikes were active and they also added
ONGC
37017500
7.75
219.60
-5.02
some fresh positions. On the other hand, we didn’t
witness any major build-up in put options. However,
OI Losers
8100 put strike have seen some amount of unwinding.
OI
PRICE
SCRIP
OI
PRICE
Highest OI in current series is placed at 8600 call and
CHG. (%)
CHG. (%)
8400 put options.
HINDZINC
5209600
-9.71
189.35
-3.64
Despite yesterday’s correction, FIIs continued their buying
UNIONBANK
18088000
-7.45
138.70
-1.00
streak in Index Futures. Looking at the derivatives data,
JINDALSTEL
46737000
-6.85
68.95
-5.22
we expect this upward momentum to continue. Thus,
UBL
1225000
-5.86
790.00
0.92
traders are suggested to trade with a positive bias, till we
CROMPGREAV
18792000
-5.49
70.85
0.78
see any traces of profit booking.
Historical Volatility
Put-Call Ratio
SCRIP
HV
SCRIP
PCR-OI
PCR-VOL
MINDTREE
33.93
NIFTY
1.03
1.06
IDEA
50.39
BANKNIFTY
1.30
1.10
ONGC
40.57
INFY
0.46
0.43
BHARTIARTL
37.79
RELIANCE
0.41
0.43
ICIL
45.70
TCS
0.46
0.50
Strategy Date
Symbol
Strategy
Status
04-07-2016
RCOM
Ratio Bull Call Spread
Active
11-07-2016
BANKNIFTY
Bull Call Spread
Didn’t trigger
18-07-2016
TCS
Long Put
Active
2
Technical & Derivatives Report
July 19, 2016
FII Statistics for 18-July 2016
Turnover on 18-July 2016
Open Interest
No. of
Turnover
Change
Detail
Buy
Sell
Net
Instrument
Value
Contracts
( in Cr. )
(%)
Contracts
Change (%)
(in Cr.)
INDEX
INDEX
1870.90
1064.35
806.56
314506
20530.90
2.05
210192
14365.84
-10.34
FUTURES
FUTURES
INDEX
INDEX
28249.64
27607.84
641.80
995367
64206.11
4.18
3288205
223735.54
9.72
OPTIONS
OPTIONS
STOCK
4955.04
5347.75
(392.71)
837245
53153.39
0.16
STOCK
FUTURES
539128
35208.93
-18.00
FUTURES
STOCK
STOCK
5324.73
5340.57
(15.84)
103671
6720.70
4.45
OPTIONS
438700
28388.17
-31.60
OPTIONS
TOTAL
40400.31
39360.51
1039.80
2250789
144611.10
2.36
TOTAL
4476225
301698.49
-0.88
Nifty Spot = 8508.70
Lot Size = 75
Bull-Call Spreads
Bear-Put Spreads
Action
Strike
Price
Risk
Reward
BEP
Action
Strike
Price
Risk
Reward
BEP
Buy
8500
91.05
Buy
8500
71.85
46.35
53.65
8546.35
31.65
68.35
8468.35
Sell
8600
44.70
Sell
8400
40.20
Buy
8500
91.05
Buy
8500
71.85
71.90
128.10
8571.90
51.10
148.90
8448.90
Sell
8700
19.15
Sell
8300
20.75
Buy
8600
44.70
Buy
8400
40.20
25.55
74.45
8625.55
19.45
80.55
8380.55
Sell
8700
19.15
Sell
8300
20.75
Note: Above mentioned Bullish or Bearish Spreads in Nifty (July Series) are given as an information and not as a recommendation.
Nifty Put-Call Analysis
3
Technical & Derivatives Report
July 19, 2016
Daily Pivot Levels for Nifty Constituents
Scrips
S2
S1
PIVOT
R1
R2
ACC
1,573
1,584
1,602
1,613
1,630
ADANIPORTS
212
215
219
222
226
AMBUJACEM
257
258
261
262
264
ASIANPAINT
1,013
1,021
1,033
1,041
1,053
AUROPHARMA
736
743
754
761
773
AXISBANK
564
568
572
576
580
BAJAJ-AUTO
2,684
2,720
2,741
2,777
2,798
BANKBARODA
153
156
161
164
170
BHEL
135
137
141
144
147
BPCL
546
551
557
562
568
BHARTIARTL
349
356
368
375
387
INFRATEL
348
353
356
361
364
BOSCH
23,626
23,830
24,003
24,207
24,380
CIPLA
498
502
510
514
522
COALINDIA
316
319
322
324
327
DRREDDY
3,508
3,538
3,574
3,604
3,640
EICHERMOT
19,719
19,836
19,918
20,035
20,117
GAIL
377
381
390
395
404
GRASIM
4,729
4,764
4,806
4,840
4,883
HCLTECH
711
717
721
726
730
HDFCBANK
1,214
1,221
1,230
1,236
1,245
HDFC
1,309
1,327
1,357
1,376
1,405
HEROMOTOCO
3,207
3,228
3,262
3,283
3,317
HINDALCO
133
135
138
140
144
HINDUNILVR
890
906
926
942
963
ICICIBANK
257
260
266
269
274
IDEA
96
100
106
110
116
INDUSINDBK
1,117
1,124
1,134
1,141
1,152
INFY
1,044
1,063
1,074
1,093
1,104
ITC
246
248
249
250
251
KOTAKBANK
763
770
776
783
790
LT
1,542
1,558
1,581
1,597
1,620
LUPIN
1,643
1,654
1,672
1,683
1,701
M&M
1,453
1,461
1,471
1,479
1,490
MARUTI
4,352
4,403
4,484
4,535
4,616
NTPC
154
155
156
157
158
ONGC
210
214
222
226
233
POWERGRID
161
162
164
165
167
RELIANCE
979
992
1,016
1,029
1,053
SBIN
225
227
230
232
236
SUNPHARMA
766
771
776
782
786
TCS
2,406
2,420
2,444
2,458
2,483
TATAMTRDVR
307
311
317
321
326
TATAMOTORS
481
487
496
502
511
TATAPOWER
69
70
71
71
73
TATASTEEL
354
360
370
376
385
TECHM
500
503
507
510
513
ULTRACEMCO
3,445
3,472
3,510
3,537
3,575
WIPRO
541
547
550
556
559
YESBANK
1,162
1,168
1,176
1,183
1,191
ZEEL
450
456
465
471
480
4
Technical & Derivatives Report
July 19, 2016
Research Team Tel: 022 - 39357800
For Technical Queries
For Derivatives Queries
DISCLAIMER
Angel Broking Private Limited (hereinafter referred to as “Angel”) is a registered Member of National Stock Exchange of India Limited,
Bombay Stock Exchange Limited and MCX Stock Exchange Limited. It is also registered as a Depository Participant with CDSL and
Portfolio Manager with SEBI. It also has registration with AMFI as a Mutual Fund Distributor. Angel Broking Private Limited is a
registered entity with SEBI for Research Analyst in terms of SEBI (Research Analyst) Regulations, 2014 vide registration number
INH000000164. Angel or its associates has not been debarred/ suspended by SEBI or any other regulatory authority for accessing
/dealing in securities Market. Angel or its associates including its relatives/analyst do not hold any financial interest/beneficial
ownership of more than 1% in the company covered by Analyst. Angel or its associates/analyst has not received any compensation /
managed or co-managed public offering of securities of the company covered by Analyst during the past twelve months. Angel/analyst
has not served as an officer, director or employee of company covered by Analyst and has not been engaged in market making activity
of the company covered by Analyst.
This document is solely for the personal information of the recipient, and must not be singularly used as the basis of any investment
decision. Nothing in this document should be construed as investment or financial advice. Each recipient of this document should
make such investigations as they deem necessary to arrive at an independent evaluation of an investment in the securities of the
companies referred to in this document (including the merits and risks involved), and should consult their own advisors to determine
the merits and risks of such an investment.
Reports based on technical and derivative analysis center on studying charts of a stock's price movement, outstanding positions and
trading volume, as opposed to focusing on a company's fundamentals and, as such, may not match with a report on a company's
fundamentals.
The information in this document has been printed on the basis of publicly available information, internal data and other reliable
sources believed to be true, but we do not represent that it is accurate or complete and it should not be relied on as such, as this
document is for general guidance only. Angel Broking Pvt. Limited or any of its affiliates/ group companies shall not be in any way
responsible for any loss or damage that may arise to any person from any inadvertent error in the information contained in this report.
Angel Broking Pvt. Limited has not independently verified all the information contained within this document. Accordingly, we cannot
testify, nor make any representation or warranty, express or implied, to the accuracy, contents or data contained within this document.
While Angel Broking Pvt. Limited endeavors to update on a reasonable basis the information discussed in this material, there may be
regulatory, compliance, or other reasons that prevent us from doing so.
This document is being supplied to you solely for your information, and its contents, information or data may not be reproduced,
redistributed or passed on, directly or indirectly.
Neither Angel Broking Pvt. Limited, nor its directors, employees or affiliates shall be liable for any loss or damage that may arise from
or in connection with the use of this information.
Note: Please refer to the important ‘Stock Holding Disclosure' report on the Angel website (Research Section). Also, please refer to the
latest update on respective stocks for the disclosure status in respect of those stocks. Angel Broking Pvt. Limited and its affiliates may
have investment positions in the stocks recommended in this report.
5