Technical & Derivatives Report
May 19, 2016
Sensex (25705) / Nifty (7870)
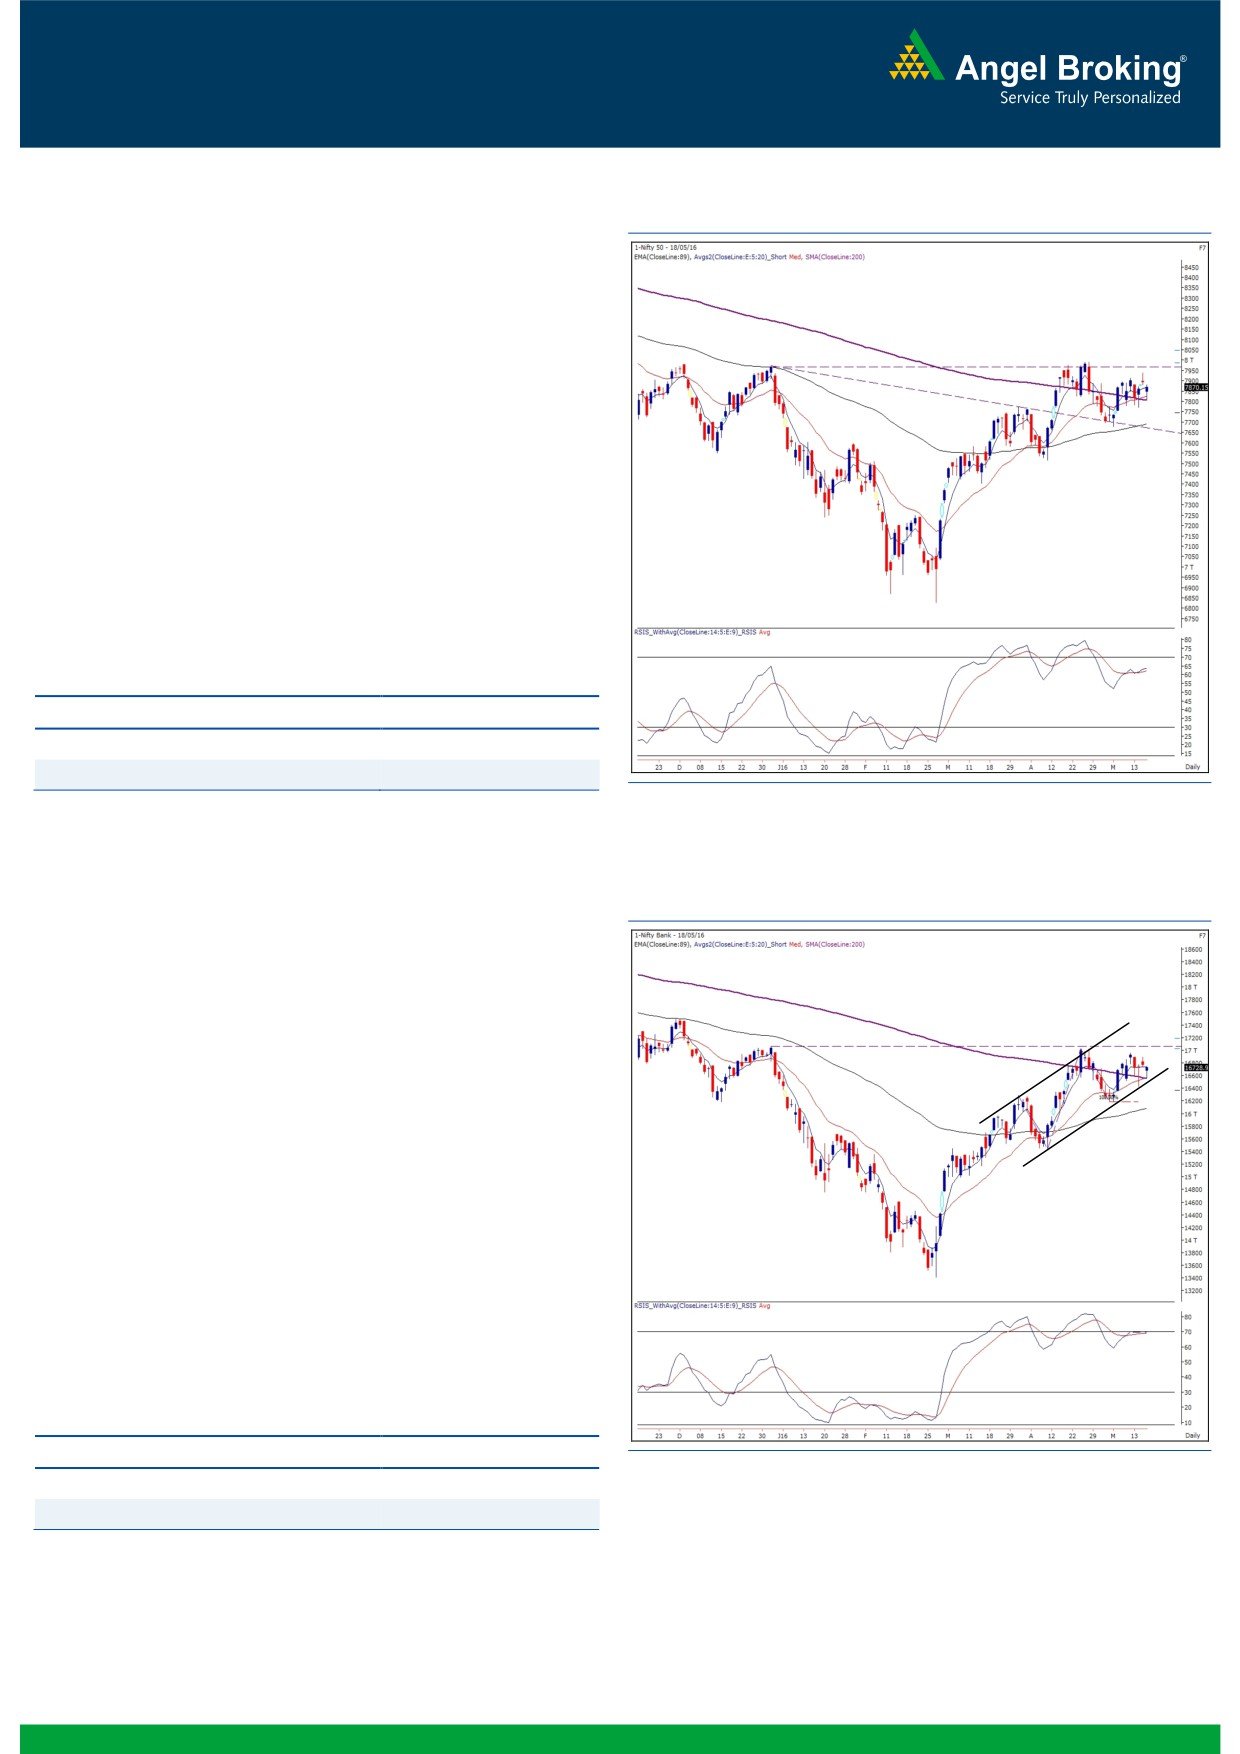
Exhibit 1: Nifty Daily Chart
Tuesday’s gap up opening was followed by a weak beginning on
Wednesday owing to extremely negative cues from the global
peers. Subsequently, the index extended its losses in the first half.
However, a v-shaped recovery in the latter half pulled the index
higher to close with nominal losses of 0.26%.
Yesterday’s price action was a mirror image of what we had
experienced on Tuesday. The index first traded with a pessimistic
mood and then pared down all losses to fill yesterday’s downside
gap. Last two days movement clearly indicates that the market is
lacking direction and probably waiting for a trigger to come out
of this congestion zone. Despite this volatility, we maintain our
positive stance on the market and expect the index to steadily
move towards the higher end of 7940 - 7980. On the flipside,
7840 - 7810 are likely to act as immediate support levels.
Key Levels
Support 1 - 7840
Resistance 1 - 7940
Support 2 - 7810
Resistance 2 - 7980
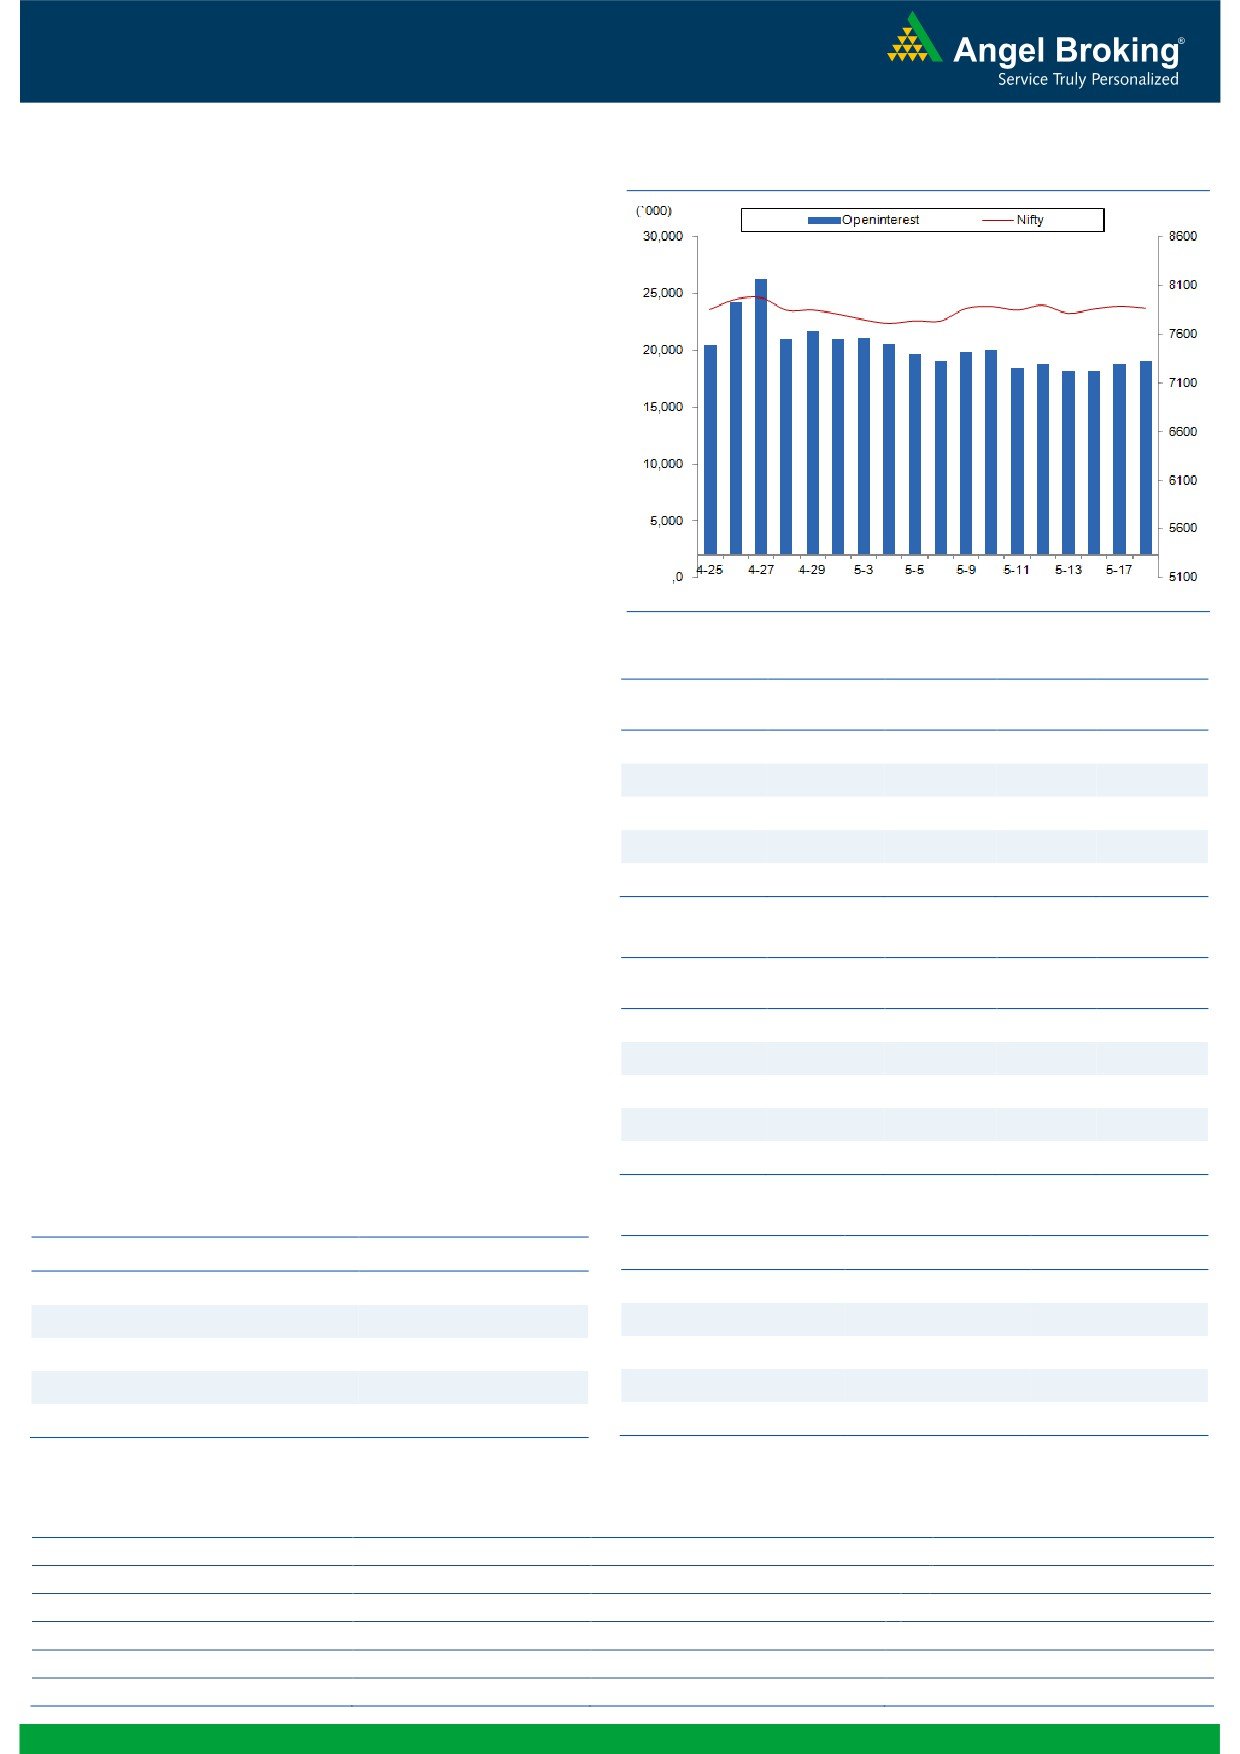
Exhibit 2: Nifty Bank Daily Chart
Nifty Bank Outlook - (16729)
In line with benchmark indices, the Nifty Bank index too opened
with a loss of around 90 points and started moving lower from
the first tick. However, post the correction in initial hour, the
banking index rebounded piercingly and filled the entire gap.
Eventually, the Nifty Bank index ended the session with a
marginal loss of 0.20 percent over its previous close.
From last few trading sessions, the Nifty Bank index has been
moving in a narrow range and not giving any directional move
on either side. Currently, the banking index is hovering around
the lower end of the ‘Rising Channel’ on daily chart. Going
forward, a strong support for the index is placed at 16500 -
16430 levels; whereas, the major resistance continues to be in
the range of 17020 - 17050. A move beyond this range would
dictate the near term direction. Till then, traders should continue
to focus on stock specific strategies with proper risk management.
Key Levels
Support 1 - 16500
Resistance 1 - 16950
Support 2 - 16430
Resistance 2 - 17050
1
Technical & Derivatives Report
May 19, 2016
Comments
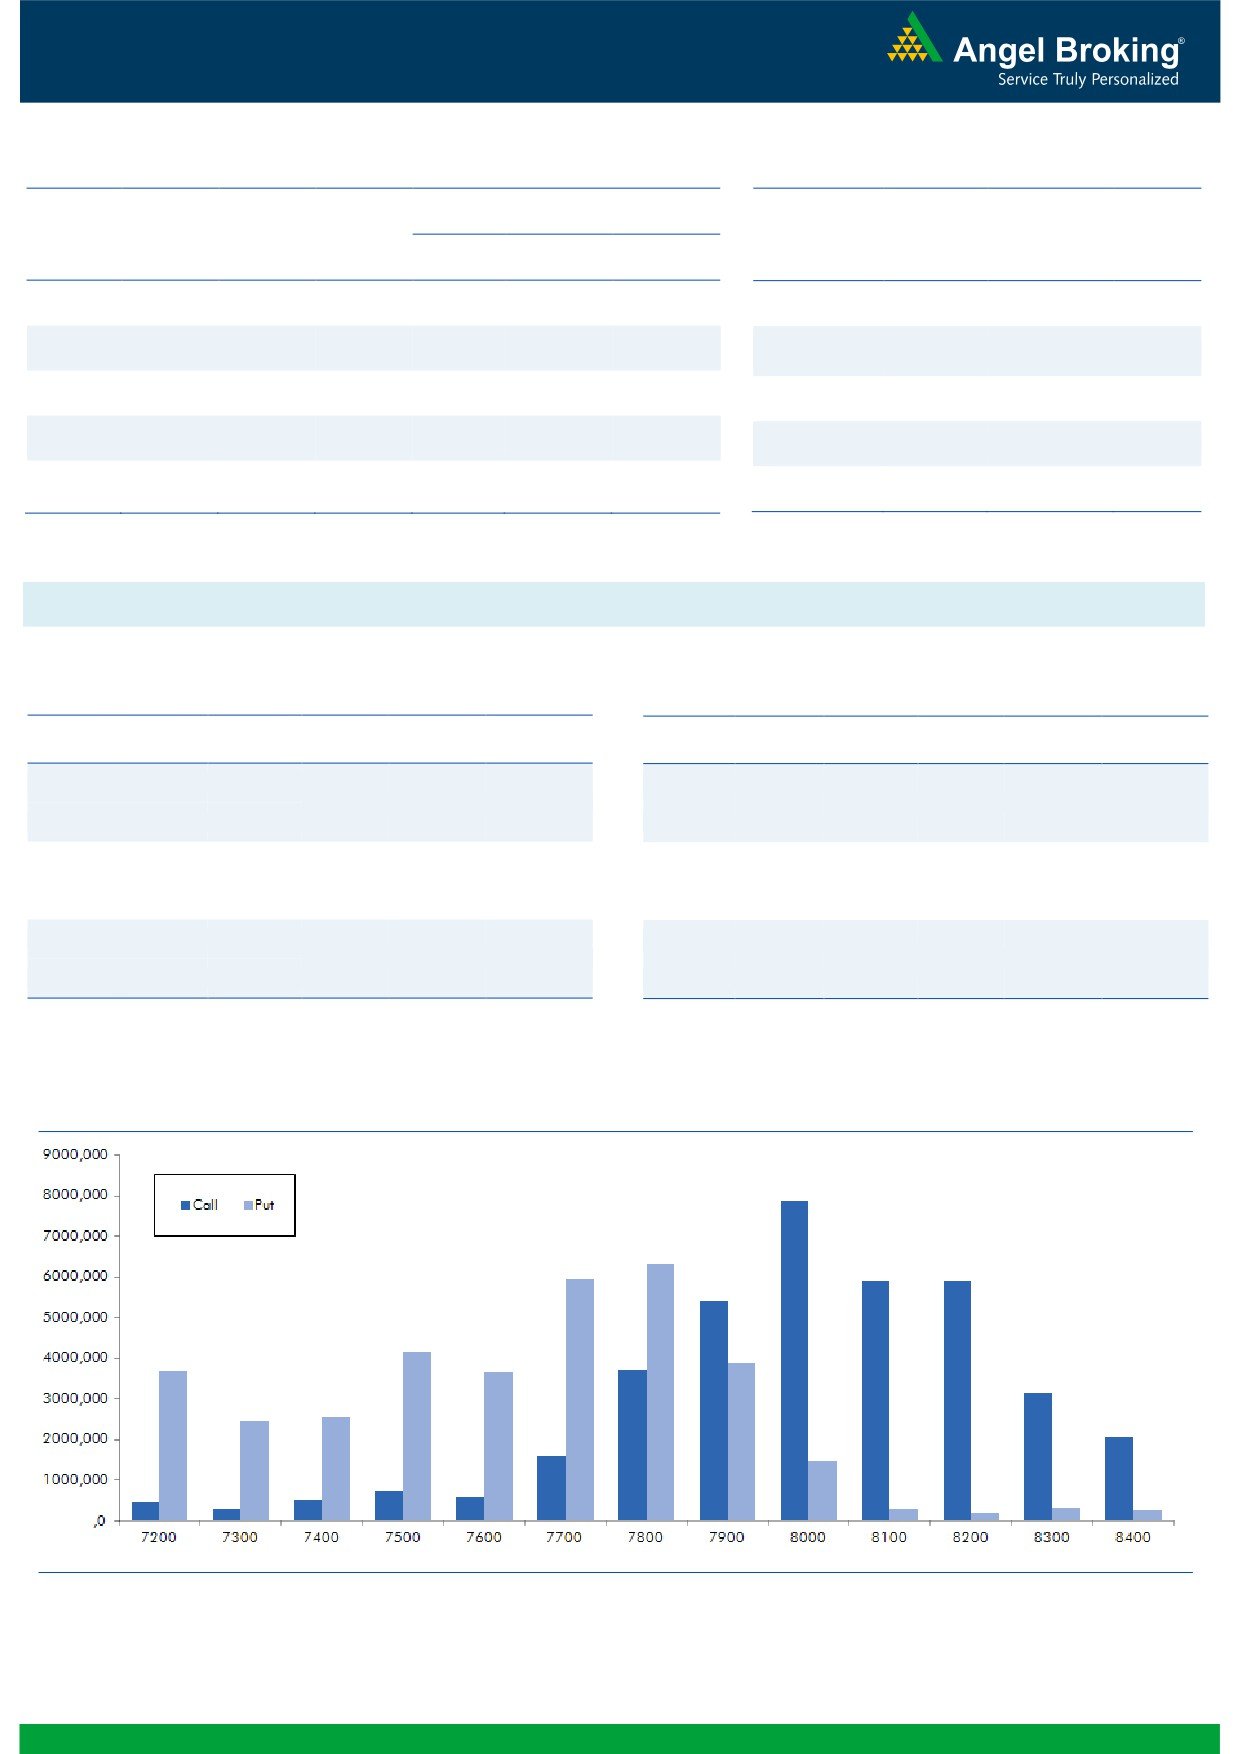
Nifty Vs OI
The Nifty futures open interest has increased by 0.97%
BankNifty futures open interest has increased by 2.57%
as market closed at 7870.15 levels.
The Nifty May future closed at a premium of 9.15 points
against a premium of 16.85 points. The June series
closed at a premium of 19.25 points.
The Implied Volatility of at the money options has
increased from 15.16% to 15.25%.
The total OI of the market is Rs. 2,39,190/- cr. and the
stock futures OI is Rs. 62,977/- cr.
Few of the liquid counters where we have seen high cost
of carry are UNITECH, JPASSOCIAT, SOUTHBANK, IDBI
and NCC.
Views
Yesterday, the FIIs were net seller in both equity cash and
OI Gainers
index future segment. They sold equities worth Rs. 251
OI
PRICE
crores. While, they were seller in Index future to the tune
SCRIP
OI
PRICE
CHG. (%)
CHG. (%)
of Rs.
1282 with significant rise in OI, indicating
CASTROLIND
5388900
34.92
384.90
-2.99
formation of short positions.
IBREALEST
30681000
27.58
93.00
4.49
In Index Options front, FIIs were net seller worth Rs. 112
STAR
1058000
8.85
1140.80
-2.03
crores with rise in OI. In call options, we witnessed OI
addition in 7800 and 7850 strikes; while, unwinding was
MCLEODRUSS
2270400
8.52
190.30
-0.10
seen in 8300, 8100 and 7900 strikes. Whereas, in put
HDIL
24904000
7.19
91.55
4.09
options,
7700 strike added huge fresh positions;
followed by unwinding in
7900 and
7600 strikes.
OI Losers
Maximum OI in current series is seen at 8000 call and
OI
PRICE
SCRIP
OI
PRICE
7800 put.
CHG. (%)
CHG. (%)
Yesterday’s sell figure in index future doesn’t bode well
VOLTAS
6203600
-11.56
331.60
-1.34
for bulls. But, we need to wait for a follow-up activity
HCLTECH
11248400
-6.36
742.40
1.32
from FIIs as that seems missing in past few sessions.
CANBK
11714000
-5.49
185.35
2.52
Traders are advised to remain light and wait for further
ABIRLANUVO
1160000
-5.19
1017.40
5.23
development on derivative data front before initiating
SYNDIBANK
12072000
-5.18
68.80
3.85
any fresh positions in index future.
Historical Volatility
Put-Call Ratio
SCRIP
HV
SCRIP
PCR-OI
PCR-VOL
TATACOMM
31.71
NIFTY
0.95
0.83
ABIRLANUVO
45.32
BANKNIFTY
0.93
0.75
HEXAWARE
38.35
RELIANCE
0.33
0.29
NMDC
40.35
SBIN
0.44
0.36
MCDOWELL-N
39.00
ICICIBANK
0.43
0.54
Strategy Date
Symbol
Strategy
Status
02-05-2016
NIFTY
Long Strangle
Active
09-05-2016
RELIANCE
Long Put
Loss Booked on May 17, 2016
16-05-2016
LT
Short Strangle
Active
2
Technical & Derivatives Report
May 19, 2016
FII Statistics for 18-May 2016
Turnover on 18-May 2016
Open Interest
No. of
Turnover
Change
Detail
Buy
Sell
Net
Instrument
Value
Contracts
( in Cr. )
(%)
Contracts
Change (%)
(in Cr.)
INDEX
INDEX
1616.64
2898.15
(1281.51)
273432
15731.20
9.68
327972
18357.21
19.82
FUTURES
FUTURES
INDEX
INDEX
30558.35
30670.23
(111.87)
1246645
72735.41
2.34
3882551
226425.24
13.27
OPTIONS
OPTIONS
STOCK
4750.02
4464.84
285.18
1050114
50479.13
(0.02)
STOCK
FUTURES
581160
28263.32
-3.72
FUTURES
STOCK
STOCK
3258.33
3358.74
(100.40)
89711
4332.27
7.17
OPTIONS
395235
19242.26
-0.27
OPTIONS
TOTAL
40183.35
41391.96
(1208.61)
2659902
143278.02
2.25
TOTAL
5186918
292288.03
10.77
Nifty Spot = 7870.15
Lot Size = 75
Bull-Call Spreads
Bear-Put Spreads
Action
Strike
Price
Risk
Reward
BEP
Action
Strike
Price
Risk
Reward
BEP
Buy
7900
60.55
Buy
7900
81.65
34.80
65.20
7934.80
40.20
59.80
7859.80
Sell
8000
25.75
Sell
7800
41.45
Buy
7900
60.55
Buy
7900
81.65
51.55
148.45
7951.55
61.15
138.85
7838.85
Sell
8100
9.00
Sell
7700
20.50
Buy
8000
25.75
Buy
7800
41.45
16.75
83.25
8016.75
20.95
79.05
7779.05
Sell
8100
9.00
Sell
7700
20.50
Note: Above mentioned Bullish or Bearish Spreads in Nifty (May Series) are given as an information and not as a recommendation.
Nifty Put-Call Analysis
3
Technical & Derivatives Report
May 19, 2016
Daily Pivot Levels for Nifty Constituents
Scrips
S2
S1
PIVOT
R1
R2
ACC
1,421
1,428
1,435
1,442
1,449
ADANIPORTS
178
181
183
186
188
AMBUJACEM
213
215
216
218
219
ASIANPAINT
944
953
962
972
981
AUROPHARMA
763
773
779
789
795
AXISBANK
492
496
499
504
507
BAJAJ-AUTO
2,426
2,444
2,473
2,491
2,520
BANKBARODA
138
140
142
144
146
BHEL
117
118
119
121
122
BPCL
913
922
940
950
968
BHARTIARTL
345
348
350
353
356
INFRATEL
375
379
382
386
389
BOSCH
20,551
20,802
21,141
21,392
21,731
CIPLA
517
521
524
528
530
COALINDIA
279
282
283
286
288
DRREDDY
2,978
3,002
3,023
3,047
3,068
EICHERMOT
18,123
18,422
18,620
18,918
19,116
GAIL
373
378
383
388
393
GRASIM
4,238
4,252
4,263
4,277
4,289
HCLTECH
720
730
738
748
755
HDFCBANK
1,122
1,131
1,141
1,151
1,161
HDFC
1,188
1,198
1,206
1,216
1,224
HEROMOTOCO
2,829
2,854
2,884
2,909
2,940
HINDALCO
86
88
89
90
91
HINDUNILVR
816
821
828
832
839
ICICIBANK
220
223
225
229
231
IDEA
108
109
110
111
112
INDUSINDBK
1,059
1,071
1,078
1,091
1,098
INFY
1,191
1,201
1,207
1,217
1,223
ITC
322
327
331
336
340
KOTAKBANK
694
702
708
715
721
LT
1,265
1,287
1,300
1,322
1,335
LUPIN
1,585
1,611
1,629
1,655
1,673
M&M
1,302
1,314
1,324
1,336
1,347
MARUTI
3,752
3,834
3,886
3,968
4,020
NTPC
134
135
137
138
139
ONGC
207
211
213
217
219
POWERGRID
141
142
144
144
146
RELIANCE
961
966
969
974
977
SBIN
171
176
178
182
185
SUNPHARMA
787
791
795
799
803
TCS
2,508
2,529
2,548
2,569
2,587
TATAMTRDVR
264
266
268
271
273
TATAMOTORS
379
382
385
388
390
TATAPOWER
69
69
70
71
71
TATASTEEL
320
325
327
332
335
TECHM
477
481
484
487
490
ULTRACEMCO
3,176
3,200
3,234
3,258
3,292
WIPRO
533
536
538
542
544
YESBANK
956
963
970
978
985
ZEEL
428
432
438
442
448
4
Technical & Derivatives Report
May 19, 2016
Research Team Tel: 022 - 39357800
For Technical Queries
For Derivatives Queries
DISCLAIMER
Angel Broking Private Limited (hereinafter referred to as “Angel”) is a registered Member of National Stock Exchange of India Limited,
Bombay Stock Exchange Limited and MCX Stock Exchange Limited. It is also registered as a Depository Participant with CDSL and
Portfolio Manager with SEBI. It also has registration with AMFI as a Mutual Fund Distributor. Angel Broking Private Limited is a
registered entity with SEBI for Research Analyst in terms of SEBI (Research Analyst) Regulations, 2014 vide registration number
INH000000164. Angel or its associates has not been debarred/ suspended by SEBI or any other regulatory authority for accessing
/dealing in securities Market. Angel or its associates including its relatives/analyst do not hold any financial interest/beneficial
ownership of more than 1% in the company covered by Analyst. Angel or its associates/analyst has not received any compensation /
managed or co-managed public offering of securities of the company covered by Analyst during the past twelve months. Angel/analyst
has not served as an officer, director or employee of company covered by Analyst and has not been engaged in market making activity
of the company covered by Analyst.
This document is solely for the personal information of the recipient, and must not be singularly used as the basis of any investment
decision. Nothing in this document should be construed as investment or financial advice. Each recipient of this document should
make such investigations as they deem necessary to arrive at an independent evaluation of an investment in the securities of the
companies referred to in this document (including the merits and risks involved), and should consult their own advisors to determine
the merits and risks of such an investment.
Reports based on technical and derivative analysis center on studying charts of a stock's price movement, outstanding positions and
trading volume, as opposed to focusing on a company's fundamentals and, as such, may not match with a report on a company's
fundamentals.
The information in this document has been printed on the basis of publicly available information, internal data and other reliable
sources believed to be true, but we do not represent that it is accurate or complete and it should not be relied on as such, as this
document is for general guidance only. Angel Broking Pvt. Limited or any of its affiliates/ group companies shall not be in any way
responsible for any loss or damage that may arise to any person from any inadvertent error in the information contained in this report.
Angel Broking Pvt. Limited has not independently verified all the information contained within this document. Accordingly, we cannot
testify, nor make any representation or warranty, express or implied, to the accuracy, contents or data contained within this document.
While Angel Broking Pvt. Limited endeavors to update on a reasonable basis the information discussed in this material, there may be
regulatory, compliance, or other reasons that prevent us from doing so.
This document is being supplied to you solely for your information, and its contents, information or data may not be reproduced,
redistributed or passed on, directly or indirectly.
Neither Angel Broking Pvt. Limited, nor its directors, employees or affiliates shall be liable for any loss or damage that may arise from
or in connection with the use of this information.
Note: Please refer to the important ‘Stock Holding Disclosure' report on the Angel website (Research Section). Also, please refer to the
latest update on respective stocks for the disclosure status in respect of those stocks. Angel Broking Pvt. Limited and its affiliates may
have investment positions in the stocks recommended in this report.
5