Technical & Derivatives Report
February 19, 2016
Sensex (23649) / Nifty (7192)
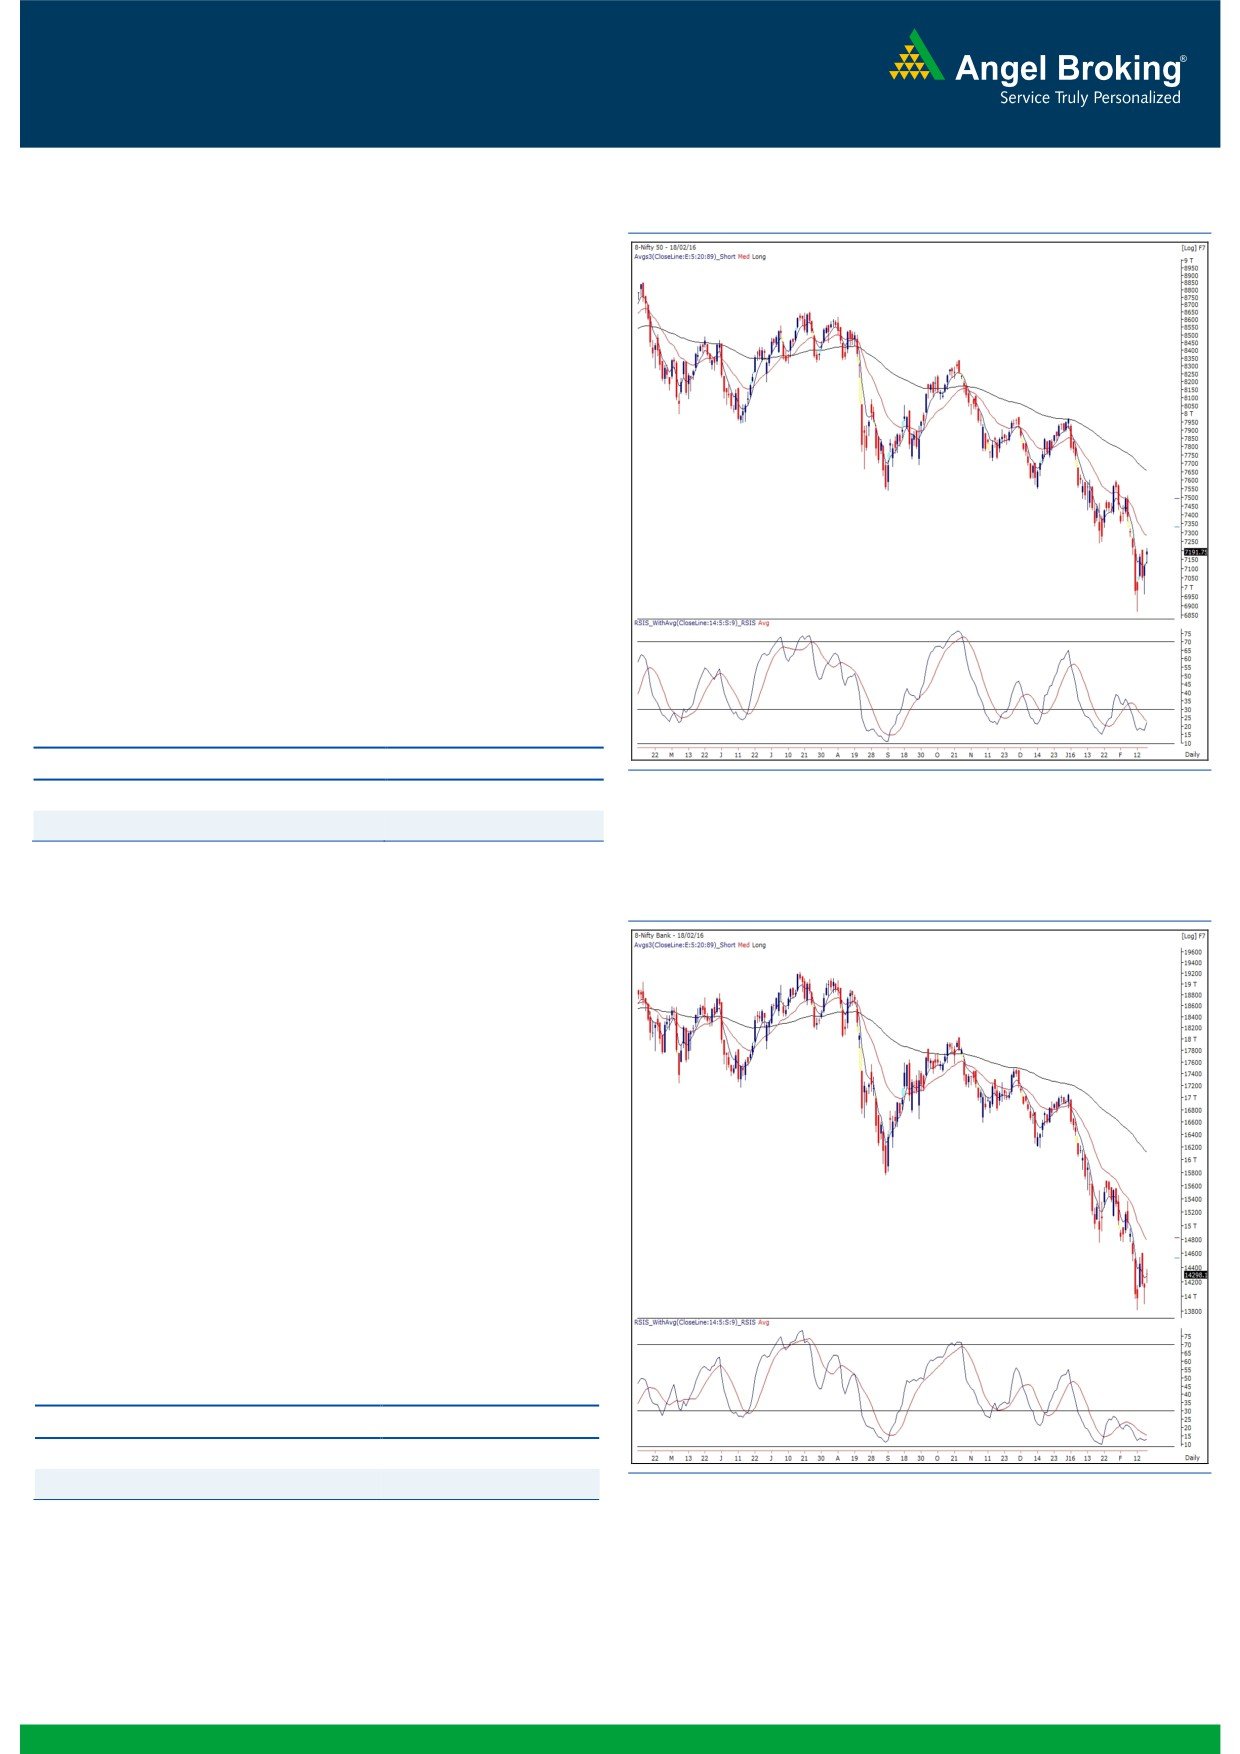
Exhibit 1: Nifty Daily Chart
Yesterday, the Nifty opened with an upside gap of around a
percent on the back of positive cues from global bourses. Post
the gap up opening, the index traded in a narrow range in
initial hour of trading and then started correcting to fill the
intraday gap. However, we witnessed a sharp recovery from
lower levels in the latter half of the session. Eventually, the
Nifty ended the session with gains of 1.17 percent over its
previous close.
The price action of last couple of days has resulted into a
formation of ‘Higher Highs Higher Lows’ in hourly chart,
which is a positive sign as per the Dow Theory. The ‘RSI-
smoothened’ oscillator is also showing a positive divergence
and is on the verge of giving positive crossover with its
average. Going forward, we expect this momentum to
continue towards 7241 - 7300 levels. On the flipside, 7127 -
7040 are seen as immediate support levels.
Key Levels
Support 1 - 7127
Resistance 1 - 7241
Support 2 - 7040
Resistance 2 -
7300
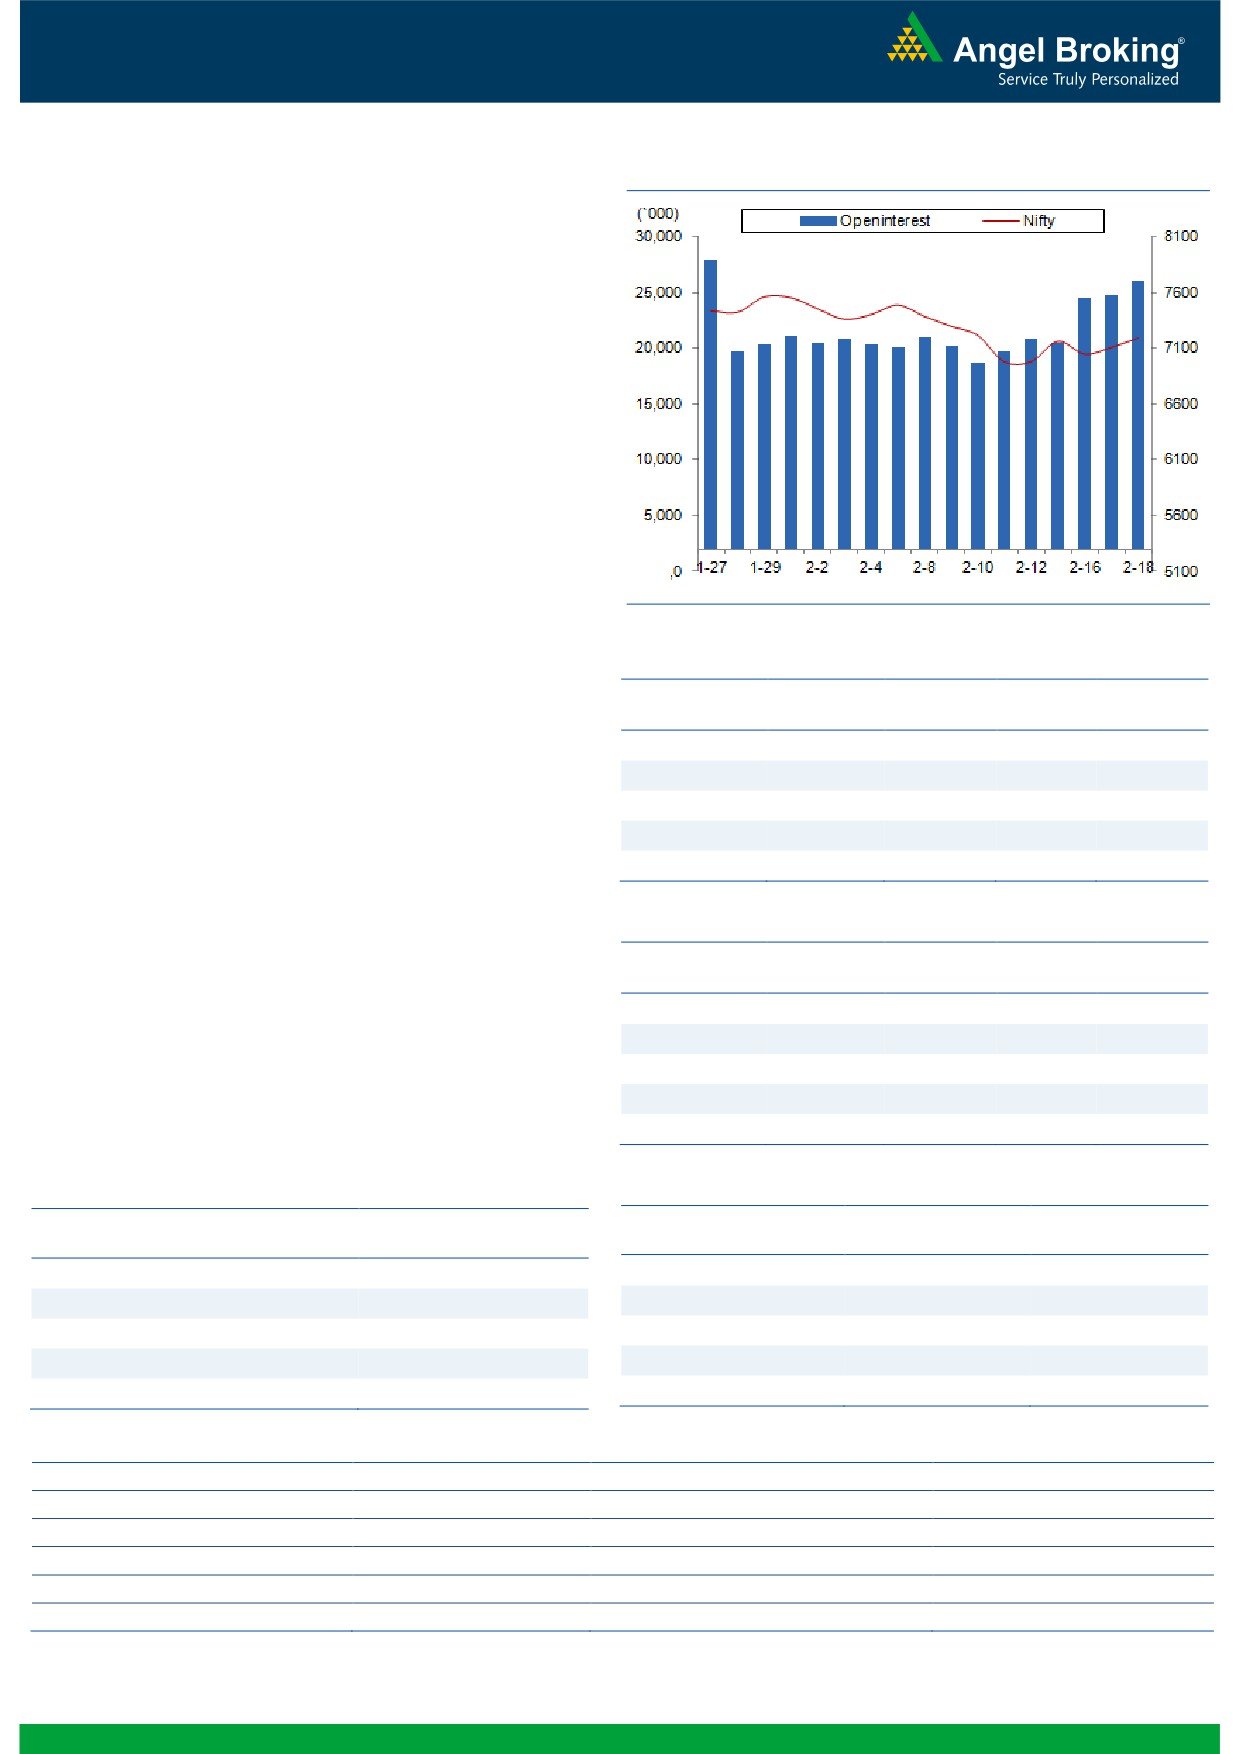
Exhibit 2: Bank Nifty Daily Chart
Bank Nifty Outlook - (14298)
The Nifty Bank index opened with an upside gap and ended
the session with gains of 1.26 percent over its previous close.
Although the morning gap was filled due to the intraday
volatility, the index rallied higher again in the concluding hour
to end the session on a positive note.
Yesterday's move was quite on our expected lines as we had
stated about the expected pullback move in the near term. In
line with our expectations, the index rallied upto our first target
of 14360 and we are expecting further positive momentum
towards our mentioned target of 14570-14600. Traders are
thus advised to continue to trade with a positive bias with
revised stoploss below 13890 on long positions. The near
term support for index is placed around 14120 and 13890;
whereas, resistances are seen in the range of 14570 - 14600.
Key Levels
Support 1 - 14120
Resistance 1 - 14570
Support 2 - 13890
Resistance 2 - 14600
1
Technical & Derivatives Report
February 19, 2016
Comments
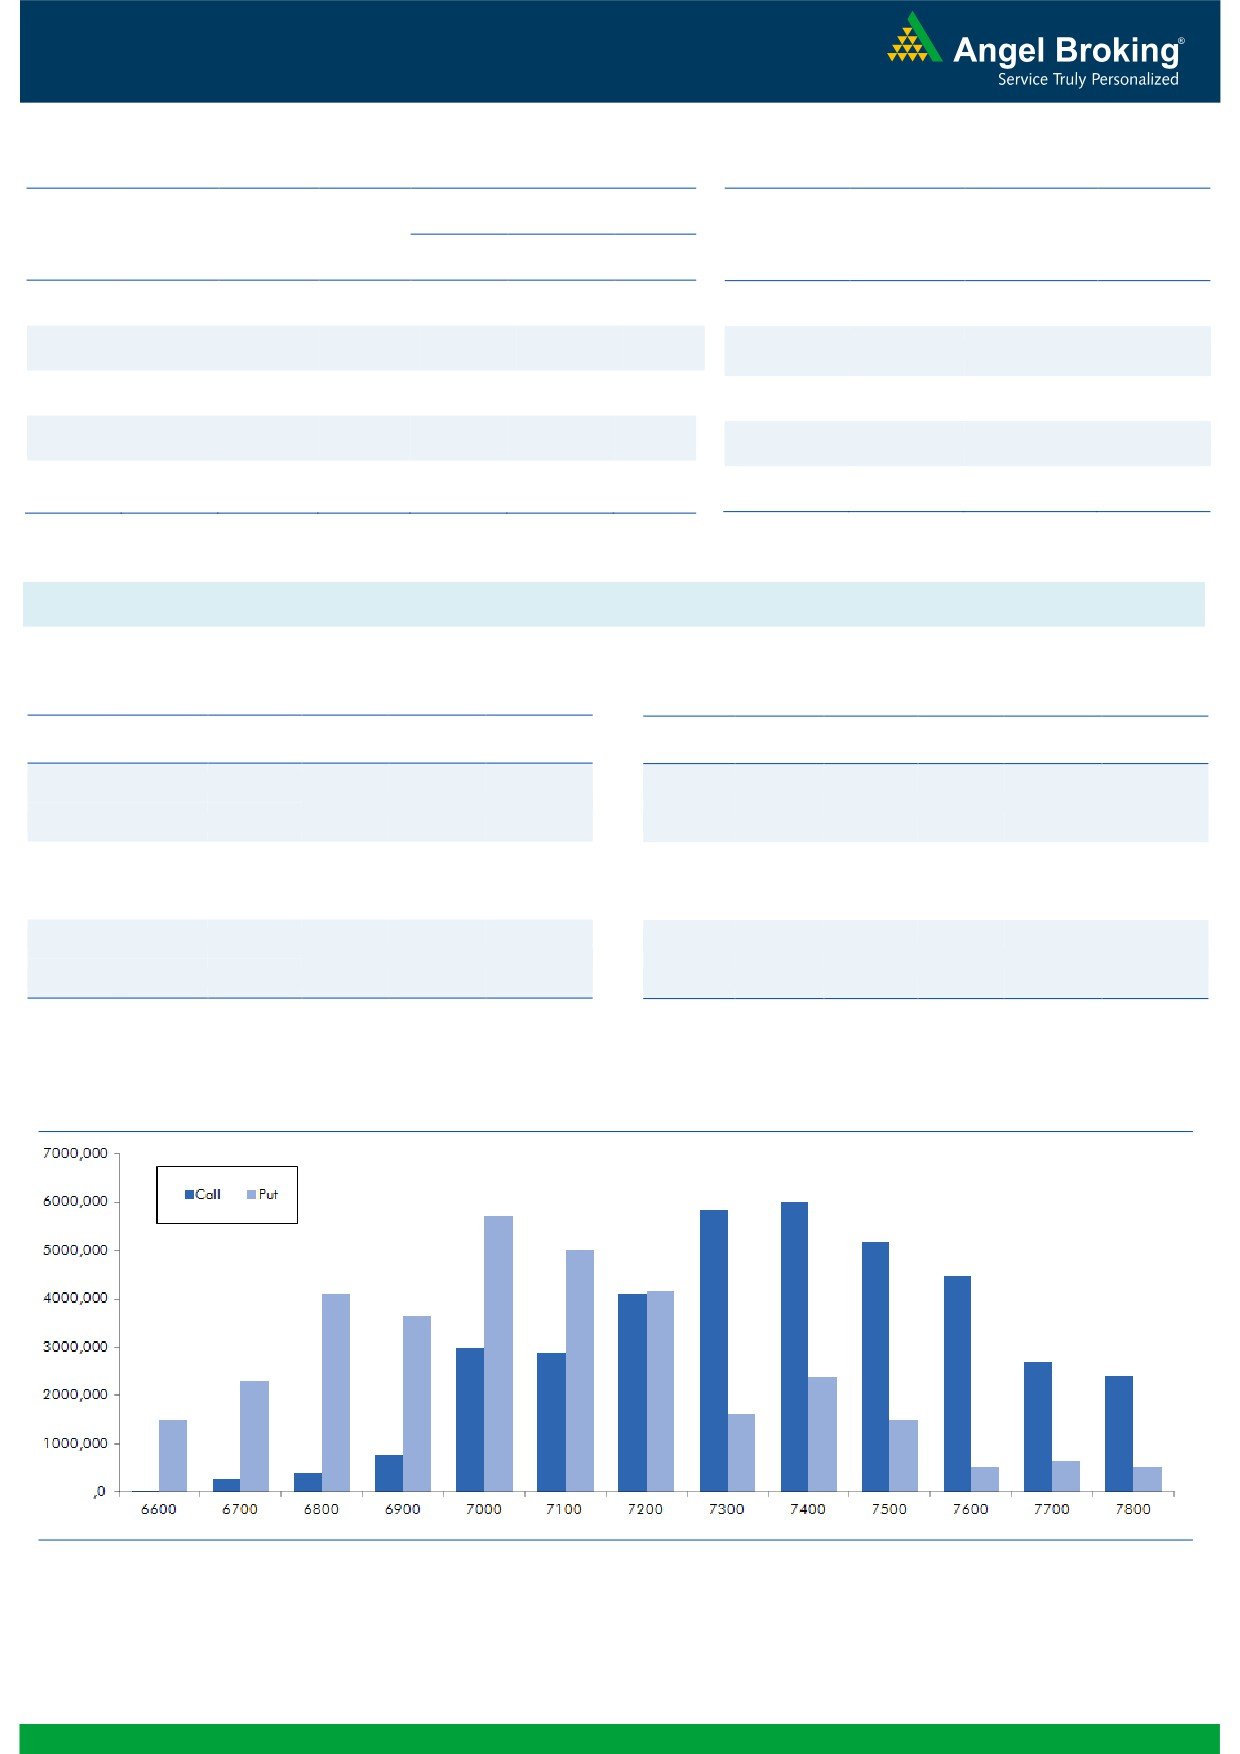
Nifty Vs OI
The Nifty futures open interest has increased by 5.30%
BankNifty futures open interest has increased by 6.57%
as market closed at 7191.75 levels.
The Nifty February future closed at a discount of 0.90
points against a premium of 12.45 points. The March
series closed at a premium of 19.05 points.
The Implied Volatility of at the money options has
decreased from 19.25% to 16.38%.
The total OI of the market is Rs. 2,46,187/- cr. and the
stock futures OI is Rs. 60,445/- cr.
Few of the liquid counters where we have seen high cost
of carry are CROMPGREAV, JPASSOCIAT, TATACHEM,
IFCI and SYNDIBANK.
Views
FIIs after long time were net buyers in cash market
OI Gainers
segment; they bought to the tune of Rs. 418 crores.
OI
PRICE
SCRIP
OI
PRICE
While in Index Futures they continue buying of Rs. 442
CHG. (%)
CHG. (%)
crores with significant rise in open interest indicating
MINDTREE
536400
18.05
1407.20
2.06
more of long formation in last trading session.
PIDILITIND
809000
16.91
620.50
3.18
In Index Options front, they sold of Rs. 774 crores with
RECLTD
12996000
12.38
156.25
-3.64
some rise in OI. In call options, 7300 strike added
NMDC
18125000
9.42
87.15
-0.46
decent OI, followed by good amount
of unwinding in
AJANTPHARM
505200
8.23
1276.50
2.99
7000-7200 call options. We believe these unwinding
were by the writers of call options who are now
OI Losers
lightening their positions expecting Nifty to show further
OI
PRICE
SCRIP
OI
PRICE
strength. While in put options, good amount of build-up
CHG. (%)
CHG. (%)
was witness in 7200 strike and looking at the FIIs stats
WOCKPHARMA
2384625
-7.09
790.80
-0.84
we believe its writing which took place. Maximum OI in
EXIDEIND
9173200
-5.93
128.55
3.67
current series is visible in 7400 call and 7000 put
JSWENERGY
6144000
-5.80
67.55
4.08
options. Seeing the above data we would suggest to
VOLTAS
4419200
-5.51
235.40
-0.15
trade with positive bias.
JUSTDIAL
3120000
-5.41
544.35
4.39
Historical Volatility
Put-Call Ratio
SCRIP
HV
SCRIP
PCR-OI
PCR-VOL
JISLJALEQS
79.51
NIFTY
0.81
0.81
HEROMOTOCO
35.10
BANKNIFTY
0.76
0.86
DRREDDY
45.14
SBIN
0.49
0.48
WIPRO
26.57
ICICIBANK
0.43
0.38
ACC
30.85
RELIANCE
0.42
0.53
Strategy Date
Symbol
Strategy
Status
February 01, 2016
BHEL
Bull Call Spread
Active
February 08, 2016
NIFTY
Short Strangle
Active
February 15, 2016
AXISBANK
Bull Call Spread
Active
2
Technical & Derivatives Report
February 19, 2016
FII Statistics for 18-February 2016
Turnover on 18-February 2016
Open Interest
No. of
Turnover
Change
Detail
Buy
Sell
Net
Instrument
Value
Change
Contracts
( in Cr. )
(%)
Contracts
(in Cr.)
(%)
INDEX
INDEX
3554.89
3112.37
442.53
336199
17383.55
15.49
392819
19704.51
-6.55
FUTURES
FUTURES
INDEX
INDEX
51654.11
52428.56
(774.45)
1494493
79061.67
0.84
5170277
273171.56
-10.61
OPTIONS
OPTIONS
STOCK
6776.69
6085.79
690.89
1184122
50403.41
0.77
STOCK
FUTURES
713751
30162.34
9.58
FUTURES
STOCK
STOCK
2904.01
2999.09
(95.07)
89795
3716.98
4.30
OPTIONS
410115
17585.36
-2.37
OPTIONS
TOTAL
64889.70
64625.80
263.89
3104609
150565.61
2.32
TOTAL
6686962
340623.77
-8.49
Nifty Spot = 7191.75
Lot Size = 75
Bull-Call Spreads
Bear-Put Spreads
Action
Strike
Price
Risk
Reward
BEP
Action
Strike
Price
Risk
Reward
BEP
Buy
7200
61.55
Buy
7200
71.80
37.65
62.35
7237.65
35.75
64.25
7164.25
Sell
7300
23.90
Sell
7100
36.05
Buy
7200
61.55
Buy
7200
71.80
53.65
146.35
7253.65
54.00
146.00
7146.00
Sell
7400
7.90
Sell
7000
17.80
Buy
7300
23.90
Buy
7100
36.05
16.00
84.00
7316.00
18.25
81.75
7081.75
Sell
7400
7.90
Sell
7000
17.80
Note: Above mentioned Bullish or Bearish Spreads in Nifty (Feb. Series) are given as an information and not as a recommendation.
Nifty Put-Call Analysis
3
Technical & Derivatives Report
February 19, 2016
Daily Pivot Levels for Nifty 50 Stocks
Scrips
S2
S1
PIVOT
R1
R2
ACC
1,219
1,241
1,253
1,275
1,287
ADANIPORTS
201
206
211
216
221
AMBUJACEM
191
193
195
197
199
ASIANPAINT
810
823
843
856
876
AXISBANK
380
389
401
410
421
BAJAJ-AUTO
2,343
2,374
2,396
2,428
2,450
BANKBARODA
129
134
140
145
151
BHARTIARTL
313
317
320
324
327
BHEL
97
100
104
108
112
BOSCHLTD
16,105
16,243
16,339
16,476
16,572
BPCL
771
781
790
799
809
CAIRN
126
128
131
134
137
CIPLA
516
520
525
529
534
COALINDIA
312
315
317
320
322
DRREDDY
2,958
3,031
3,093
3,165
3,227
GAIL
313
318
324
329
335
GRASIM
3,373
3,411
3,453
3,491
3,533
HCLTECH
820
832
839
852
859
HDFC
1,049
1,059
1,073
1,083
1,097
HDFCBANK
972
981
986
995
1,000
HEROMOTOCO
2,481
2,549
2,589
2,657
2,696
HINDALCO
66
67
69
70
72
HINDUNILVR
805
816
823
834
841
ICICIBANK
190
193
196
199
202
IDEA
103
105
107
110
112
INDUSINDBK
827
837
844
854
861
INFY
1,090
1,107
1,117
1,134
1,144
ITC
298
302
304
308
310
KOTAKBANK
619
627
632
641
646
LT
1,111
1,130
1,153
1,172
1,194
LUPIN
1,712
1,744
1,764
1,797
1,817
M&M
1,174
1,194
1,208
1,228
1,243
MARUTI
3,516
3,585
3,691
3,759
3,865
NTPC
123
125
128
130
133
ONGC
200
205
208
212
215
PNB
69
71
73
74
76
POWERGRID
137
139
140
141
143
RELIANCE
916
928
948
961
981
SBIN
153
156
160
164
167
VEDL
70
73
75
78
80
SUNPHARMA
850
860
868
879
887
TATAMOTORS
300
307
313
320
326
TATAPOWER
58
58
59
60
60
TATASTEEL
237
244
250
257
263
TCS
2,263
2,289
2,305
2,331
2,346
TECHM
416
423
429
436
442
ULTRACEMCO
2,742
2,769
2,798
2,824
2,854
WIPRO
522
532
538
547
553
YESBANK
689
702
719
731
748
ZEEL
368
375
379
386
390
4
Technical & Derivatives Report
February 19, 2016
Research Team Tel: 022 - 39357800
For Technical Queries
For Derivatives Queries
DISCLAIMER
Angel Broking Private Limited (hereinafter referred to as “Angel”) is a registered Member of National Stock Exchange of India Limited,
Bombay Stock Exchange Limited and MCX Stock Exchange Limited. It is also registered as a Depository Participant with CDSL and
Portfolio Manager with SEBI. It also has registration with AMFI as a Mutual Fund Distributor. Angel Broking Private Limited is a
registered entity with SEBI for Research Analyst in terms of SEBI (Research Analyst) Regulations, 2014 vide registration number
INH000000164. Angel or its associates has not been debarred/ suspended by SEBI or any other regulatory authority for accessing
/dealing in securities Market. Angel or its associates including its relatives/analyst do not hold any financial interest/beneficial
ownership of more than 1% in the company covered by Analyst. Angel or its associates/analyst has not received any compensation /
managed or co-managed public offering of securities of the company covered by Analyst during the past twelve months. Angel/analyst
has not served as an officer, director or employee of company covered by Analyst and has not been engaged in market making activity
of the company covered by Analyst.
This document is solely for the personal information of the recipient, and must not be singularly used as the basis of any investment
decision. Nothing in this document should be construed as investment or financial advice. Each recipient of this document should
make such investigations as they deem necessary to arrive at an independent evaluation of an investment in the securities of the
companies referred to in this document (including the merits and risks involved), and should consult their own advisors to determine
the merits and risks of such an investment.
Reports based on technical and derivative analysis center on studying charts of a stock's price movement, outstanding positions and
trading volume, as opposed to focusing on a company's fundamentals and, as such, may not match with a report on a company's
fundamentals.
The information in this document has been printed on the basis of publicly available information, internal data and other reliable
sources believed to be true, but we do not represent that it is accurate or complete and it should not be relied on as such, as this
document is for general guidance only. Angel Broking Pvt. Limited or any of its affiliates/ group companies shall not be in any way
responsible for any loss or damage that may arise to any person from any inadvertent error in the information contained in this report.
Angel Broking Pvt. Limited has not independently verified all the information contained within this document. Accordingly, we cannot
testify, nor make any representation or warranty, express or implied, to the accuracy, contents or data contained within this document.
While Angel Broking Pvt. Limited endeavors to update on a reasonable basis the information discussed in this material, there may be
regulatory, compliance, or other reasons that prevent us from doing so.
This document is being supplied to you solely for your information, and its contents, information or data may not be reproduced,
redistributed or passed on, directly or indirectly.
Neither Angel Broking Pvt. Limited, nor its directors, employees or affiliates shall be liable for any loss or damage that may arise from
or in connection with the use of this information.
Note: Please refer to the important ‘Stock Holding Disclosure' report on the Angel website (Research Section). Also, please refer to the
latest update on respective stocks for the disclosure status in respect of those stocks. Angel Broking Pvt. Limited and its affiliates may
have investment positions in the stocks recommended in this report.
5