Technical & Derivatives Report
January 19, 2016
Sensex (24188) / Nifty (7351)
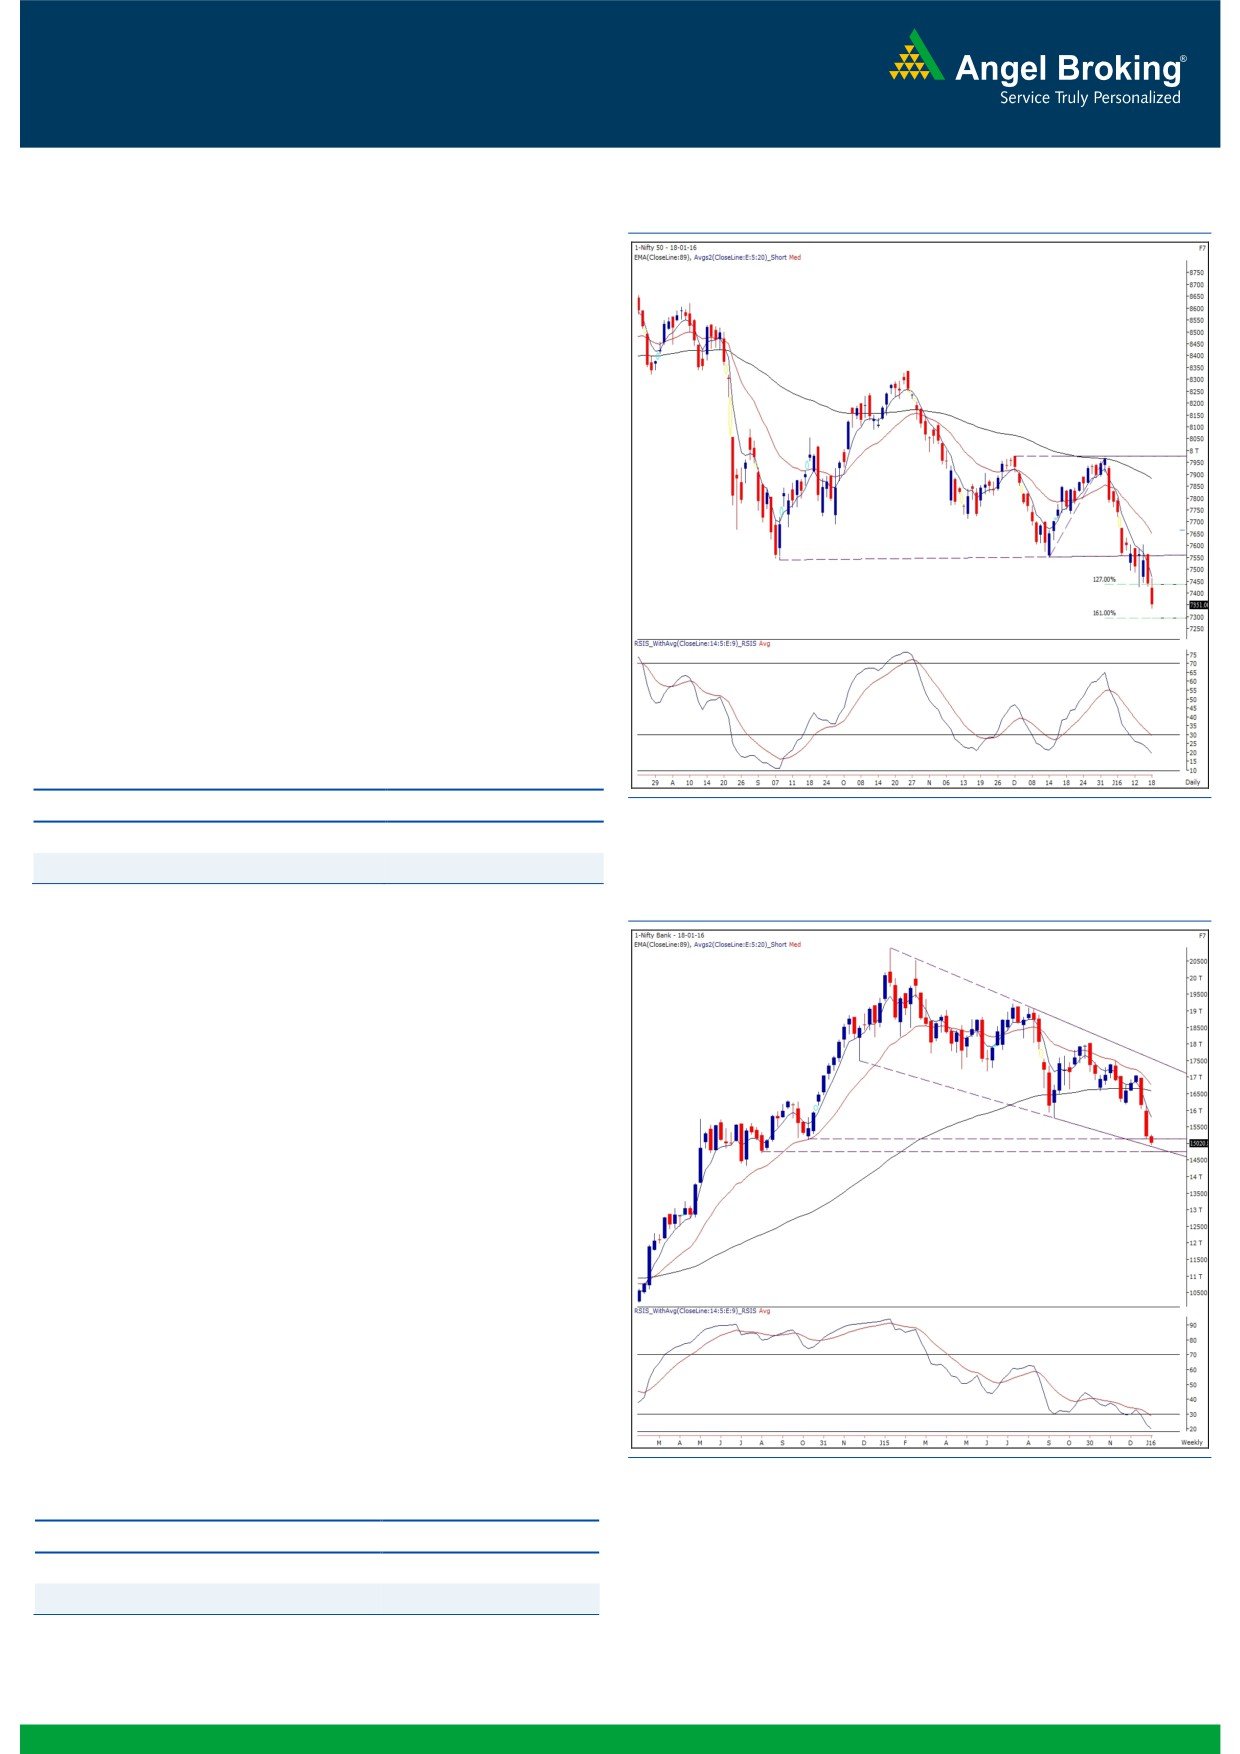
Exhibit 1: Nifty Daily Chart
Despite a sharp selloff in US bourses on Friday, first trading
day of the week opened with a marginal downside gap, which
was slightly annoying for most of the bears who had carry
forwarded their positions. However, after a consolidation of
nearly four hours, we witnessed a sharp decline in the
penultimate hour to end the session well below the 7400
mark. In-line with our expectation, the Nifty kept on
descending towards our mentioned levels of 7340 - 7300
since last few sessions. This support zone coincides with the
lower end of the 10-months ‘Falling Channel’ as well as the
161% Fibonacci retracement level of the recent up move from
7551.05 to 7972.55. Hence, it would be advisable to cover
short positions at the mentioned support zone and wait for
further market developments. Considering the ongoing
volatility and a lot of uncertainty on the global front, traders
are advised to stay light on positions and keep tracking these
support levels on a closing basis. On the flipside, 7440 -
7500 are now seen as immediate hurdles for the bulls.
Key Levels
Support 1 - 7340
Resistance 1 - 7440
Support 2 - 7300
Resistance 2 - 7500
Exhibit 2: Bank Nifty Weekly Chart
Bank Nifty Outlook - (15021)
Yesterday, the banking index opened with a marginal loss of
nearly 40 points and moved lower in the initial hour of the
trading. However, we witnessed a sharp rally in the beaten
down banking counters and as a result, the Bank Nifty
rebounded nearly
2 percent from early morning lows.
However, similar to the previous session, the intraday recovery
in stocks once again got sold into during the concluding hour
of the session. As a result, the banking index ended the
session with a loss of 1.22 percent over its previous close.
After the strident fall of more than 2000 points in 11 trading
sessions, we are yet to see any reversal sign on charts.
However, having said that, similar to the Nifty, we are
observing a strong support zone around 15000 - 14700
levels, which is the lower end of the ‘Falling Channel’ pattern
on the weekly chart. Any reversal pattern around this support
zone may lead to some recovery in the index. On the higher
side, resistances are placed at 15270 and 15460 levels.
Key Levels
Support 1 - 15000
Resistance 1 - 15270
Support 2 - 14700
Resistance 2 - 15460
1
Technical & Derivatives Report
January 19, 2016
Comments
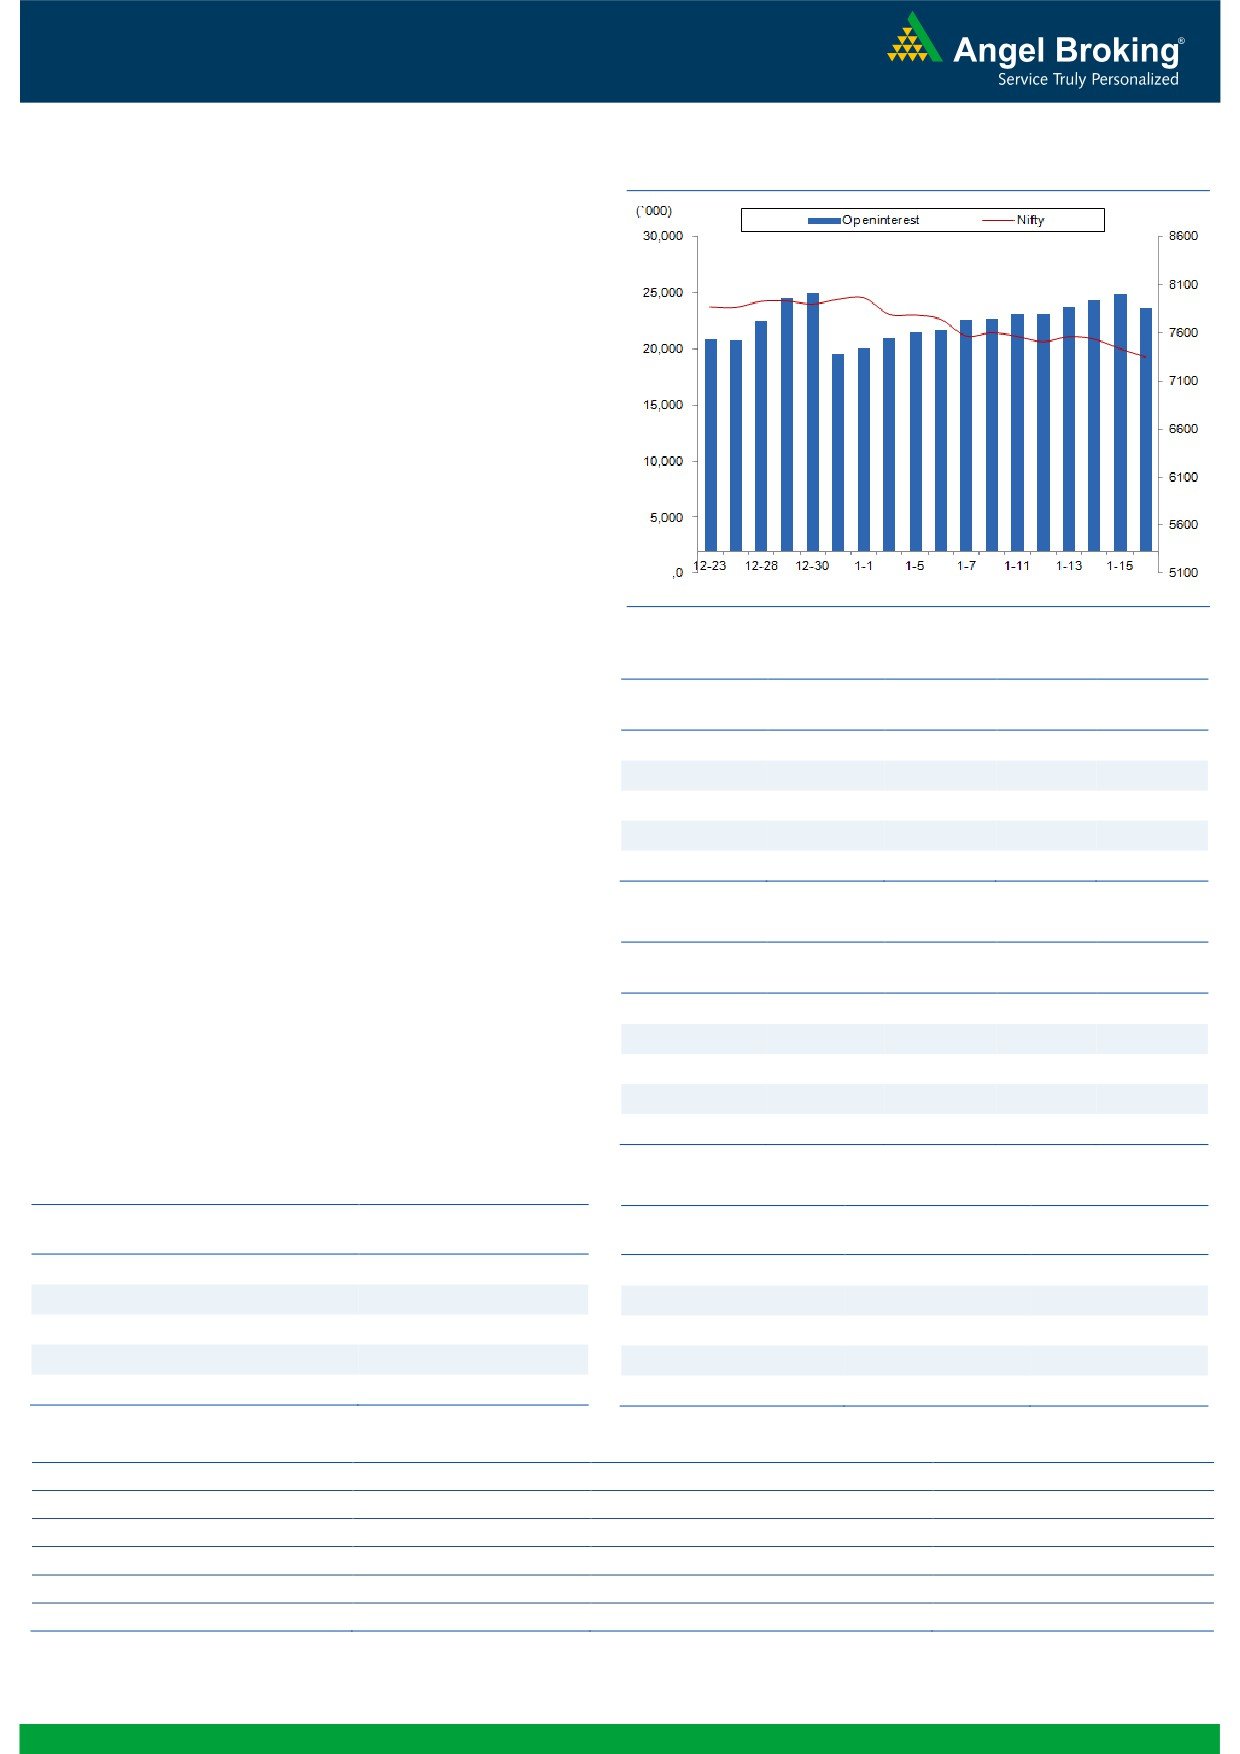
Nifty Vs OI
The Nifty futures open interest has decreased by 4.81%
BankNifty futures open interest has increased by 0.30%
as market closed at 7351.00 levels.
The Nifty January future closed at a premium of 21.25
points against a premium of 8.45 points. The February
series closed at a premium of 40.25 points.
The Implied Volatility of at the money options has
increased from 18.31% to 18.43 %.
The total OI of the market is Rs. 2,47,421/- cr. and the
stock futures OI is Rs. 60,358/- cr.
Few of the liquid counters where we have seen high cost
of carry are JPASSOCIAT, GMRINFRA, JINDALSTEL,
HINDPETRO and POWERGRID.
OI Gainers
Views
OI
PRICE
In equity segment, FIIs were net sellers to the tune of Rs.
SCRIP
OI
PRICE
CHG. (%)
CHG. (%)
1204 crores. In Index Futures, they were net buyers of
ARVIND
4120800
12.17
300.60
-5.83
worth Rs. 958 with good amount of rise in OI, indicating
SRF
925600
9.88
1145.50
-5.74
formation of long positions in last trading session.
VOLTAS
5844800
7.60
270.40
-3.43
In Index Options front, they sold of Rs. 530 crores with
GODREJCP
141600
6.63
1211.10
-2.71
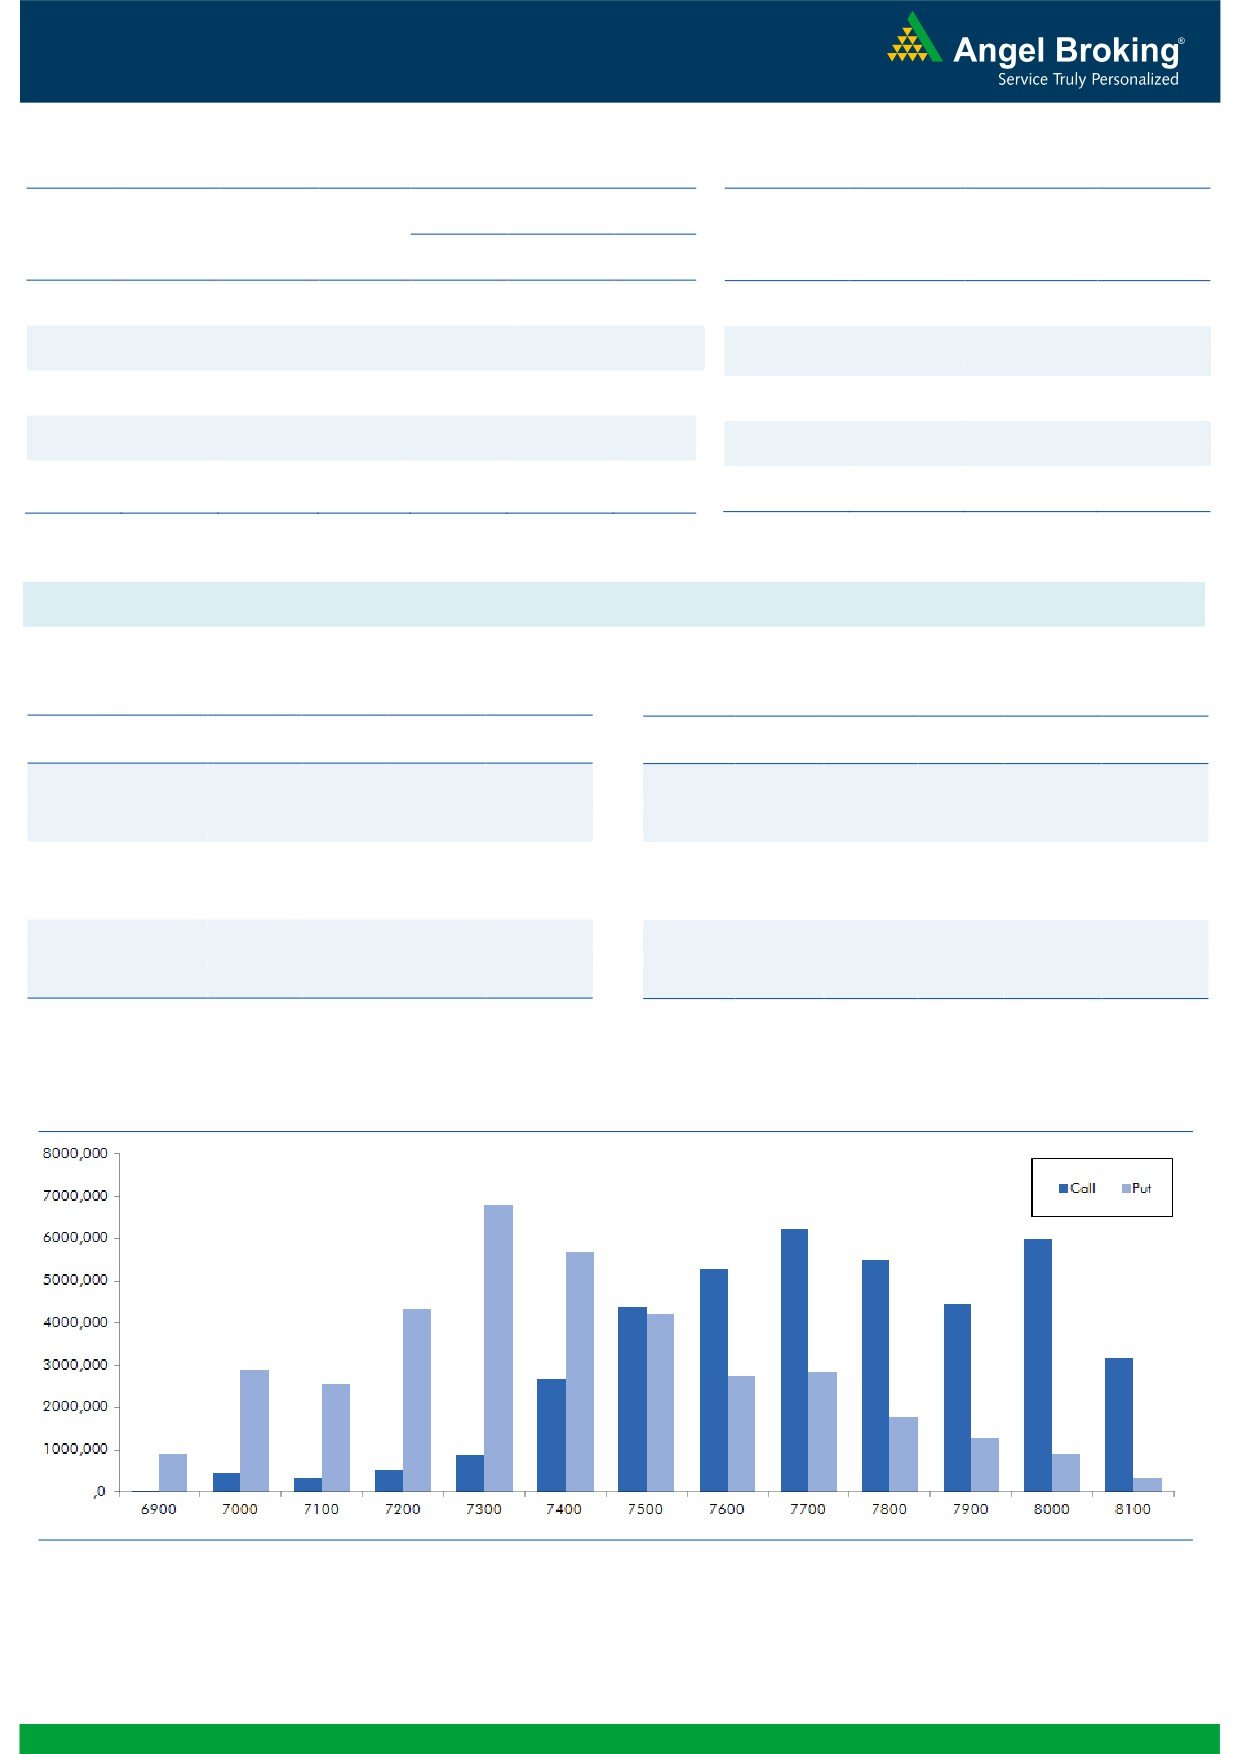
rise in open interest. In call options, 7400-7600 strikes
ASIANPAINT
5928600
6.11
852.95
-3.39
added decent OI, followed by some unwinding in 7700
and 7900 call options. Wheareas, in put options, 7200
OI Losers
put option added good amount of positions; while,
OI
PRICE
decent unwinding was witness in 7500 strike price.
SCRIP
OI
PRICE
CHG. (%)
CHG. (%)
Maximum build-up in current series is visible in 7700 call
WOCKPHARMA
3383625
-11.67
1209.35
-6.12
and 7300 put options. Yesterday, despite Nifty corrected
BHEL
24780000
-11.63
142.50
4.36
sharply, FIIs bought in index Futures. 7300 put option
IGL
2212100
-10.02
552.85
-0.07
has highest OI and this is the immediate support for
RELCAPITAL
11145000
-8.96
346.80
-7.06
market, Avoid forming short.
PNB
35964000
-8.82
90.85
0.44
Historical Volatility
Put-Call Ratio
SCRIP
HV
SCRIP
PCR-OI
PCR-VOL
HINDPETRO
46.09
NIFTY
0.80
0.72
GLENMARK
55.01
BANKNIFTY
0.66
0.65
MCLEODRUSS
48.50
SBIN
0.32
0.39
RELIANCE
39.77
INFY
0.95
0.78
JETAIRWAYS
81.18
RELIANCE
0.46
0.57
Strategy Date
Symbol
Strategy
Status
January 04, 2016
SBIN
Ratio Bear Put Spread
Loss booked on Jan 15, 2016
January 11, 2016
TCS
Short Strangle
Profit booked on Jan 18, 2016
January 18, 2016
HINDUNILVR
Short Strangle
Active
2
Technical & Derivatives Report
January 19, 2016
FII Statistics for 18-January 2015
Turnover on 18-January 2015
Open Interest
No. of
Turnover
Change
Detail
Buy
Sell
Net
Instrument
Value
Change
Contracts
( in Cr. )
(%)
Contracts
(in Cr.)
(%)
INDEX
INDEX
2370.24
1412.13
958.11
312462
16541.52
3.81
363562
18752.87
11.88
FUTURES
FUTURES
INDEX
INDEX
43058.16
43588.73
(530.58)
1431798
77447.82
3.75
4419641
243961.20
22.97
OPTIONS
OPTIONS
STOCK
5026.41
5510.29
(483.88)
1107274
49028.57
0.87
STOCK
FUTURES
665252
30532.87
6.90
FUTURES
STOCK
STOCK
4573.21
4652.74
(79.53)
93054
4199.92
5.33
OPTIONS
424634
21030.54
4.26
OPTIONS
TOTAL
55028.02
55163.89
(135.87)
2944588
147217.83
2.70
TOTAL
5873089
314277.48
19.09
Nifty Spot = 7351.00
Lot Size = 75
Bull-Call Spreads
Bear-Put Spreads
Action
Strike
Price
Risk
Reward
BEP
Action
Strike
Price
Risk
Reward
BEP
Buy
7400
75.30
Buy
7300
65.65
37.20
62.80
7437.20
27.05
72.95
7272.95
Sell
7500
38.10
Sell
7200
38.60
Buy
7400
75.30
Buy
7300
65.65
58.30
141.70
7458.30
43.15
156.85
7256.85
Sell
7600
17.00
Sell
7100
22.50
Buy
7500
38.10
Buy
7200
38.60
21.10
78.90
7521.10
16.10
83.90
7183.90
Sell
7600
17.00
Sell
7100
22.50
Note: Above mentioned Bullish or Bearish Spreads in Nifty (Jan. Series) are given as an information and not as a recommendation.
Nifty Put-Call Analysis
3
Technical & Derivatives Report
January 19, 2016
Daily Pivot Levels for Nifty 50 Stocks
Scrips
S2
S1
PIVOT
R1
R2
ACC
1,197
1,211
1,226
1,239
1,255
ADANIPORTS
202
211
218
227
234
AMBUJACEM
186
189
192
194
197
ASIANPAINT
810
830
862
882
913
AXISBANK
358
366
374
382
391
BAJAJ-AUTO
2,176
2,213
2,274
2,311
2,372
BANKBARODA
120
123
127
130
134
BHARTIARTL
286
293
301
308
316
BHEL
124
133
141
149
157
BOSCHLTD
17,486
17,665
17,879
18,058
18,272
BPCL
859
878
908
927
958
CAIRN
105
108
113
116
121
CIPLA
574
582
595
604
617
COALINDIA
301
306
314
320
328
DRREDDY
2,805
2,840
2,895
2,930
2,986
GAIL
318
329
340
351
362
GRASIM
3,445
3,473
3,509
3,537
3,572
HCLTECH
820
831
842
854
865
HDFC
1,106
1,119
1,138
1,151
1,171
HDFCBANK
1,009
1,017
1,029
1,038
1,050
HEROMOTOCO
2,348
2,392
2,421
2,465
2,494
HINDALCO
68
70
72
73
75
HINDUNILVR
786
798
807
819
829
ICICIBANK
212
218
223
229
234
IDEA
108
110
112
113
115
INDUSINDBK
872
885
908
921
944
INFY
1,107
1,119
1,141
1,153
1,175
ITC
310
313
316
318
321
KOTAKBANK
649
658
672
682
696
LT
1,053
1,068
1,089
1,104
1,125
LUPIN
1,651
1,677
1,706
1,731
1,760
M&M
1,139
1,152
1,170
1,183
1,201
MARUTI
4,116
4,176
4,233
4,293
4,349
NTPC
130
132
135
138
141
ONGC
208
211
215
218
221
PNB
86
88
91
94
97
POWERGRID
135
137
139
140
143
RELIANCE
960
989
1,036
1,065
1,112
SBIN
174
177
183
186
192
VEDL
64
66
70
73
77
SUNPHARMA
763
774
786
797
808
TATAMOTORS
330
335
339
344
348
TATAPOWER
60
61
62
63
64
TATASTEEL
216
226
235
245
254
TCS
2,245
2,261
2,277
2,293
2,308
TECHM
507
512
520
525
532
ULTRACEMCO
2,552
2,597
2,623
2,668
2,694
WIPRO
523
535
543
555
563
YESBANK
641
648
659
667
678
ZEEL
368
381
391
404
414
4
Technical & Derivatives Report
January 19, 2016
Research Team Tel: 022 - 39357800
For Technical Queries
For Derivatives Queries
DISCLAIMER
Angel Broking Private Limited (hereinafter referred to as “Angel”) is a registered Member of National Stock Exchange of India Limited,
Bombay Stock Exchange Limited and MCX Stock Exchange Limited. It is also registered as a Depository Participant with CDSL and
Portfolio Manager with SEBI. It also has registration with AMFI as a Mutual Fund Distributor. Angel Broking Private Limited is a
registered entity with SEBI for Research Analyst in terms of SEBI (Research Analyst) Regulations, 2014 vide registration number
INH000000164. Angel or its associates has not been debarred/ suspended by SEBI or any other regulatory authority for accessing
/dealing in securities Market. Angel or its associates including its relatives/analyst do not hold any financial interest/beneficial
ownership of more than 1% in the company covered by Analyst. Angel or its associates/analyst has not received any compensation /
managed or co-managed public offering of securities of the company covered by Analyst during the past twelve months. Angel/analyst
has not served as an officer, director or employee of company covered by Analyst and has not been engaged in market making activity
of the company covered by Analyst.
This document is solely for the personal information of the recipient, and must not be singularly used as the basis of any investment
decision. Nothing in this document should be construed as investment or financial advice. Each recipient of this document should
make such investigations as they deem necessary to arrive at an independent evaluation of an investment in the securities of the
companies referred to in this document (including the merits and risks involved), and should consult their own advisors to determine
the merits and risks of such an investment.
Reports based on technical and derivative analysis center on studying charts of a stock's price movement, outstanding positions and
trading volume, as opposed to focusing on a company's fundamentals and, as such, may not match with a report on a company's
fundamentals.
The information in this document has been printed on the basis of publicly available information, internal data and other reliable
sources believed to be true, but we do not represent that it is accurate or complete and it should not be relied on as such, as this
document is for general guidance only. Angel Broking Pvt. Limited or any of its affiliates/ group companies shall not be in any way
responsible for any loss or damage that may arise to any person from any inadvertent error in the information contained in this report.
Angel Broking Pvt. Limited has not independently verified all the information contained within this document. Accordingly, we cannot
testify, nor make any representation or warranty, express or implied, to the accuracy, contents or data contained within this document.
While Angel Broking Pvt. Limited endeavors to update on a reasonable basis the information discussed in this material, there may be
regulatory, compliance, or other reasons that prevent us from doing so.
This document is being supplied to you solely for your information, and its contents, information or data may not be reproduced,
redistributed or passed on, directly or indirectly.
Neither Angel Broking Pvt. Limited, nor its directors, employees or affiliates shall be liable for any loss or damage that may arise from
or in connection with the use of this information.
Note: Please refer to the important ‘Stock Holding Disclosure' report on the Angel website (Research Section). Also, please refer to the
latest update on respective stocks for the disclosure status in respect of those stocks. Angel Broking Pvt. Limited and its affiliates may
have investment positions in the stocks recommended in this report.
5