Technical & Derivatives Report
October 18, 2016
Sensex (27530) / Nifty (8520)
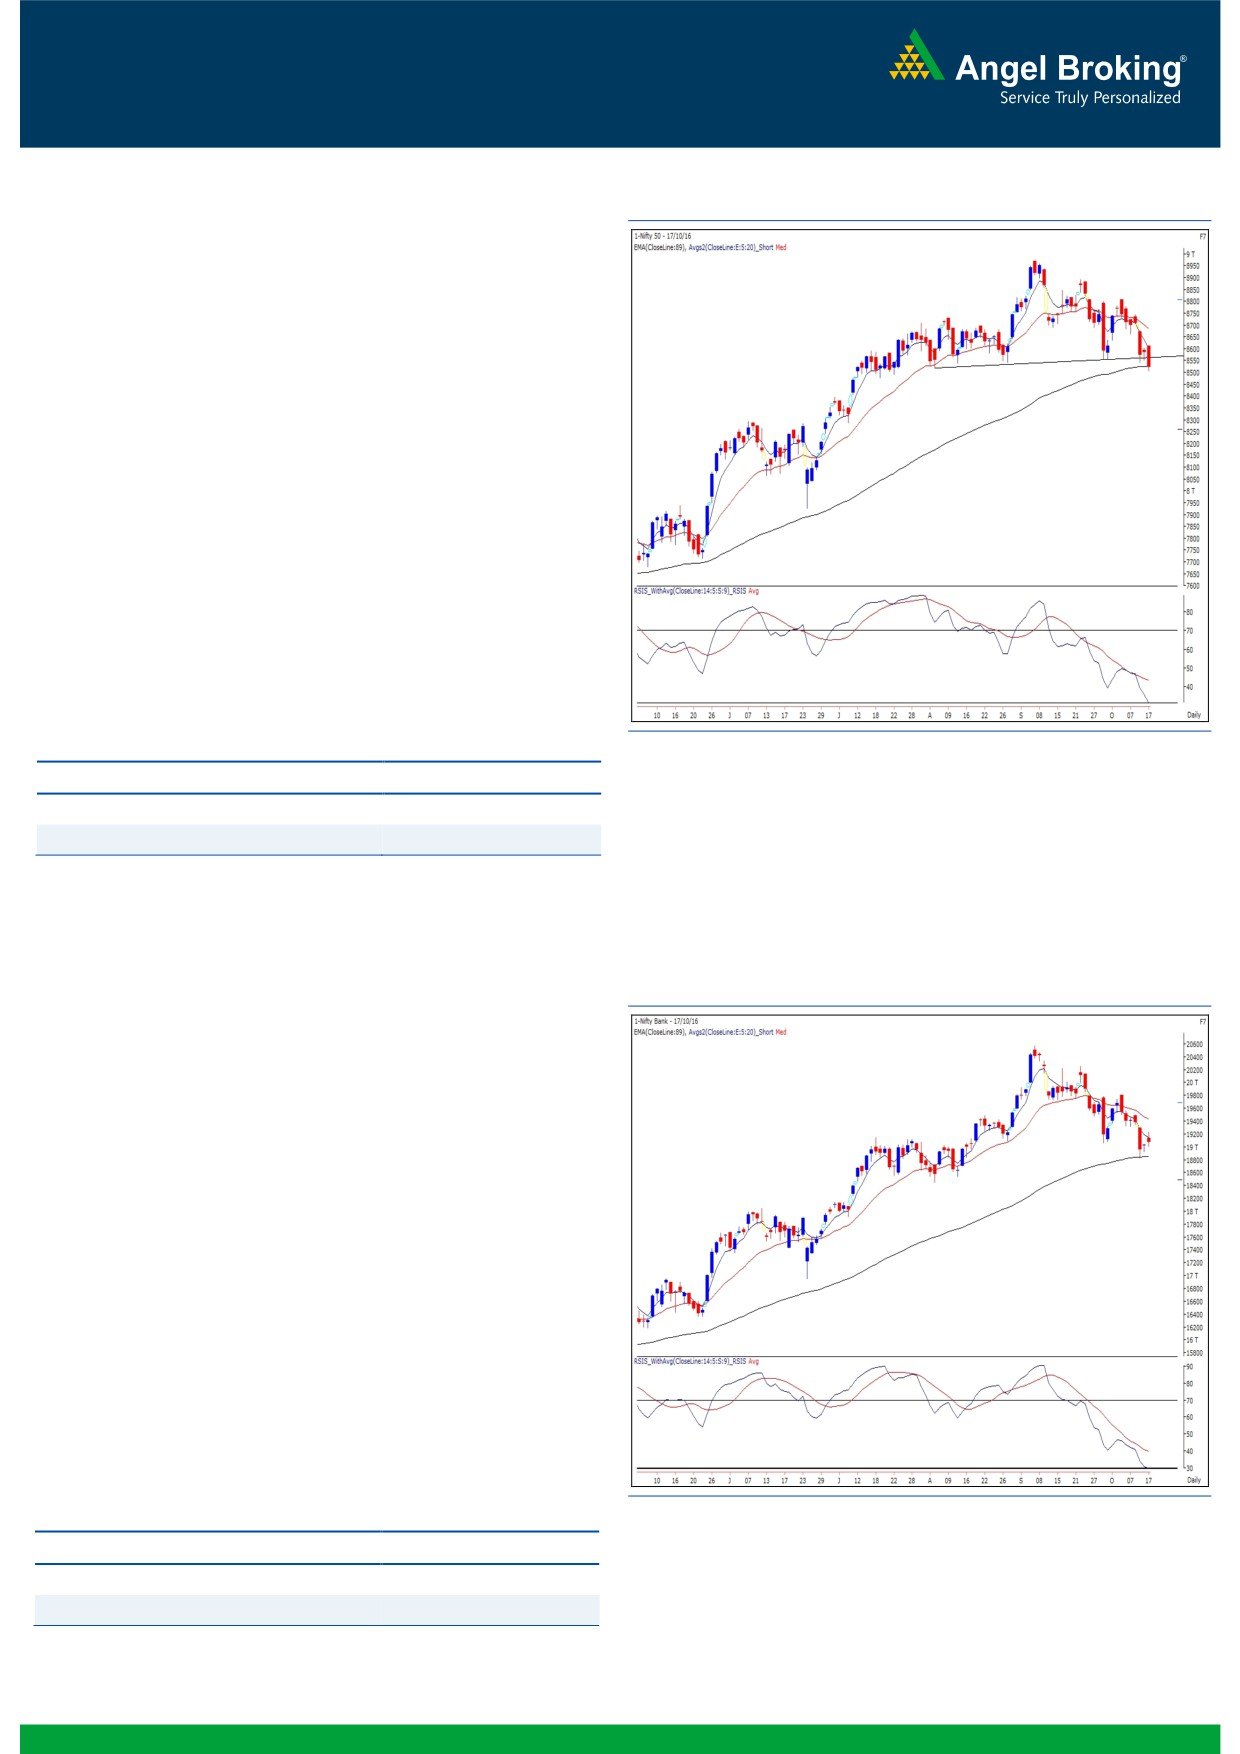
Exhibit 1: Nifty Daily Chart
Although the Nifty index opened marginally positive yesterday,
the bears gained control for the entire session and the index lost
0.73 percent over its previous session's close.
Post yesterday's corrective move, the Nifty has closed in the vicinity
of the support range of 8540-8518. The bears' dominance over
the bulls in spite of positive opening yesterday clearly indicates
their dominance over the participants who have been anticipating
reversal around the mentioned support. However, as we had
highlighted in our weekly report, several technical evidences such
as the ‘Negative Directional Indicator (-DI)’ cutting the ‘Positive
Directional Indicator (+DI)’ from southwards in ADX (14) on
weekly chart and the follow-up correction post formation of
'Shooting Star' on weekly chart, indicates higher probability of the
index sneaking below the mentioned support zone. Hence, we
continue to advise traders to remain cautious as an immediate
correction towards 8400 cannot be ruled out.
Key Levels
Support 1 - 8480
Resistance 1 - 8580
Support 2 - 8450
Resistance 2 - 8640
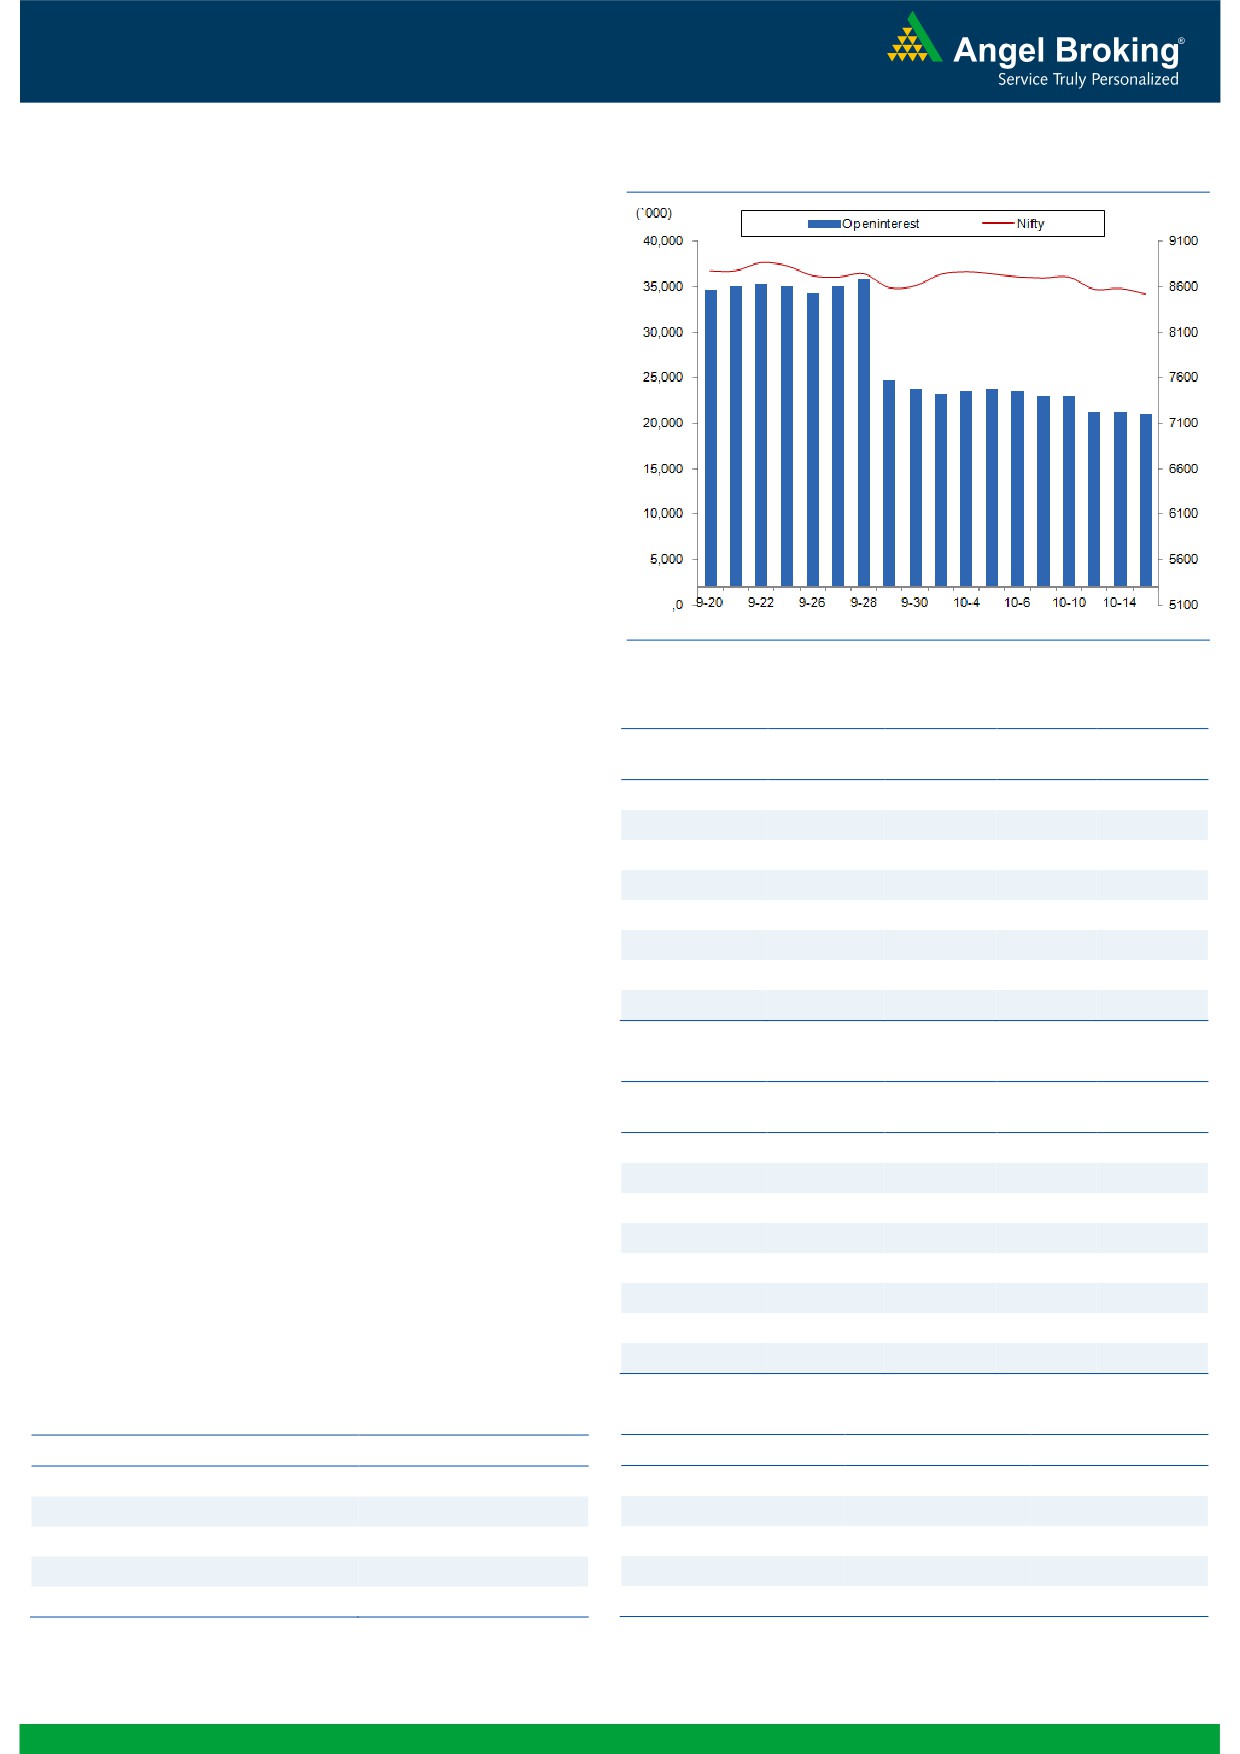
Exhibit 2: Nifty Bank Daily Chart
Nifty Bank Outlook - (19070)
The Nifty Bank index opened on a positive note yesterday and
outperformed the benchmark Nifty index to end the session with
marginal gain of 0.26 percent.
Yesterday's outperformance in the Nifty Bank index was mainly
due to the heavyweight stock ICICI Bank which gained over 7
percent post a gap up opening. As highlighted in our earlier
reports, the Nifty Bank index is trading near the support zone of
18795-18841 where multiple supports are seen. However, in
spite of the outperformance yesterday, the index has not shown
any reversal signs. A pullback move, if any, in near term is likely
to face resistance at higher levels and hence, traders are advised
to stay light on positions and not to trade aggressively with
positive bias. The intraday support for the index is placed in the
range of 18840-18795 whereas resistances are seen in range of
19290-19361.
Key Levels
Support 1 - 18840
Resistance 1 - 19290
Support 2 - 18795
Resistance 2 - 19361
1
Technical & Derivatives Report
October 18, 2016
Comments
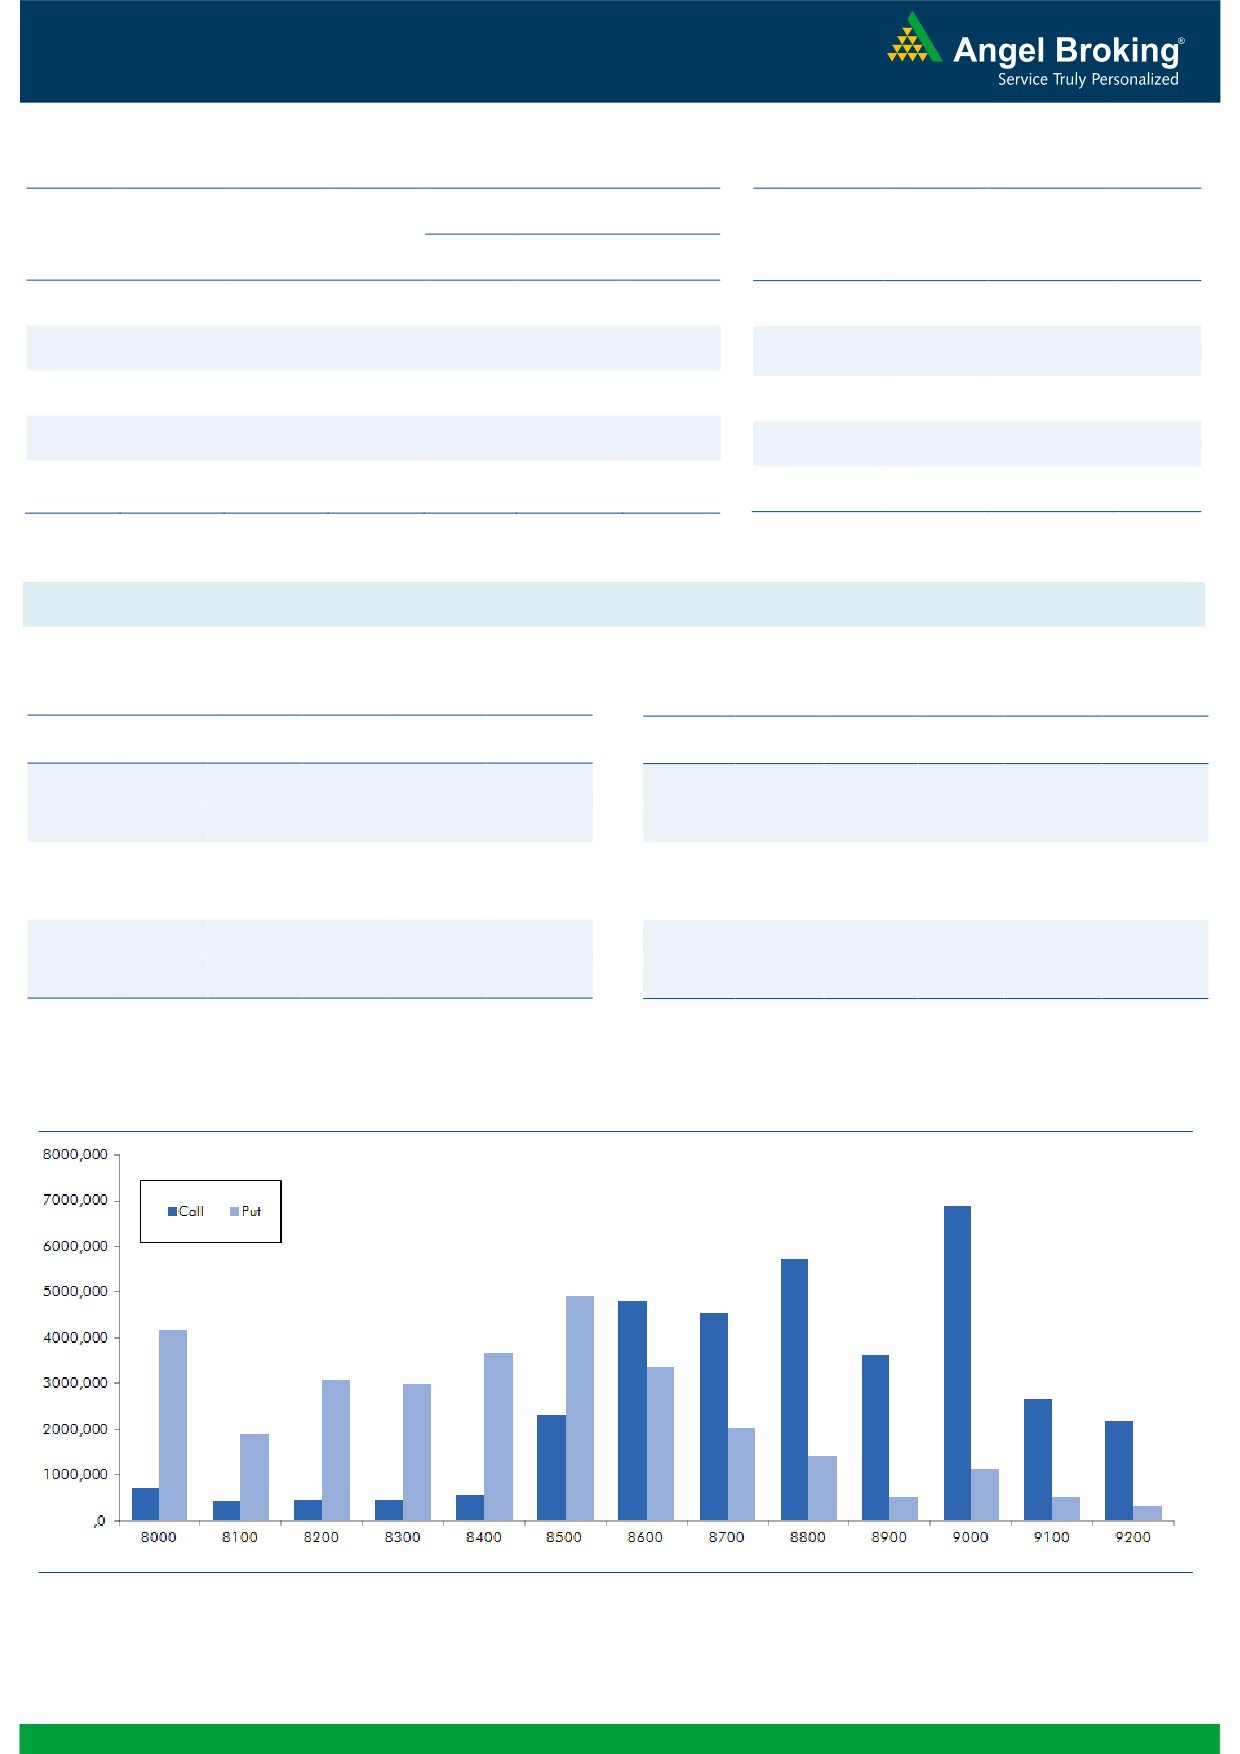
Nifty Vs OI
The Nifty futures open interest has decreased by 1.47%
BankNifty futures open interest has decreased by 7.04%
as market closed at 8520.40 levels.
The Nifty October future closed with a premium of 3.50
against the premium of 21.70 points in last trading
session. The November series closed at a premium of
42.05 points.
The Implied Volatility of at the money options has
increased from 13.16% to 14.78%. At the same time, the
PCR-OI of Nifty has decreased from 0.93 to 0.87 levels.
The total OI of the market is Rs. 2,74,340/- cr. and the
stock futures OI is Rs. 78,109/- cr.
Few of the liquid counters where we have seen high cost
of carry are NHPC, GRANULES, ZEEL, JPASSOCIAT and
TORNTPOWER.
Views
Yesterday, FIIs were net sellers in both cash market
OI Gainers
segment and in Index Futures. They sold equities to the
OI
PRICE
SCRIP
OI
PRICE
CHG. (%)
CHG. (%)
tune of Rs. 946 crores. While, in index futures they were
DCBBANK
2542500
32.32
126.35
3.06
net sellers of Rs. 1032 crores with significant fall in open
ZEEL
10598900
29.68
505.10
-4.83
interest, suggesting continuation of long unwinding in
IOC
15810000
29.33
641.70
-0.31
last trading sessions.
www.angelbroking.com
NIITTECH
1223000
15.49
411.60
-6.99
On Index Options front, FIIs sold of worth Rs. 207 crores
HAVELLS
3572000
15.15
424.45
-4.37
with rise in OI. In call options, 8500, 8600 and 8800
UNIONBANK
14412000
14.38
137.85
-2.82
strikes were quite active and they also added huge open
HEROMOTOCO
1186000
12.84
3404.55
-2.53
interest. While, in put options, we hardly saw any strike
price adding relevant open interest. However, good
DABUR
5480000
10.32
272.95
-2.76
amount of unwinding was visible in 8500 and 8600 put
options. Maximum OI in October series is placed at
OI Losers
9000 call and 8500 put options.
OI
PRICE
SCRIP
OI
PRICE
From past few trading sessions, we witness huge amount
CHG. (%)
CHG. (%)
ICICIBANK
62070000
-15.87
258.70
6.50
of profit-booking in Index Futures by FIIs. While, out of
GAIL
6831000
-8.52
428.50
-0.67
the money put options, 8000-8200 strikes are also quite
KOTAKBANK
9868000
-5.55
769.45
-1.67
active and FIIs have been buying these puts. We also
MRF
42585
-5.34
49955.60
-4.89
witness writing in 8700 and 8800 call options, indicating
wall of resistance for Nifty. Thus, looking at the above
BEL
1062000
-5.07
1267.40
-0.38
data, we believe Nifty may remain under pressure, avoid
BAJFINANCE
6141250
-4.58
1081.65
1.30
longs. Traders can buy 8500 put options to trade for
SBIN
73080000
-4.43
253.15
0.32
current expiry.
SRF
461500
-4.35
1843.80
-1.92
Historical Volatility
Put-Call Ratio
SCRIP
HV
SCRIP
PCR-OI
PCR-VOL
ICICIBANK
45.92
NIFTY
0.87
0.84
NIITTECH
54.23
BANKNIFTY
0.86
0.82
M&MFIN
48.88
INFY
0.47
0.47
HAVELLS
37.16
RELIANCE
0.40
0.41
CEATLTD
58.85
ICICIBANK
0.73
0.45
2
Technical & Derivatives Report
October 18, 2016
FII Statistics for 17, October 2016
Turnover on 17, October 2016
Open Interest
No. of
Turnover
Change
Detail
Buy
Sell
Net
Instrument
Value
Change
Contracts
( in Cr. )
(%)
Contracts
(in Cr.)
(%)
INDEX
INDEX
1939.60
2972.06
(1032.45)
214565
14166.56
(8.37)
182944
16996.11
37.00
FUTURES
FUTURES
INDEX
INDEX
39955.86
40162.37
(206.52)
1093568
71560.15
1.88
2836432
276651.19
41.49
OPTIONS
OPTIONS
STOCK
8029.49
6928.34
1101.14
877381
56905.35
0.04
STOCK
FUTURES
561225
40718.81
5.31
FUTURES
STOCK
STOCK
5366.26
5519.02
(152.75)
105308
6923.38
5.00
OPTIONS
532985
29199.00
-14.80
OPTIONS
TOTAL
55291.21
55581.79
(290.58)
2290822
149555.44
0.26
TOTAL
4113586
363565.20
29.44
Nifty Spot = 8520.40
Lot Size = 75
Bull-Call Spreads
Bear-Put Spreads
Action
Strike
Price
Risk
Reward
BEP
Action
Strike
Price
Risk
Reward
BEP
Buy
8500
95.60
Buy
8500
72.15
48.10
51.90
8548.10
31.15
68.85
8468.85
Sell
8600
47.50
Sell
8400
41.00
Buy
8500
95.60
Buy
8500
72.15
76.40
123.60
8576.40
49.30
150.70
8450.70
Sell
8700
19.20
Sell
8300
22.85
Buy
8600
47.50
Buy
8400
41.00
28.30
71.70
8628.30
18.15
81.85
8381.85
Sell
8700
19.20
Sell
8300
22.85
Note: Above mentioned Bullish or Bearish Spreads in Nifty (October Series) are given as an information and not as a recommendation.
Nifty Put-Call Analysis
3
Technical & Derivatives Report
October 18, 2016
Daily Pivot Levels for Nifty Constituents
Scrips
S2
S1
PIVOT
R1
R2
ACC
1,569
1,587
1,616
1,634
1,663
ADANIPORTS
246
248
252
254
257
AMBUJACEM
240
243
248
252
257
ASIANPAINT
1,160
1,171
1,190
1,201
1,220
AUROPHARMA
791
800
815
824
839
AXISBANK
507
513
523
530
540
BAJAJ-AUTO
2,686
2,720
2,777
2,811
2,869
BANKBARODA
147
149
152
154
158
BHEL
128
130
132
134
136
BPCL
645
652
663
671
682
BHARTIARTL
292
296
301
306
311
INFRATEL
350
355
360
365
371
BOSCH
21,544
21,847
22,364
22,667
23,184
CIPLA
579
582
587
591
596
COALINDIA
306
308
312
315
319
DRREDDY
2,988
3,009
3,032
3,053
3,076
EICHERMOT
23,917
24,282
24,930
25,295
25,943
GAIL
417
422
430
436
443
GRASIM
947
959
979
991
1,012
HCLTECH
795
802
810
817
825
HDFCBANK
1,212
1,225
1,246
1,258
1,279
HDFC
1,282
1,292
1,307
1,318
1,333
HEROMOTOCO
3,329
3,367
3,429
3,467
3,528
HINDALCO
146
149
152
154
158
HINDUNILVR
834
842
846
854
858
ICICIBANK
240
250
255
264
269
IDEA
70
71
73
74
77
INDUSINDBK
1,189
1,199
1,210
1,220
1,231
INFY
1,003
1,013
1,027
1,037
1,052
ITC
237
239
240
242
244
KOTAKBANK
753
761
772
780
791
LT
1,419
1,434
1,455
1,470
1,491
LUPIN
1,421
1,434
1,454
1,467
1,487
M&M
1,275
1,294
1,327
1,346
1,380
MARUTI
5,500
5,549
5,624
5,674
5,749
NTPC
145
146
147
149
150
ONGC
274
276
278
280
282
POWERGRID
173
175
176
178
179
RELIANCE
1,045
1,053
1,067
1,075
1,089
SBIN
249
251
254
256
258
SUNPHARMA
722
728
738
744
753
TCS
2,329
2,346
2,361
2,377
2,392
TATAMTRDVR
352
355
360
363
367
TATAMOTORS
538
543
550
555
562
TATAPOWER
77
77
78
78
79
TATASTEEL
403
407
411
415
420
TECHM
396
402
412
418
427
ULTRACEMCO
3,906
3,959
4,017
4,071
4,128
WIPRO
469
471
473
475
477
YESBANK
1,229
1,240
1,253
1,264
1,278
ZEEL
477
490
510
523
544
4
Technical & Derivatives Report
October 18, 2016
Research Team Tel: 022 - 39357800
For Technical Queries
For Derivatives Queries
DISCLAIMER
Angel Broking Private Limited (hereinafter referred to as “Angel”) is a registered Member of National Stock Exchange of India Limited,
Bombay Stock Exchange Limited and Metropolitan Stock Exchange Limited. It is also registered as a Depository Participant with CDSL
and Portfolio Manager with SEBI. It also has registration with AMFI as a Mutual Fund Distributor. Angel Broking Private Limited is a
registered entity with SEBI for Research Analyst in terms of SEBI (Research Analyst) Regulations, 2014 vide registration number
INH000000164. Angel or its associates has not been debarred/ suspended by SEBI or any other regulatory authority for accessing
/dealing in securities Market. Angel or its associates/analyst has not received any compensation / managed or co-managed public
offering of securities of the company covered by Analyst during the past twelve months.
This document is solely for the personal information of the recipient, and must not be singularly used as the basis of any investment
decision. Nothing in this document should be construed as investment or financial advice. Each recipient of this document should
make such investigations as they deem necessary to arrive at an independent evaluation of an investment in the securities of the
companies referred to in this document (including the merits and risks involved), and should consult their own advisors to determine
the merits and risks of such an investment.
Reports based on technical and derivative analysis center on studying charts of a stock's price movement, outstanding positions and
trading volume, as opposed to focusing on a company's fundamentals and, as such, may not match with a report on a company's
fundamentals. Investors are advised to refer the Fundamental and Technical Research Reports available on our website to evaluate the
contrary view, if any.
The information in this document has been printed on the basis of publicly available information, internal data and other reliable
sources believed to be true, but we do not represent that it is accurate or complete and it should not be relied on as such, as this
document is for general guidance only. Angel Broking Pvt. Limited or any of its affiliates/ group companies shall not be in any way
responsible for any loss or damage that may arise to any person from any inadvertent error in the information contained in this report.
Angel Broking Pvt. Limited has not independently verified all the information contained within this document. Accordingly, we cannot
testify, nor make any representation or warranty, express or implied, to the accuracy, contents or data contained within this document.
While Angel Broking Pvt. Limited endeavors to update on a reasonable basis the information discussed in this material, there may be
regulatory, compliance, or other reasons that prevent us from doing so.
This document is being supplied to you solely for your information, and its contents, information or data may not be reproduced,
redistributed or passed on, directly or indirectly.
Neither Angel Broking Pvt. Limited, nor its directors, employees or affiliates shall be liable for any loss or damage that may arise from
or in connection with the use of this information.
5