Technical & Derivatives Report
August 18, 2016
Sensex (28005) / Nifty (8643)
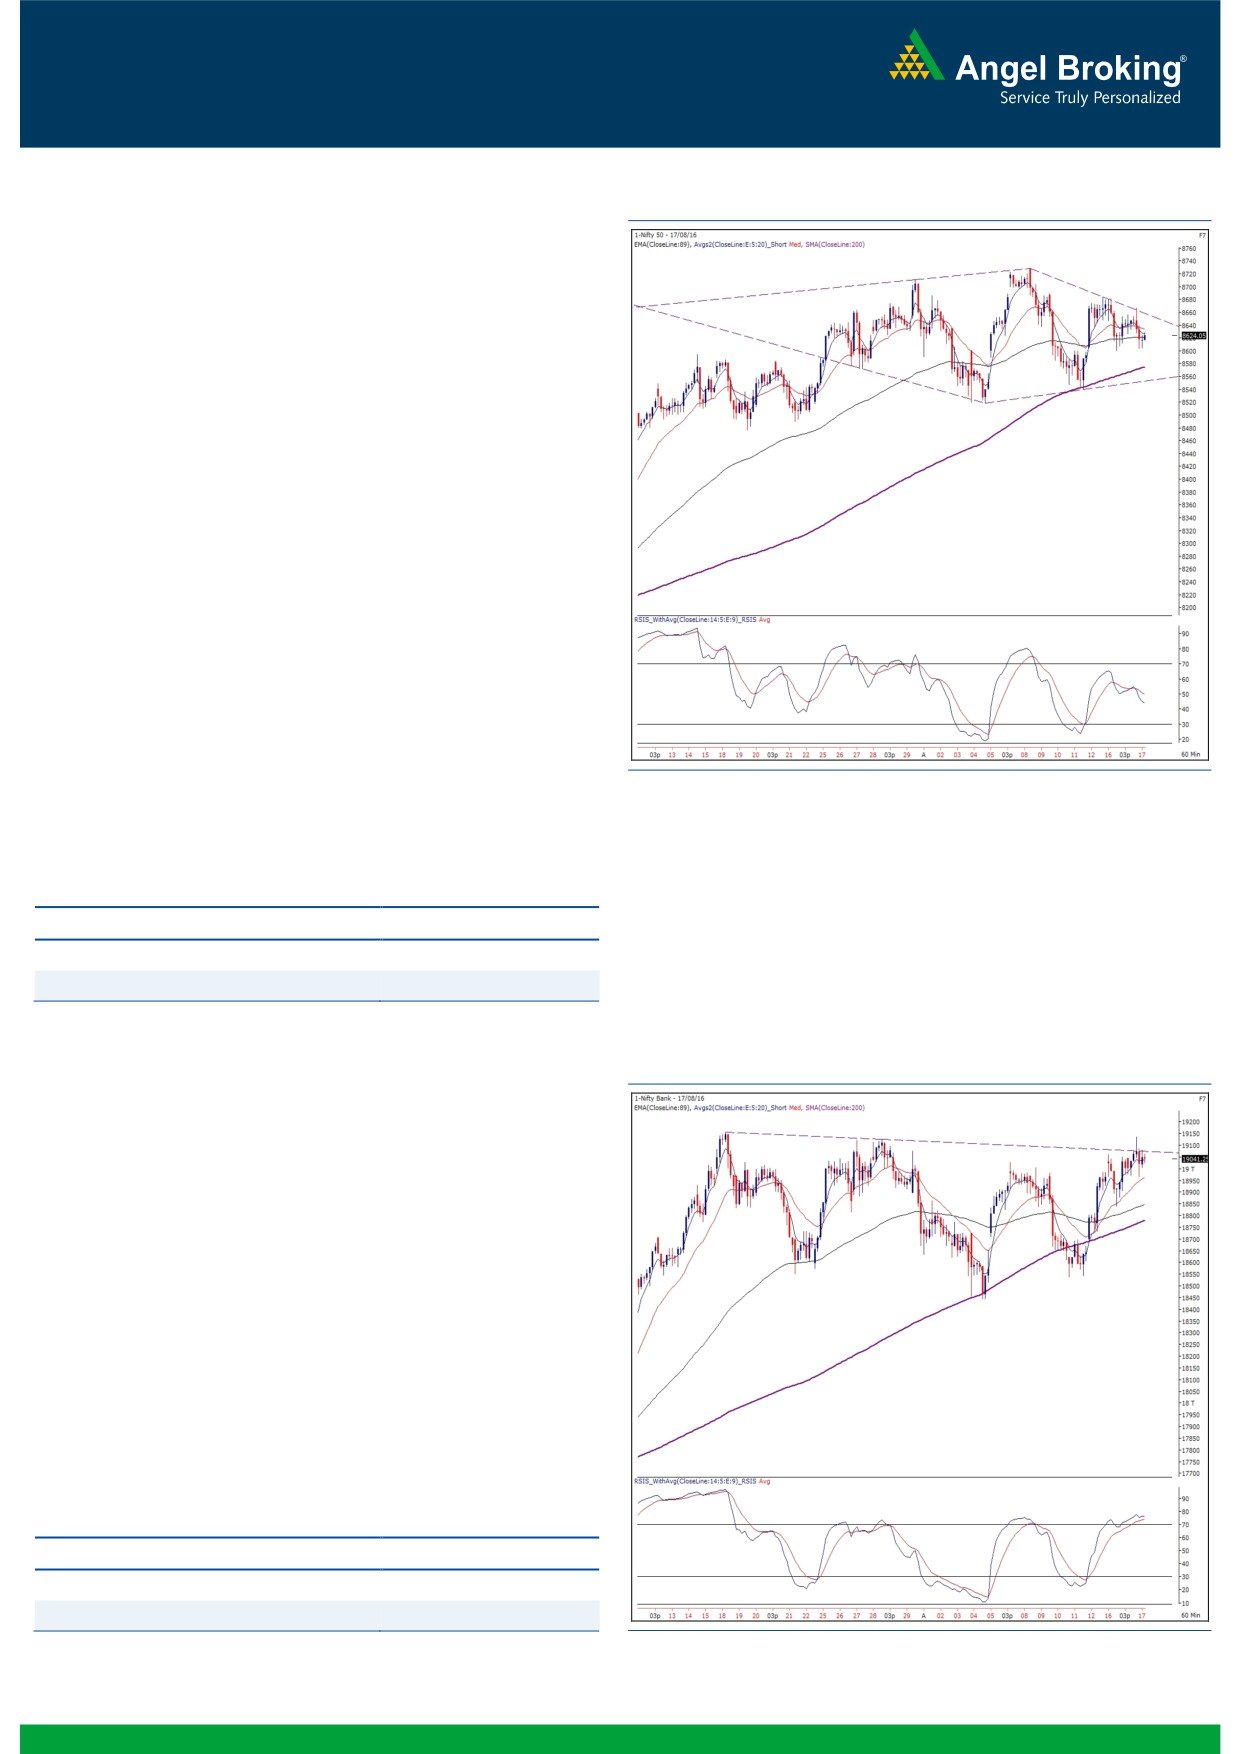
Exhibit 1: Nifty Hourly Chart
Yesterday’s session opened on a flat note citing mixed cues from
the global peers. Post the consolidation in the first half, the Nifty
made a valiant attempt to surpass the higher end (8670 - 8660)
of the ‘Diamond’ pattern formed on the hourly chart. However,
once again, we witnessed a decent correction from the mentioned
resistance zone on the back of strong selling pressure. Eventually,
the Nifty managed to close well above the 8600 mark by
shedding 0.21% from its previous close.
Since last couple of days, we have been closely observing the
chart structure in the hourly time frame. As mentioned in the
earlier report, the ‘Diamond’ pattern is clearly visible and within
this the ‘Super Trend’ indicator placed around 8600 is providing
a decent support. Thus, going forward, traders with a day
perspective should keep an eye on two key levels. Firstly 8600,
which would be a crucial support and a breach of this would
result into further weakness towards 8560 - 8540 levels. On the
upside 8670, which is the higher end of the ‘Diamond Pattern’,
will now act as an immediate hurdle. A decisive breakout beyond
this level would result into an extension of the up move towards
8728. At present, the Nifty is undergoing a consolidation phase
and thus, traders are advised to stay light on positions.
Key Levels
Support 1 - 8600
Resistance 1 - 8670
Support 2 - 8560
Resistance 2 - 8728
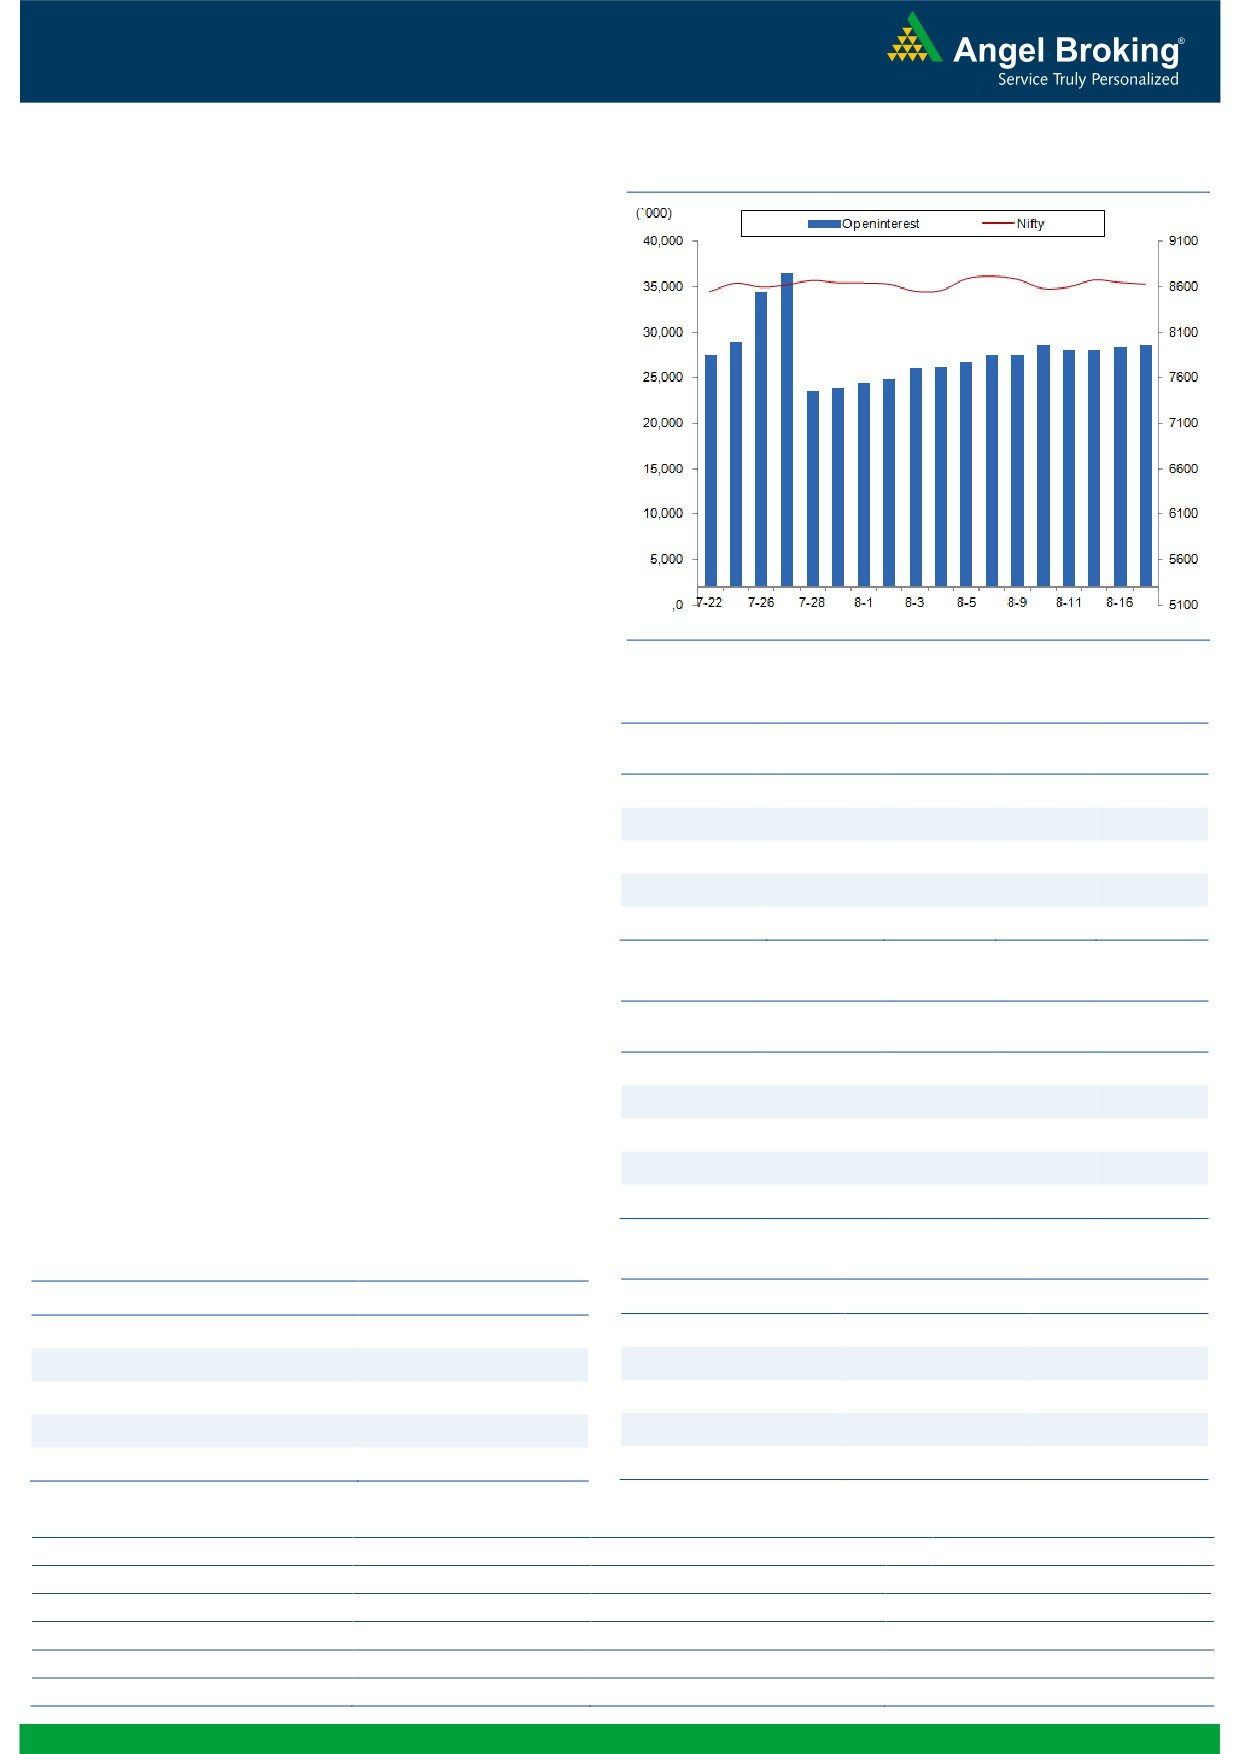
Nifty Bank Outlook - (19041)
Exhibit 2: Nifty Bank Hourly Chart
In yesterday's trading session, the Nifty Bank index tested the
higher end of last one month's trading range and ended the
session with marginal gains of 0.20 percent.
As we have highlighted earlier, the Nifty Bank index since last one
month have been trading in a narrow range. The index is
currently trading near the higher end of the range and thus, the
bulls have a herculean task in near term to cross the resistance
for continuation of upmove. If the index manages to surpass
19158, then we could see continuation of the upmove till 19320-
19485 (resistance on monthly charts). Till then, the index could
continue to oscillate range bound. The intraday support for the
index is placed around 18960 and 18880 whereas resistances
are seen around 19158 and 19229.
Key Levels
Support 1 - 18960
Resistance 1 - 19158
Support 2 - 18880
Resistance 2 - 19229
1
Technical & Derivatives Report
August 18, 2016
Comments
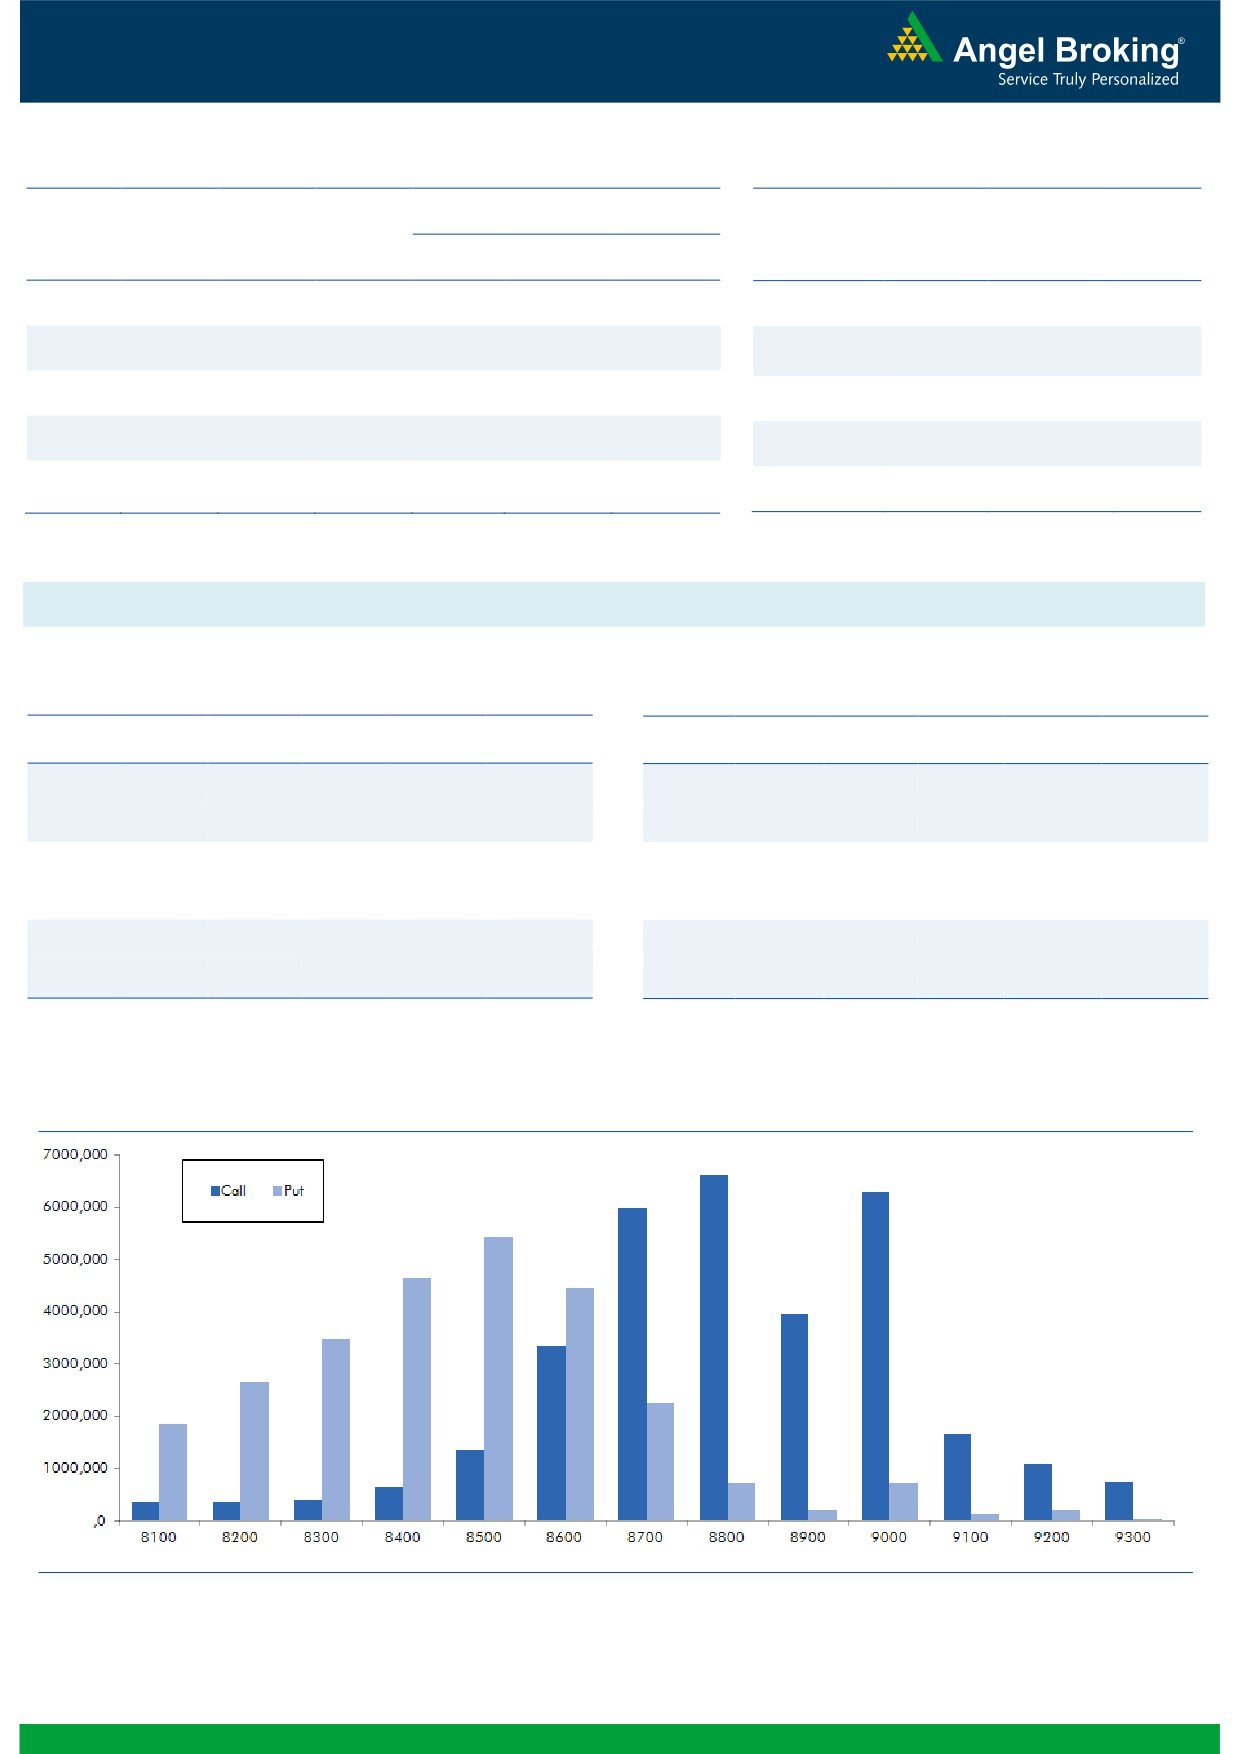
Nifty Vs OI
The Nifty futures open interest has increased by 0.34%
BankNifty futures open interest has increased by 7.95%
as market closed at 8624.05 levels.
The Nifty August future closed with a premium of 7.35
points against a premium of 17.35 points in previous
session. The September series closed at a premium of
56.10 points.
The Implied Volatility of at the money options has
increased from 13.35% to 13.55%.
The total OI of the market is Rs. 2,84,641/- cr. and the
stock futures OI is Rs. 79,043/- cr.
Few of the liquid counters where we have seen high cost
of carry are GMRINFRA, SOUTHBANK, TV18BRDCST,
EXIDEIND and KPIT.
Views
Yesterday, FIIs activity was negligible in equity cash
OI Gainers
segment. While, in Index Futures they were net sellers
OI
PRICE
worth Rs. 125 crores with marginal rise in OI, suggesting
SCRIP
OI
PRICE
CHG. (%)
CHG. (%)
short formation in last trading session.
JUSTDIAL
5226400
52.85
467.20
-3.91
On Index Options front, FIIs bought worth Rs. 68 crores
STAR
1199000
41.56
1058.40
-4.79
with marginal change in OI. In call options, 8800 strike
ORIENTBANK
17508000
15.47
116.55
1.92
added fresh positions; followed by somew.build-upoinng.com
CUMMINSIND
744600
13.13
896.90
-0.46
8600 and 8700 strikes. While in put options, some
unwinding was seen in 8400 and 8600 strikes. Highest
PCJEWELLER
547500
12.65
429.80
1.74
OI in current series has shifted from 9000 to 8800 call
option; while it remains intact at 8500 put option.
OI Losers
Yet another day, when we saw marginal selling from FIIs
OI
PRICE
SCRIP
OI
PRICE
in index future. But, the quantum of shorts was too low
CHG. (%)
CHG. (%)
and their previous longs are still intact. Till the time, Nifty
WOCKPHARMA
3112800
-9.22
787.00
0.56
holds its support of 8500 - 8550 and we don’t see any
JISLJALEQS
40293000
-8.20
81.50
5.03
meaningful change in derivative data, we maintain our
ADANIPORTS
22542500
-7.95
267.40
-2.23
bullish stance on Nifty. Thus, traders are advised to
TVSMOTOR
5038000
-7.70
314.10
5.05
remain light on positions and trade with positive bias.
BANKINDIA
29016000
-6.62
112.00
0.27
Historical Volatility
Put-Call Ratio
SCRIP
HV
SCRIP
PCR-OI
PCR-VOL
TVSMOTOR
32.57
NIFTY
0.98
1.04
STAR
39.12
BANKNIFTY
1.22
0.99
NMDC
31.18
SBIN
0.90
0.71
COALINDIA
26.24
ICICIBANK
0.38
0.22
SAIL
40.97
INFY
0.31
0.50
Strategy Date
Symbol
Strategy
Status
01-08-2016
RELIANCE
Ratio Bear Put Spread
Active
08-08-2016
SBIN
Bull Call Spread
Active
2
Technical & Derivatives Report
August 18, 2016
FII Statistics for 17-August 2016
Turnover on 17-August 2016
Open Interest
No. of
Turnover
Change
Detail
Buy
Sell
Net
Instrument
Value
Contracts
( in Cr. )
(%)
Contracts
Change (%)
(in Cr.)
INDEX
INDEX
1777.43
1902.80
(125.37)
346838
22871.75
1.59
217784
14992.95
-2.81
FUTURES
FUTURES
INDEX
INDEX
45412.45
45344.84
67.61
1056844
69215.46
1.98
3909868
272612.31
12.62
OPTIONS
OPTIONS
STOCK
6131.05
5865.14
265.91
902864
58812.65
0.36
STOCK
FUTURES
547069
36912.24
-6.20
FUTURES
STOCK
STOCK
4189.81
4189.59
0.22
96761
6438.98
0.90
OPTIONS
375252
25592.84
-9.93
OPTIONS
TOTAL
57510.74
57302.36
208.37
2403307
157338.84
1.26
TOTAL
5049973
350110.34
7.64
Nifty Spot = 8624.05
Lot Size = 75
Bull-Call Spreads
Bear-Put Spreads
Action
Strike
Price
Risk
Reward
BEP
Action
Strike
Price
Risk
Reward
BEP
Buy
8700
41.15
Buy
8600
57.15
24.75
75.25
8724.75
29.35
70.65
8570.65
Sell
8800
16.40
Sell
8500
27.80
Buy
8700
41.15
Buy
8600
57.15
35.35
164.65
8735.35
44.10
155.90
8555.90
Sell
8900
5.80
Sell
8400
13.05
Buy
8800
16.40
Buy
8500
27.80
10.60
89.40
8810.60
14.75
85.25
8485.25
Sell
8900
5.80
Sell
8400
13.05
Note: Above mentioned Bullish or Bearish Spreads in Nifty (August Series) are given as an information and not as a recommendation.
Nifty Put-Call Analysis
3
Technical & Derivatives Report
August 18, 2016
Daily Pivot Levels for Nifty Constituents
Scrips
S2
S1
PIVOT
R1
R2
ACC
1,624
1,650
1,667
1,693
1,710
ADANIPORTS
259
263
270
274
281
AMBUJACEM
262
266
269
273
276
ASIANPAINT
1,097
1,105
1,116
1,125
1,136
AUROPHARMA
725
737
744
756
763
AXISBANK
578
584
591
597
604
BAJAJ-AUTO
2,856
2,898
2,925
2,967
2,994
BANKBARODA
148
150
151
153
154
BHEL
135
137
138
139
140
BPCL
575
581
590
596
605
BHARTIARTL
340
343
346
349
352
INFRATEL
342
345
349
353
357
BOSCH
23,647
23,811
23,990
24,154
24,333
CIPLA
537
543
554
560
570
COALINDIA
333
340
345
353
357
DRREDDY
2,964
2,985
3,002
3,022
3,040
EICHERMOT
22,065
22,207
22,353
22,495
22,641
GAIL
364
366
369
371
374
GRASIM
4,408
4,464
4,526
4,583
4,645
HCLTECH
770
777
789
796
808
HDFCBANK
1,221
1,228
1,233
1,240
1,244
HDFC
1,341
1,354
1,363
1,376
1,385
HEROMOTOCO
3,234
3,296
3,363
3,425
3,492
HINDALCO
153
154
156
157
158
HINDUNILVR
901
907
916
923
932
ICICIBANK
242
245
248
251
255
IDEA
91
92
94
95
96
INDUSINDBK
1,142
1,148
1,155
1,161
1,168
INFY
1,017
1,025
1,039
1,047
1,061
ITC
250
252
254
256
259
KOTAKBANK
756
761
766
771
777
LT
1,479
1,491
1,503
1,514
1,526
LUPIN
1,558
1,576
1,591
1,609
1,623
M&M
1,427
1,439
1,448
1,459
1,468
MARUTI
4,821
4,856
4,883
4,918
4,946
NTPC
159
160
161
162
163
ONGC
233
235
237
239
241
POWERGRID
171
173
176
178
180
RELIANCE
995
1,004
1,016
1,026
1,038
SBIN
241
244
247
249
252
SUNPHARMA
765
775
783
793
801
TCS
2,566
2,595
2,647
2,676
2,728
TATAMTRDVR
329
331
333
335
337
TATAMOTORS
502
506
510
514
519
TATAPOWER
75
76
77
79
80
TATASTEEL
375
384
388
397
401
TECHM
463
469
478
484
493
ULTRACEMCO
3,637
3,668
3,703
3,734
3,769
WIPRO
519
524
531
535
542
YESBANK
1,277
1,292
1,301
1,317
1,326
ZEEL
490
494
500
504
510
4
Technical & Derivatives Report
August 18, 2016
Research Team Tel: 022 - 39357800
For Technical Queries
For Derivatives Queries
DISCLAIMER
Angel Broking Private Limited (hereinafter referred to as “Angel”) is a registered Member of National Stock Exchange of India Limited,
Bombay Stock Exchange Limited and Metropolitan Stock Exchange Limited. It is also registered as a Depository Participant with CDSL
and Portfolio Manager with SEBI. It also has registration with AMFI as a Mutual Fund Distributor. Angel Broking Private Limited is a
registered entity with SEBI for Research Analyst in terms of SEBI (Research Analyst) Regulations, 2014 vide registration number
INH000000164. Angel or its associates has not been debarred/ suspended by SEBI or any other regulatory authority for accessing
/dealing in securities Market. Angel or its associates/analyst has not received any compensation / managed or co-managed public
offering of securities of the company covered by Analyst during the past twelve months.
This document is solely for the personal information of the recipient, and must not be singularly used as the basis of any investment
decision. Nothing in this document should be construed as investment or financial advice. Each recipient of this document should
make such investigations as they deem necessary to arrive at an independent evaluation of an investment in the securities of the
companies referred to in this document (including the merits and risks involved), and should consult their own advisors to determine
the merits and risks of such an investment.
Reports based on technical and derivative analysis center on studying charts of a stock's price movement, outstanding positions and
trading volume, as opposed to focusing on a company's fundamentals and, as such, may not match with a report on a company's
fundamentals. Investors are advised to refer the Fundamental and Technical Research Reports available on our website to evaluate the
contrary view, if any.
The information in this document has been printed on the basis of publicly available information, internal data and other reliable
sources believed to be true, but we do not represent that it is accurate or complete and it should not be relied on as such, as this
document is for general guidance only. Angel Broking Pvt. Limited or any of its affiliates/ group companies shall not be in any way
responsible for any loss or damage that may arise to any person from any inadvertent error in the information contained in this report.
Angel Broking Pvt. Limited has not independently verified all the information contained within this document. Accordingly, we cannot
testify, nor make any representation or warranty, express or implied, to the accuracy, contents or data contained within this document.
While Angel Broking Pvt. Limited endeavors to update on a reasonable basis the information discussed in this material, there may be
regulatory, compliance, or other reasons that prevent us from doing so.
This document is being supplied to you solely for your information, and its contents, information or data may not be reproduced,
redistributed or passed on, directly or indirectly.
Neither Angel Broking Pvt. Limited, nor its directors, employees or affiliates shall be liable for any loss or damage that may arise from
or in connection with the use of this information.
5