Technical & Derivatives Report
May 18, 2016
Sensex (25774) / Nifty (7891)
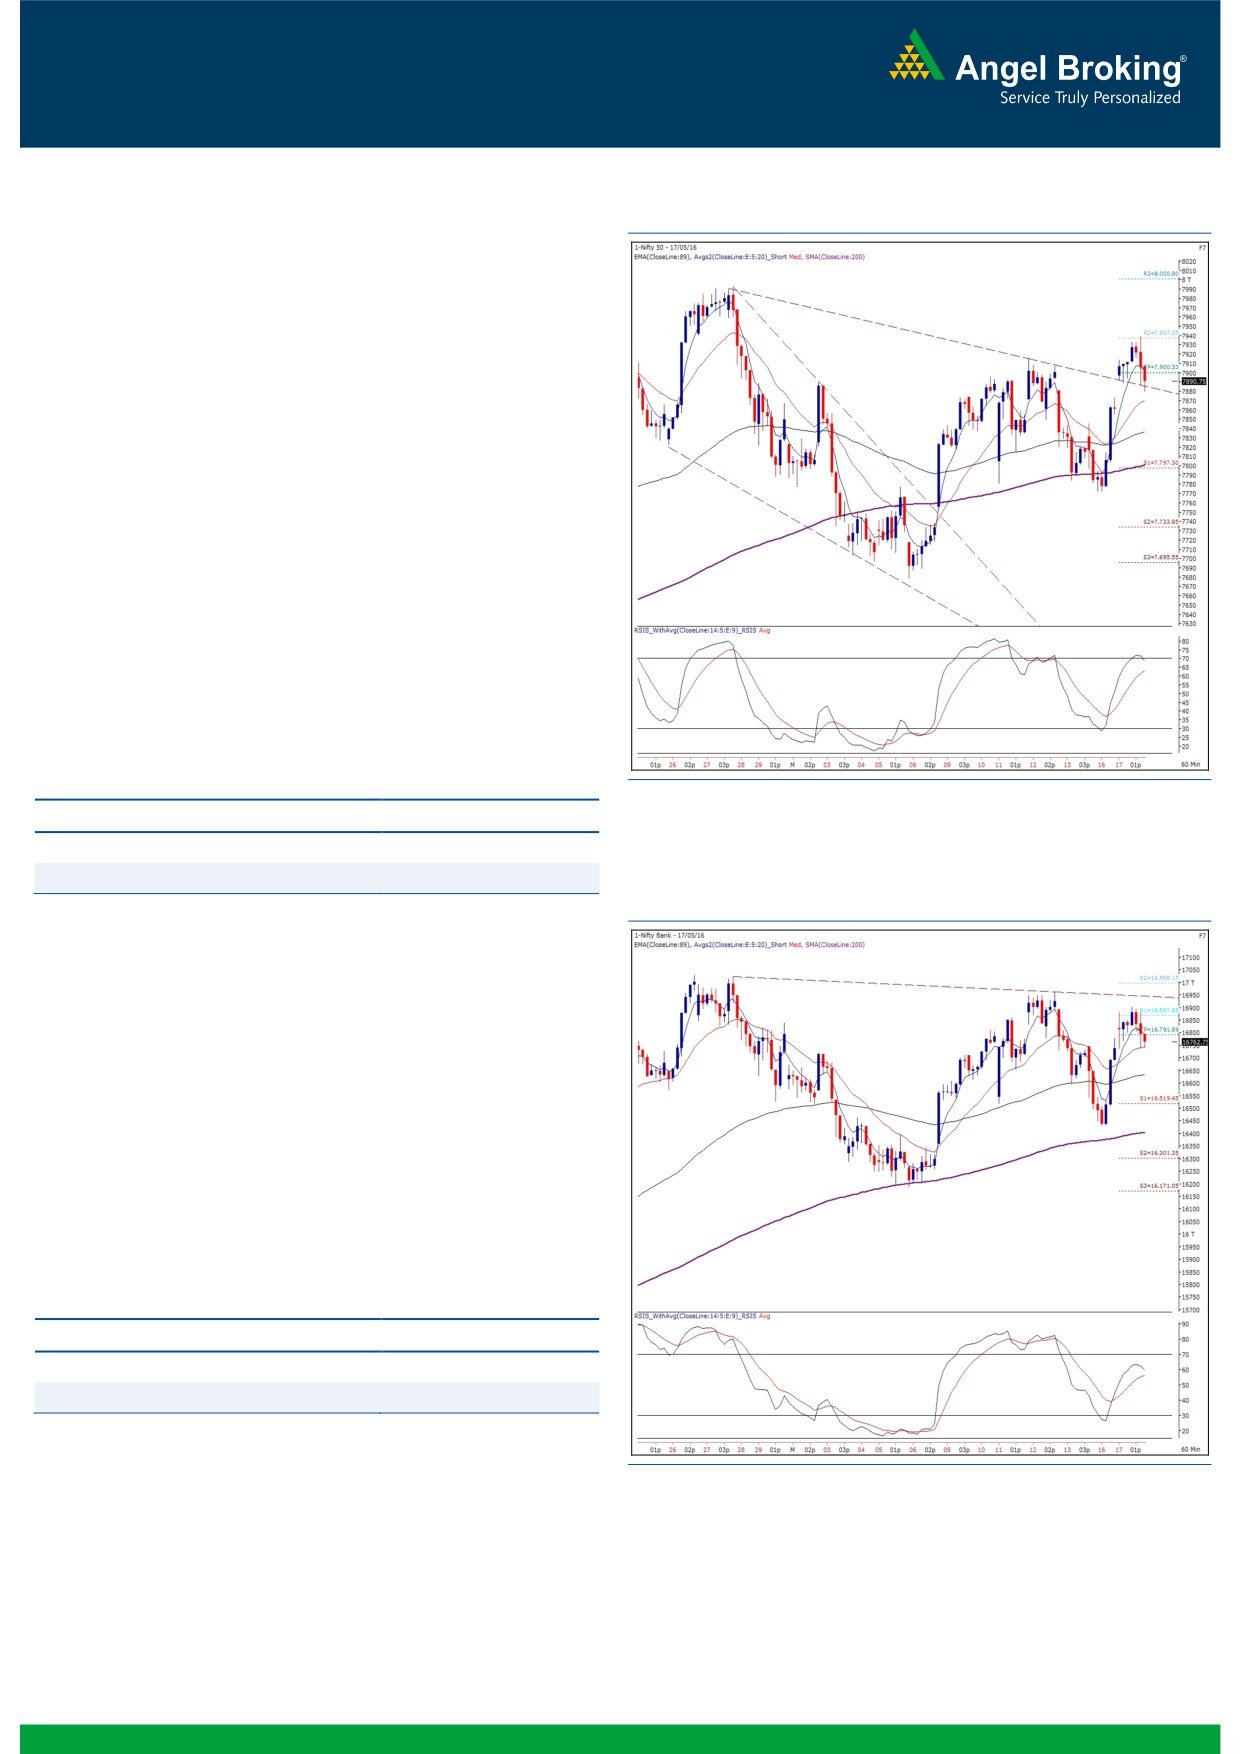
Exhibit 1: Nifty Hourly Chart
Yesterday’s session opened with a decent upside gap owing to
positive global cues. Subsequently, the index continued this
optimism in the first half. However, once again, a lack of trust at
higher level led to a modest profit booking in the latter half to
conclude the day tad below the 7900 mark.
Yesterday’s gap up opening beyond the ‘Downward Sloping
Trend Line’ level of 7880 confirmed a ‘Breakaway Gap’ on the
hourly chart. As mentioned in the earlier report, the Nifty
continued its upward momentum to first test the 7920 mark and
then extended the move after surpassing it. However, the up
move was truncated as the Nifty reversed half way through after
posting a high of 7940.10. Going forward, despite this tail-end
corrective move, we maintain our positive stance and expect the
index to test higher levels of
7960
-
7990 levels in the
forthcoming session. The rationale behind this opinion would be
a ‘Trend Line’ breakout on the hourly chart with a ‘Breakaway
Gap’ and thus, interpreting this down move as a pull back
towards the trend line level of 7880.
Key Levels
Support 1 - 7880
Resistance 1 - 7940
Support 2 - 7840
Resistance 2 - 7990
Exhibit 2: Nifty Bank Hourly Chart
Nifty Bank Outlook - (16763)
The Nifty Bank index opened marginally positive yesterday; but
traded in a narrow range of 165 points to end the session almost
near its previous day's close.
In last few trading sessions, the index has been consolidating and
has not given any directional momentum on either side. The
major resistance continues to be in the range of 17020 - 17050
and hence the uptrend will be continued only on a breakout of
this resistance. Till then, traders should continue to focus on stock
specific strategies with proper risk management. The intraday
supportsfor the index are placed around 16600 and 16430;
whereas, resistances are seen around 16950 and 17050.
Key Levels
Support 1 - 16600
Resistance 1 - 16950
Support 2 - 16430
Resistance 2 - 17050
1
Technical & Derivatives Report
May 18, 2016
Comments
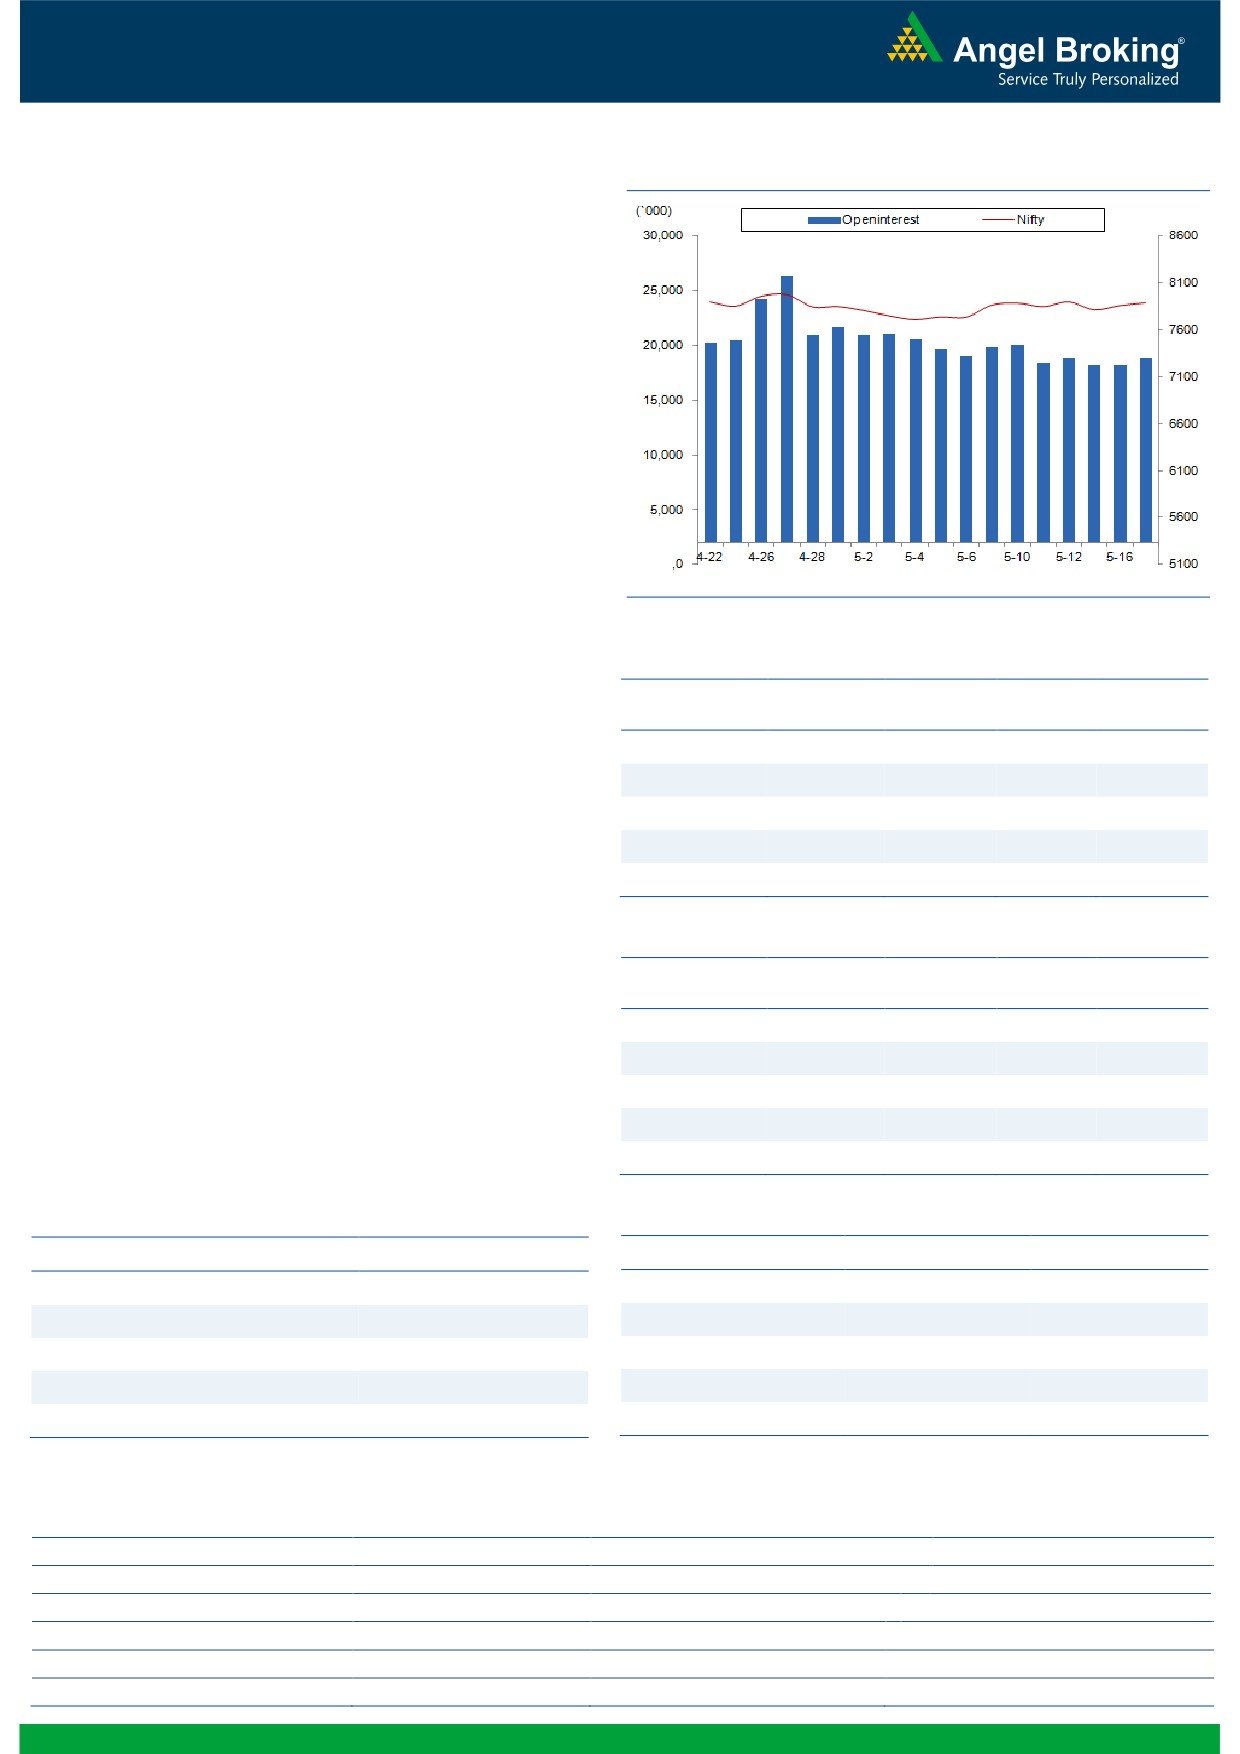
Nifty Vs OI
The Nifty futures open interest has increased by 3.19%
BankNifty futures open interest has increased by 2.98%
as market closed at 7890.75 levels.
The Nifty May future closed at a premium of 16.85
points against a premium of 26.45 points. The June
series closed at a premium of 26.35 points.
The Implied Volatility of at the money options has
decreased from 15.59% to 15.16%.
The total OI of the market is Rs. 2,37,151/- cr. and the
stock futures OI is Rs. 62,519/- cr.
Few of the liquid counters where we have seen high cost
of carry are UNITECH, JPASSOCIAT, ADANIPOWER,
JINDALSTEL and SOUTHBANK.
Views
Yesterday, FIIs were net seller in equity cash segment
worth Rs. 225 crores. While, they bought Index future to
OI Gainers
the tune of Rs. 296 crores with significant rise in OI,
OI
PRICE
SCRIP
OI
PRICE
indicating blend of both long and short build-up.
CHG. (%)
CHG. (%)
CASTROLIND
3994100
21.07
396.75
-4.63
In Index Options front, FIIs were net buyer worth Rs. 647
crores with marginal change in OI. In call options, 7950
VOLTAS
7014800
20.76
336.10
2.92
and 8050 strikes added some fresh positions. While,
SYNDIBANK
12732000
18.33
66.25
5.08
good amount of unwinding was seen in 7800 and 8000
MOTHERSUMI
13930000
15.97
291.55
8.56
call options. Whereas in put options, we witnessed hugeng.com
GODREJCP
270800
10.26
1378.30
-1.24
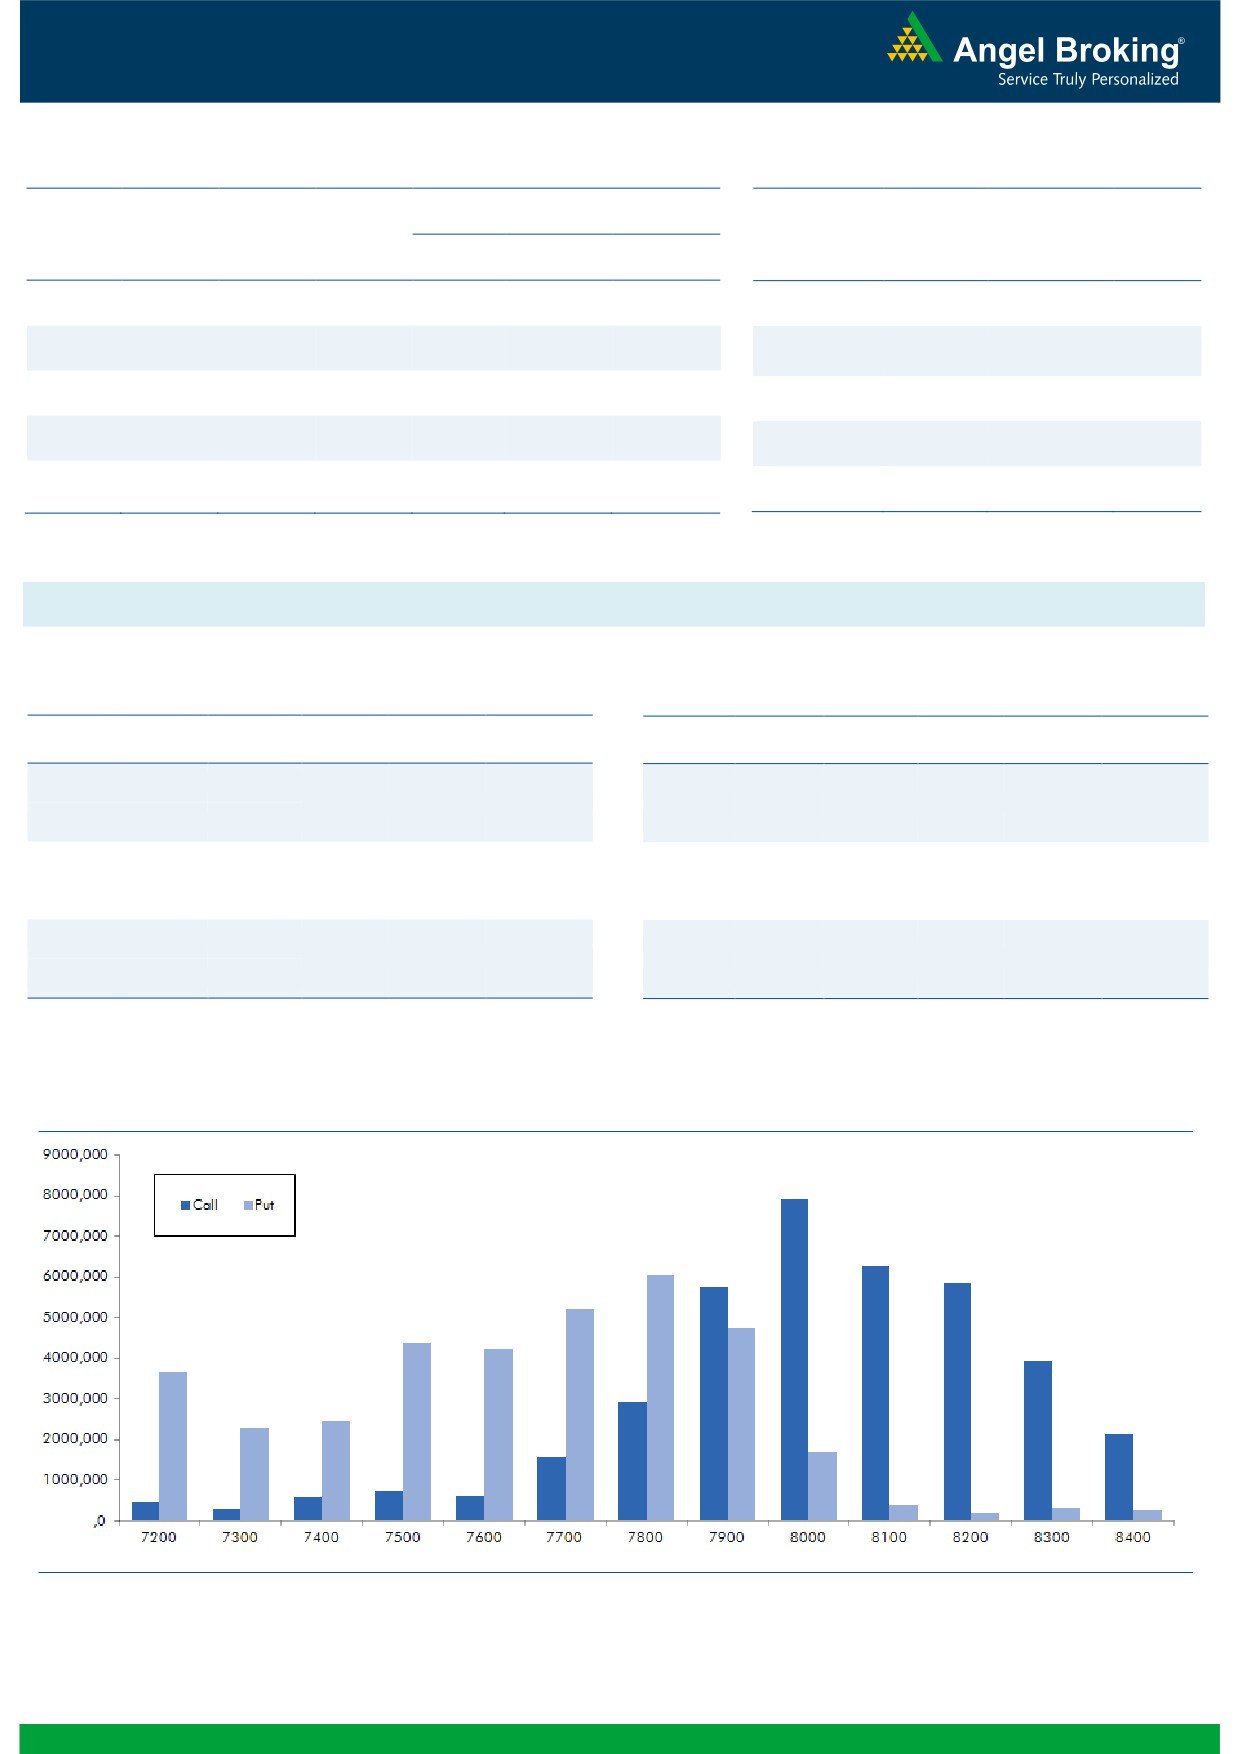
OI addition in 7900 and 7800 strike. Maximum OI in
current series is visible at 8000 call and 7800 put option.
OI Losers
We had already mentioned in our previous reports that
OI
PRICE
SCRIP
OI
PRICE
the Nifty may continue to trade in range of 7700 - 8000
CHG. (%)
CHG. (%)
with positive bias. And yesterday’s FIIs activity depicts
IGL
1525700
-13.64
591.35
2.68
some sign of bullishness. If there is follow-up buying by
ARVIND
5219300
-9.31
303.80
0.33
FIIs in index future segment in upcoming sessions, we
HCLTECH
12012800
-6.99
732.75
1.59
may see Nifty crossing its crucial resistance of
JETAIRWAYS
5896000
-5.94
654.45
-1.34
8000.
Hence, traders are advised to trade with
ONGC
23869000
-5.92
210.60
3.46
positive bias with proper exit strategy.
Historical Volatility
Put-Call Ratio
SCRIP
HV
SCRIP
PCR-OI
PCR-VOL
SUNTV
58.46
NIFTY
0.96
0.94
MOTHERSUMI
56.78
BANKNIFTY
0.94
0.81
CASTROLIND
39.77
RELIANCE
0.34
0.31
ONGC
34.21
SBIN
0.41
0.31
IGL
28.38
ICICIBANK
0.44
0.40
Strategy Date
Symbol
Strategy
Status
02-05-2016
NIFTY
Long Strangle
Active
09-05-2016
RELIANCE
Long Put
Loss Booked on May 17, 2016
16-05-2016
LT
Short Strangle
Active
2
Technical & Derivatives Report
May 18, 2016
FII Statistics for 17-May 2016
Turnover on 17-May 2016
Open Interest
No. of
Turnover
Change
Detail
Buy
Sell
Net
Instrument
Value
Contracts
( in Cr. )
(%)
Contracts
Change (%)
(in Cr.)
INDEX
INDEX
2018.15
1721.66
296.49
249293
14389.07
8.63
273949
15320.21
-20.19
FUTURES
FUTURES
INDEX
INDEX
26567.68
25920.47
647.21
1218157
71253.72
0.63
3417226
199900.42
-4.80
OPTIONS
OPTIONS
STOCK
4796.64
4393.15
403.49
1050296
50576.49
0.79
STOCK
FUTURES
593246
29356.17
13.04
FUTURES
STOCK
STOCK
2924.69
2934.52
(9.84)
83712
4082.22
3.78
OPTIONS
384714
19294.76
17.76
OPTIONS
TOTAL
36307.16
34969.81
1337.35
2601458
140301.50
1.51
TOTAL
4669135
263871.56
-2.82
Nifty Spot = 7890.75
Lot Size = 75
Bull-Call Spreads
Bear-Put Spreads
Action
Strike
Price
Risk
Reward
BEP
Action
Strike
Price
Risk
Reward
BEP
Buy
7900
78.50
Buy
7900
72.00
42.05
57.95
7942.05
33.70
66.30
7866.30
Sell
8000
36.45
Sell
7800
38.30
Buy
7900
78.50
Buy
7900
72.00
64.65
135.35
7964.65
52.15
147.85
7847.85
Sell
8100
13.85
Sell
7700
19.85
Buy
8000
36.45
Buy
7800
38.30
22.60
77.40
8022.60
18.45
81.55
7781.55
Sell
8100
13.85
Sell
7700
19.85
Note: Above mentioned Bullish or Bearish Spreads in Nifty (May Series) are given as an information and not as a recommendation.
Nifty Put-Call Analysis
3
Technical & Derivatives Report
May 18, 2016
Daily Pivot Levels for Nifty Constituents
Scrips
S2
S1
PIVOT
R1
R2
ACC
1,425
1,437
1,452
1,465
1,480
ADANIPORTS
180
182
184
186
189
AMBUJACEM
213
215
217
219
221
ASIANPAINT
939
954
963
979
987
AUROPHARMA
760
768
781
789
802
AXISBANK
485
494
500
509
515
BAJAJ-AUTO
2,474
2,490
2,513
2,529
2,551
BANKBARODA
137
140
142
144
147
BHEL
119
120
122
123
124
BPCL
923
934
941
953
960
BHARTIARTL
343
347
353
357
363
INFRATEL
379
383
387
391
396
BOSCH
20,768
21,186
21,518
21,936
22,268
CIPLA
519
521
525
527
531
COALINDIA
280
282
284
285
287
DRREDDY
2,993
3,006
3,021
3,033
3,049
EICHERMOT
18,165
18,383
18,773
18,991
19,381
GAIL
374
379
383
388
392
GRASIM
4,229
4,256
4,283
4,310
4,337
HCLTECH
711
722
730
741
749
HDFCBANK
1,140
1,147
1,158
1,165
1,176
HDFC
1,174
1,196
1,213
1,235
1,252
HEROMOTOCO
2,878
2,905
2,932
2,959
2,986
HINDALCO
87
88
90
91
92
HINDUNILVR
819
827
838
846
858
ICICIBANK
220
223
225
228
230
IDEA
108
110
112
114
116
INDUSINDBK
1,064
1,074
1,087
1,097
1,110
INFY
1,198
1,206
1,216
1,224
1,234
ITC
326
328
331
333
336
KOTAKBANK
697
703
714
720
731
LT
1,271
1,281
1,295
1,305
1,319
LUPIN
1,591
1,602
1,613
1,624
1,636
M&M
1,304
1,323
1,337
1,356
1,370
MARUTI
3,853
3,902
3,935
3,984
4,018
NTPC
133
135
138
140
144
ONGC
202
206
209
213
216
POWERGRID
141
143
144
146
148
RELIANCE
956
963
973
979
990
SBIN
174
175
177
179
180
SUNPHARMA
794
797
800
803
806
TCS
2,532
2,551
2,571
2,590
2,610
TATAMTRDVR
267
269
273
276
280
TATAMOTORS
382
386
390
394
399
TATAPOWER
69
69
70
71
71
TATASTEEL
321
324
328
331
334
TECHM
474
479
487
491
499
ULTRACEMCO
3,145
3,199
3,234
3,288
3,323
WIPRO
536
538
540
542
545
YESBANK
947
958
979
991
1,011
ZEEL
438
441
447
451
457
4
Technical & Derivatives Report
May 18, 2016
Research Team Tel: 022 - 39357800
For Technical Queries
For Derivatives Queries
DISCLAIMER
Angel Broking Private Limited (hereinafter referred to as “Angel”) is a registered Member of National Stock Exchange of India Limited,
Bombay Stock Exchange Limited and MCX Stock Exchange Limited. It is also registered as a Depository Participant with CDSL and
Portfolio Manager with SEBI. It also has registration with AMFI as a Mutual Fund Distributor. Angel Broking Private Limited is a
registered entity with SEBI for Research Analyst in terms of SEBI (Research Analyst) Regulations, 2014 vide registration number
INH000000164. Angel or its associates has not been debarred/ suspended by SEBI or any other regulatory authority for accessing
/dealing in securities Market. Angel or its associates including its relatives/analyst do not hold any financial interest/beneficial
ownership of more than 1% in the company covered by Analyst. Angel or its associates/analyst has not received any compensation /
managed or co-managed public offering of securities of the company covered by Analyst during the past twelve months. Angel/analyst
has not served as an officer, director or employee of company covered by Analyst and has not been engaged in market making activity
of the company covered by Analyst.
This document is solely for the personal information of the recipient, and must not be singularly used as the basis of any investment
decision. Nothing in this document should be construed as investment or financial advice. Each recipient of this document should
make such investigations as they deem necessary to arrive at an independent evaluation of an investment in the securities of the
companies referred to in this document (including the merits and risks involved), and should consult their own advisors to determine
the merits and risks of such an investment.
Reports based on technical and derivative analysis center on studying charts of a stock's price movement, outstanding positions and
trading volume, as opposed to focusing on a company's fundamentals and, as such, may not match with a report on a company's
fundamentals.
The information in this document has been printed on the basis of publicly available information, internal data and other reliable
sources believed to be true, but we do not represent that it is accurate or complete and it should not be relied on as such, as this
document is for general guidance only. Angel Broking Pvt. Limited or any of its affiliates/ group companies shall not be in any way
responsible for any loss or damage that may arise to any person from any inadvertent error in the information contained in this report.
Angel Broking Pvt. Limited has not independently verified all the information contained within this document. Accordingly, we cannot
testify, nor make any representation or warranty, express or implied, to the accuracy, contents or data contained within this document.
While Angel Broking Pvt. Limited endeavors to update on a reasonable basis the information discussed in this material, there may be
regulatory, compliance, or other reasons that prevent us from doing so.
This document is being supplied to you solely for your information, and its contents, information or data may not be reproduced,
redistributed or passed on, directly or indirectly.
Neither Angel Broking Pvt. Limited, nor its directors, employees or affiliates shall be liable for any loss or damage that may arise from
or in connection with the use of this information.
Note: Please refer to the important ‘Stock Holding Disclosure' report on the Angel website (Research Section). Also, please refer to the
latest update on respective stocks for the disclosure status in respect of those stocks. Angel Broking Pvt. Limited and its affiliates may
have investment positions in the stocks recommended in this report.
5