Technical & Derivatives Report
March 18, 2016
Sensex (24677) / Nifty (7513)
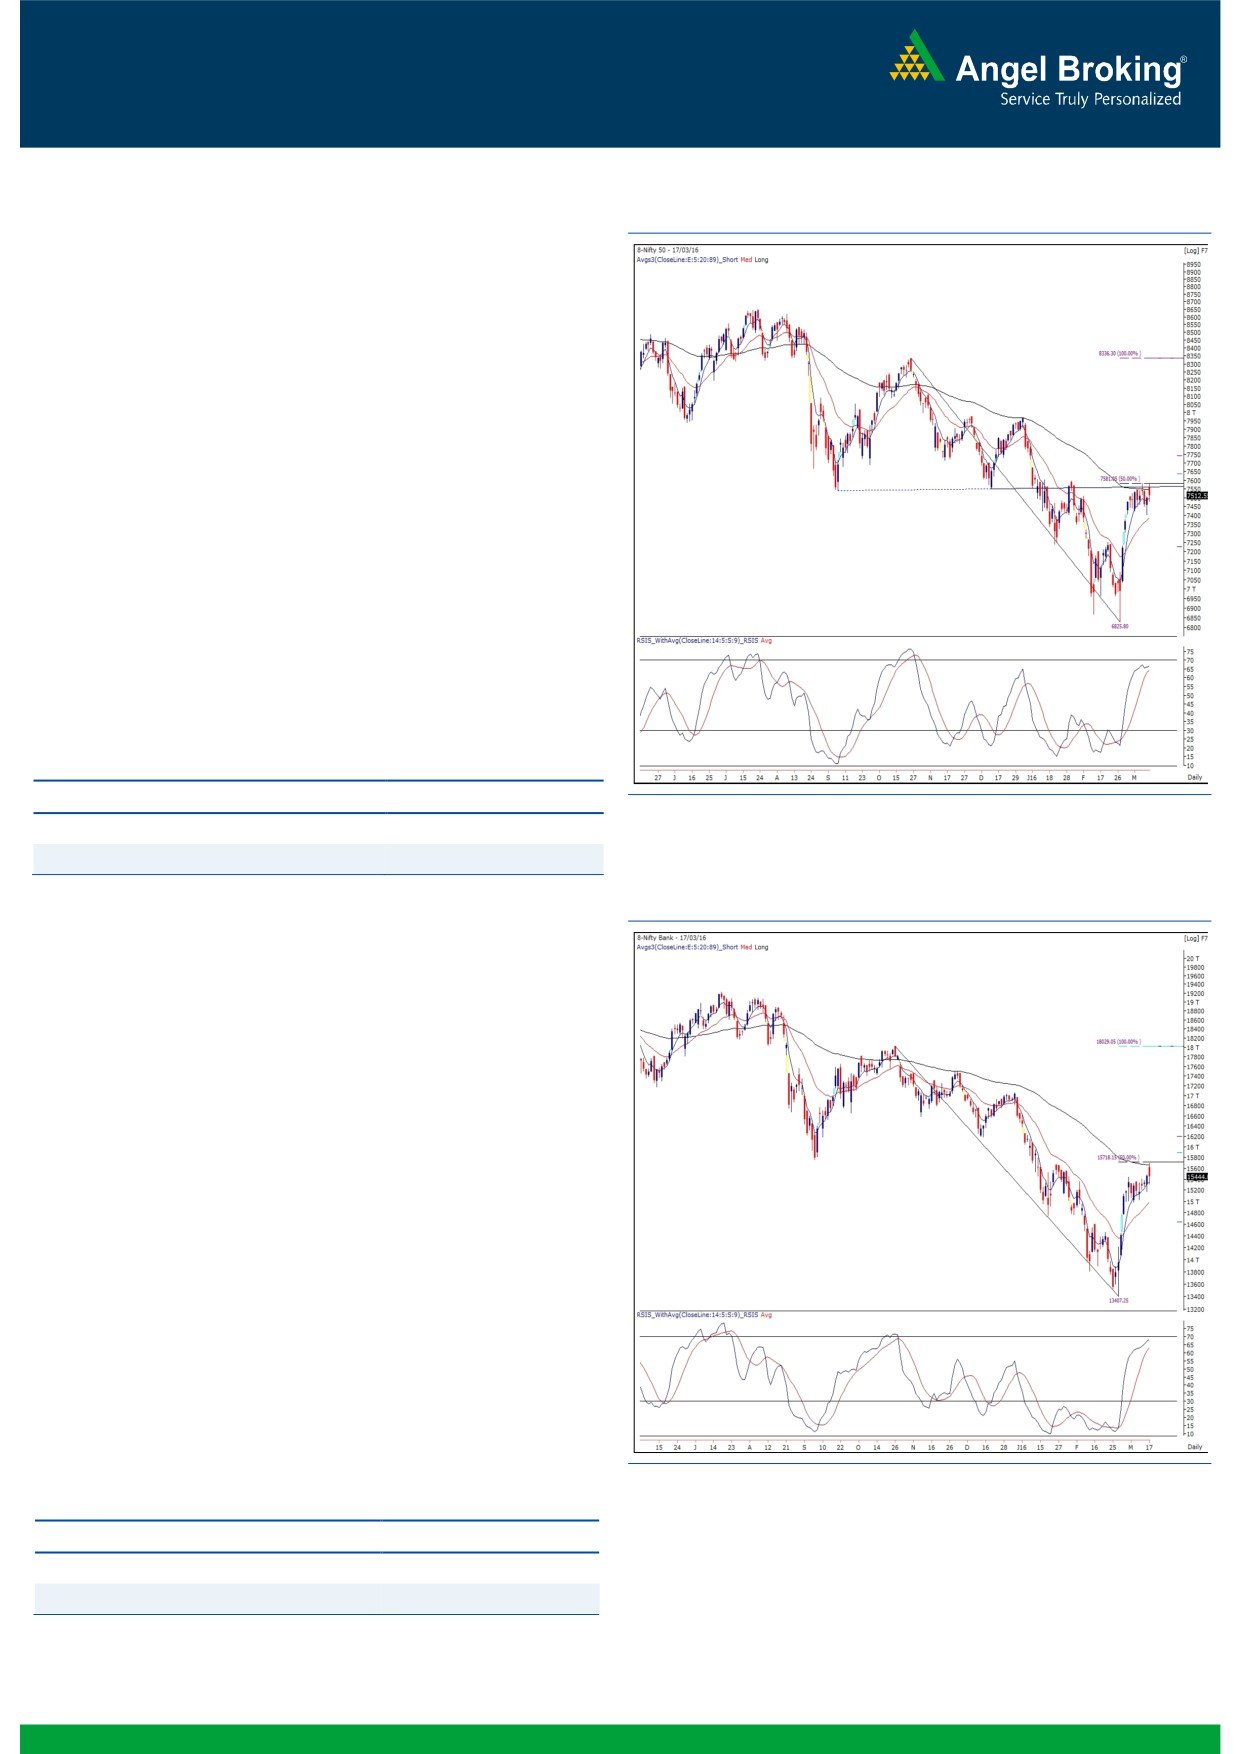
Exhibit 1: Nifty Daily Chart
Yesterday, the Nifty opened with the upside gap of around 60
points owing to the positive cues from global bourses. Post the
gap up opening, index traded higher in initial hour of the
trade. But, it resisted around Monday’s high of 7583.70 and
started correcting. The fall gets accelerated in the later half of
the session. Eventually, the session ended near low point of the
day.
Once again, Nifty failed to cross its major hurdle of 7550 -
7600 zone decisively and formed a ‘Double Top’ pattern in
intraday charts. Formation of bearish pattern may result into
some more correction in the index. However, support of gap
area of 7380 - 7405 remains intact. Thus, Index is expected
to trade within a range of 7400 - 7585 in upcoming sessions
too. Hence, traders are advised focus more on stock specific
moves. Going forward, immediate resistance for the Nifty is
placed at 7575 - 7600 levels; whereas, intraday support
levels are seen at 7479 - 7405 levels.
Key Levels
Support 1 - 7479
Resistance 1 - 7575
Support 2 - 7405
Resistance 2 -
7600
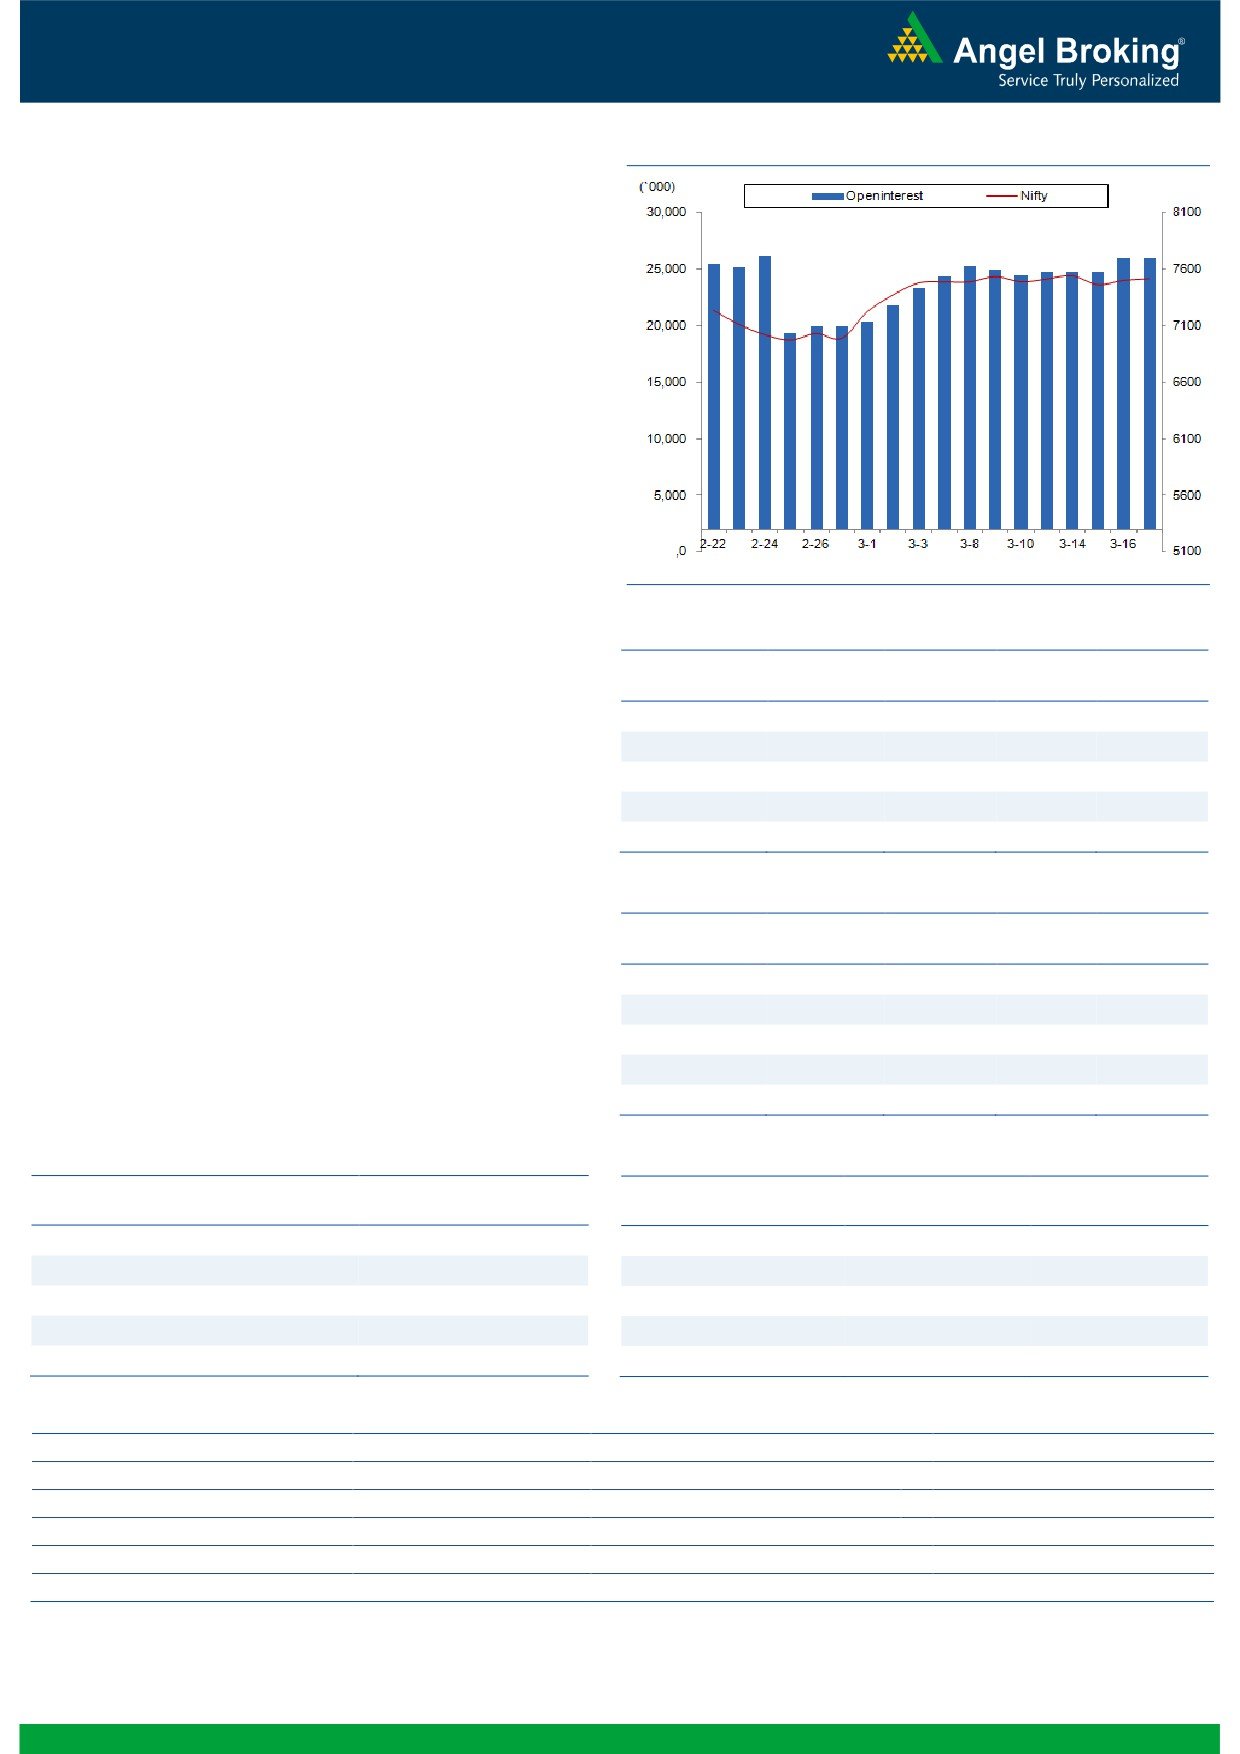
Exhibit 2: Nifty Bank Daily Chart
Nifty Bank Outlook - (15444)
In-line with the benchmark indices, the Nifty Bank index too
opened with the upside gap and rallied in initial trades.
However, we witnessed sharp selling pressure from 15700
levels, which dragged the index into negative territory.
Eventually, the Nifty Bank index ended with the negligible loss
of 0.11 percent over its previous close.
From last few sessions, we have been mentioning that a
breakout from 15000 - 15450 can lead the prices to touch its
next resistance zone of 15650 - 15700 levels, which is
conjunction of ‘89EMA’ and 50% retracement level on daily
chart. Yesterday, the banking index had taken resistance
around the mentioned zone and started correcting. At current
juncture, we advise traders to book profit in their long
positions and wait for further development to initiate any
directional trade in banking index. Going forward, immediate
resistance for the Nifty Bank index is placed at 15544 and
15700 levels; whereas, intraday support for the index is
placed around 15373 and 15178.
Key Levels
Support 1 - 15373
Resistance 1 - 15544
Support 2 - 15178
Resistance 2 - 15700
1
Technical & Derivatives Report
March 18, 2016
Comments
Nifty Vs OI
The Nifty futures open interest has increased by 0.15%
BankNifty futures open interest has decreased by 0.27%
as market closed at 7512.55 levels.
The Nifty March future closed at a premium of 0.20
points against a premium of 28.25 points. The April
series closed at a premium of 40.60 points.
The Implied Volatility of at the money options has
decreased from 14.96% to 14.35%.
The total OI of the market is Rs. 2,37,041/- cr. and the
stock futures OI is Rs. 55,178/- cr.
Few of the liquid counters where we have seen high cost
of carry are UNITECH, JISLJALEQS, JPASSOCIAT, IFCI
and INFRATEL.
Views
FIIs continued to buy in both Cash market and Index
OI Gainers
Future segment. Yesterday, they bought equities worth
OI
PRICE
SCRIP
OI
PRICE
Rs. 744 crores. While in Index Futures, they were net
CHG. (%)
CHG. (%)
buyers of Rs. 592 crores with marginal rise in OI,
CUMMINSIND
102000
31.78
847.20
-0.72
suggesting blend of both long formation and short
LUPIN
4763100
17.43
1680.35
-4.16
covering in last trading session.
AMBUJACEM
6562500
15.87
217.95
5.29
In Index Options front, FIIs sold of Rs. 706 crores with
BIOCON
2356200
12.21
465.50
-1.34
good amount of rise in OI. We hardly saw any
BAJFINANCE
185000
11.70
6565.70
1.17
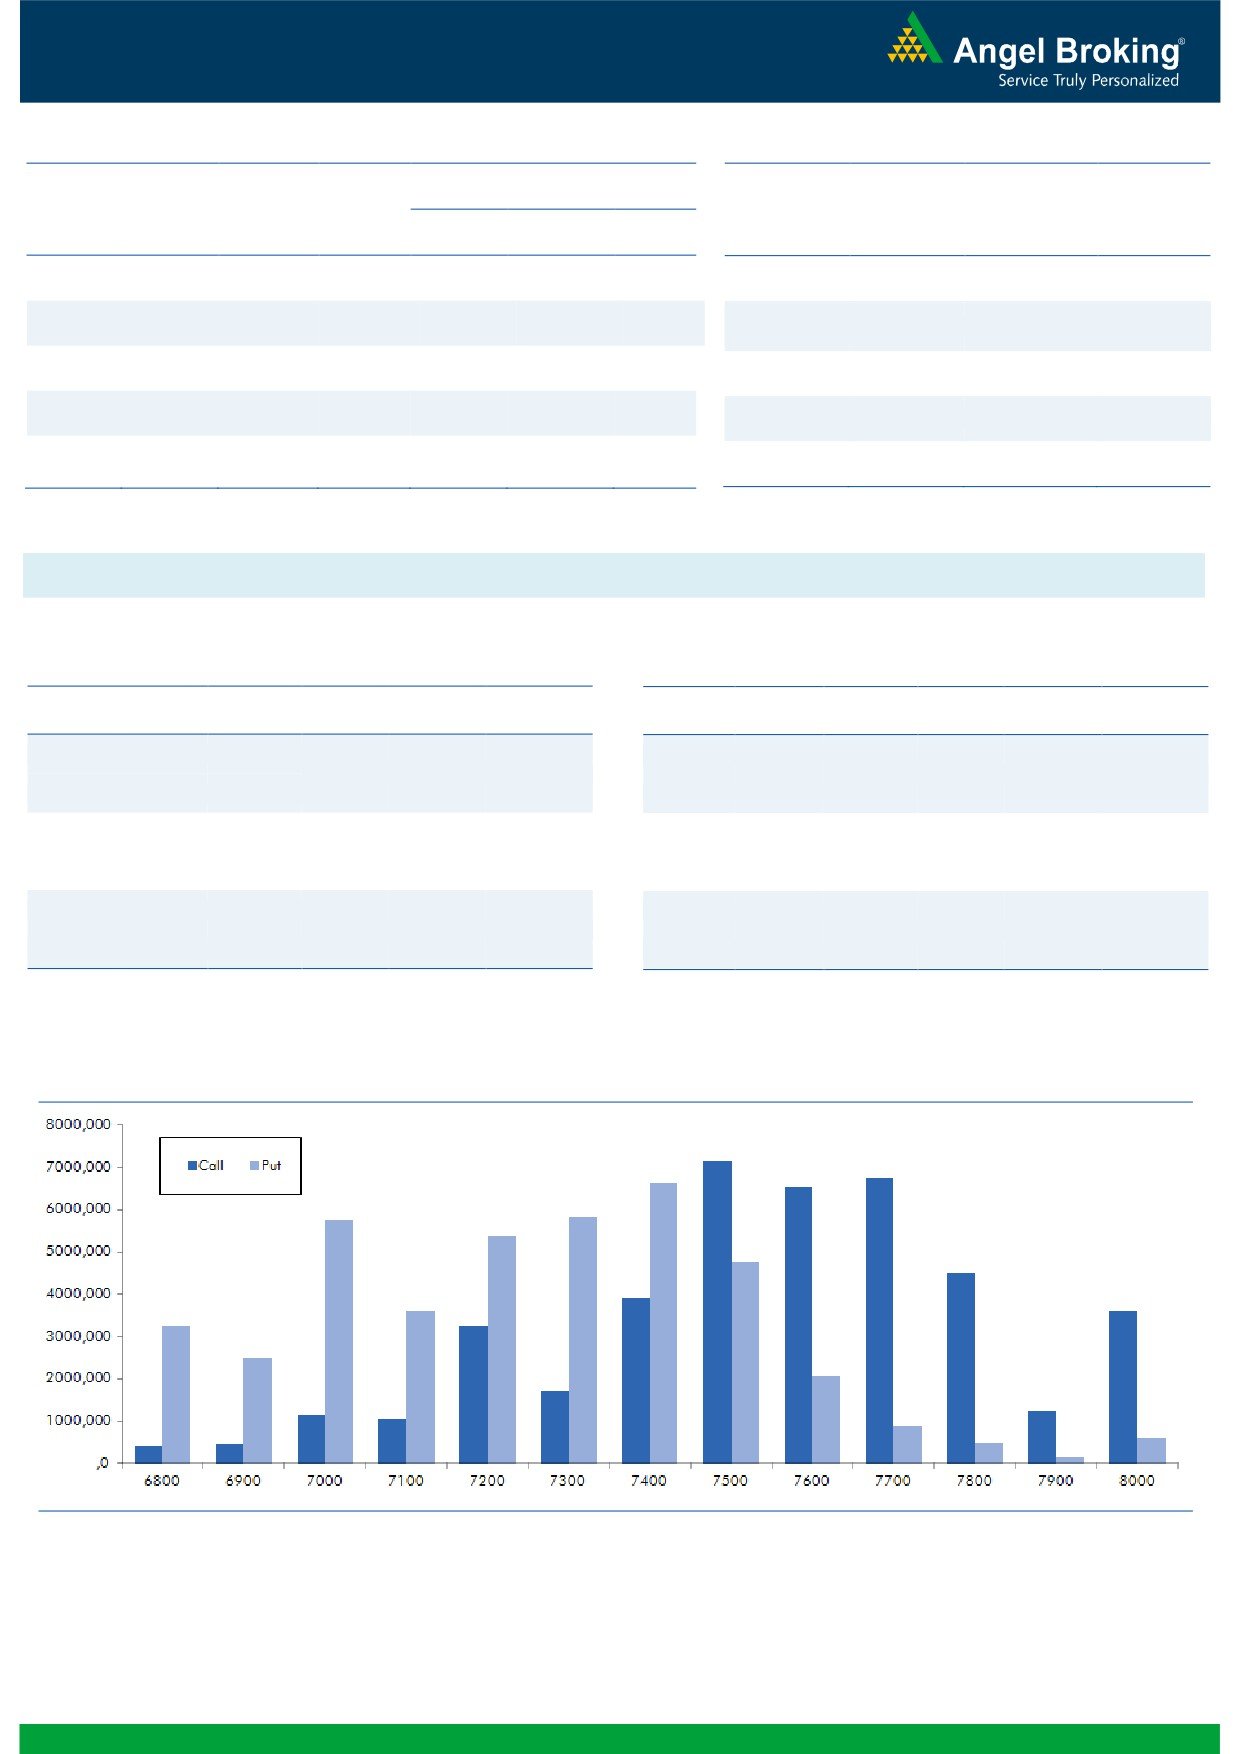
meaningful buildup in call options,
7600.strikebwasng.com
comparatively active and it also added some fresh OI.
OI Losers
While in put options, 7300, 7400 and 7600 strikes
OI
PRICE
SCRIP
OI
PRICE
added decent build-up; whereas, good amount of
CHG. (%)
CHG. (%)
unwinding was seen in 7200 put option. Maximum OI in
NCC
8672000
-12.58
72.85
1.46
current series is visible in 7500 call; while it shifted from
DIVISLAB
2449200
-6.12
974.40
0.50
7200 to 7400 strike in put options. Since, FIIs are
EICHERMOT
175950
-5.39
18010.05
-3.70
continuously pumping money in our market, we advise
INFY
9854500
-5.04
1162.90
0.44
traders to trade with positive bias.
VOLTAS
3692800
-4.71
252.50
1.79
Historical Volatility
Put-Call Ratio
SCRIP
HV
SCRIP
PCR-OI
PCR-VOL
AMBUJACEM
35.81
NIFTY
0.96
1.01
BPCL
44.84
BANKNIFTY
1.01
0.97
ACC
29.18
SBIN
0.79
0.43
TECHM
44.17
ICICIBANK
1.05
0.77
KTKBANK
42.53
RELIANCE
0.55
0.65
Strategy Date
Symbol
Strategy
Status
February 29, 2016
RELIANCE
Ratio Bull Call Spread
Active
March 05, 2016
BHEL
Long Call Ladder
Active
March 12, 2016
NIFTY
Ratio Bull Call Spread
Not Activated
2
Technical & Derivatives Report
March 18, 2016
FII Statistics for 17-March 2016
Turnover on 17-March 2016
Open Interest
No. of
Turnover
Change
Detail
Buy
Sell
Net
Instrument
Value
Change
Contracts
( in Cr. )
(%)
Contracts
(in Cr.)
(%)
INDEX
INDEX
2284.12
1692.14
591.98
336346
18560.91
1.04
366202
19322.68
7.05
FUTURES
FUTURES
INDEX
INDEX
33481.78
32776.14
705.64
1507988
83731.73
3.04
4140846
228500.80
19.21
OPTIONS
OPTIONS
STOCK
4179.20
3734.95
444.25
1039993
46770.56
0.69
STOCK
FUTURES
574023
26473.24
12.49
FUTURES
STOCK
STOCK
2392.55
2468.88
(76.34)
85693
3907.63
3.48
OPTIONS
330287
15309.52
19.06
OPTIONS
TOTAL
42337.65
40672.11
1665.53
2970020
152970.82
1.99
TOTAL
5411358
289606.24
17.67
Nifty Spot = 7512.55
Lot Size = 75
Bull-Call Spreads
Bear-Put Spreads
Action
Strike
Price
Risk
Reward
BEP
Action
Strike
Price
Risk
Reward
BEP
Buy
7600
44.60
Buy
7400
45.90
26.25
73.75
7626.25
20.75
79.25
7379.25
Sell
7700
18.35
Sell
7300
25.15
Buy
7600
44.60
Buy
7400
45.90
38.30
161.70
7638.30
31.00
169.00
7369.00
Sell
7800
6.30
Sell
7200
14.90
Buy
7700
18.35
Buy
7300
25.15
12.05
87.95
7712.05
10.25
89.75
7289.75
Sell
7800
6.30
Sell
7200
14.90
Note: Above mentioned Bullish or Bearish Spreads in Nifty (March Series) are given as an information and not as a recommendation.
Nifty Put-Call Analysis
3
Technical & Derivatives Report
March 18, 2016
Daily Pivot Levels for Nifty 50 Stocks
Scrips
S2
S1
PIVOT
R1
R2
ACC
1,227
1,250
1,267
1,291
1,308
ADANIPORTS
227
231
235
240
244
AMBUJACEM
203
210
215
223
228
ASIANPAINT
860
866
871
877
882
AXISBANK
420
424
430
434
439
BAJAJ-AUTO
2,235
2,252
2,268
2,285
2,301
BANKBARODA
138
140
143
146
149
BHARTIARTL
330
335
344
349
357
BHEL
105
108
110
113
115
BOSCHLTD
18,005
18,106
18,202
18,302
18,399
BPCL
809
837
853
881
897
CAIRN
150
151
153
155
157
CIPLA
512
518
528
534
543
COALINDIA
291
292
295
297
300
DRREDDY
3,072
3,099
3,132
3,159
3,192
GAIL
336
345
353
361
369
GRASIM
3,562
3,599
3,629
3,666
3,696
HCLTECH
800
808
818
826
837
HDFC
1,073
1,091
1,121
1,139
1,169
HDFCBANK
995
1,007
1,023
1,035
1,051
HEROMOTOCO
2,788
2,804
2,822
2,838
2,856
HINDALCO
79
80
82
83
85
HINDUNILVR
837
843
849
855
861
ICICIBANK
218
223
230
234
241
IDEA
98
99
100
102
103
INDUSINDBK
887
900
914
927
941
INFY
1,146
1,154
1,162
1,170
1,178
ITC
320
322
323
325
327
KOTAKBANK
638
645
651
658
664
LT
1,174
1,183
1,194
1,204
1,215
LUPIN
1,601
1,638
1,702
1,739
1,803
M&M
1,169
1,184
1,204
1,219
1,239
MARUTI
3,538
3,587
3,668
3,717
3,798
NTPC
125
126
127
128
129
ONGC
205
209
212
215
218
PNB
81
82
83
84
86
POWERGRID
135
137
138
140
142
RELIANCE
997
1,006
1,022
1,031
1,047
SBIN
183
184
187
189
191
VEDL
83
85
87
89
91
SUNPHARMA
809
818
831
840
853
TATAMOTORS
354
357
362
366
371
TATAPOWER
58
58
59
59
60
TATASTEEL
288
292
299
303
310
TCS
2,319
2,335
2,349
2,365
2,378
TECHM
464
475
483
494
502
ULTRACEMCO
2,953
2,991
3,019
3,057
3,085
WIPRO
531
535
540
544
548
YESBANK
778
789
804
815
830
ZEEL
379
383
388
392
397
4
Technical & Derivatives Report
March 18, 2016
Research Team Tel: 022 - 39357800
For Technical Queries
For Derivatives Queries
DISCLAIMER
Angel Broking Private Limited (hereinafter referred to as “Angel”) is a registered Member of National Stock Exchange of India Limited,
Bombay Stock Exchange Limited and MCX Stock Exchange Limited. It is also registered as a Depository Participant with CDSL and
Portfolio Manager with SEBI. It also has registration with AMFI as a Mutual Fund Distributor. Angel Broking Private Limited is a
registered entity with SEBI for Research Analyst in terms of SEBI (Research Analyst) Regulations, 2014 vide registration number
INH000000164. Angel or its associates has not been debarred/ suspended by SEBI or any other regulatory authority for accessing
/dealing in securities Market. Angel or its associates including its relatives/analyst do not hold any financial interest/beneficial
ownership of more than 1% in the company covered by Analyst. Angel or its associates/analyst has not received any compensation /
managed or co-managed public offering of securities of the company covered by Analyst during the past twelve months. Angel/analyst
has not served as an officer, director or employee of company covered by Analyst and has not been engaged in market making activity
of the company covered by Analyst.
This document is solely for the personal information of the recipient, and must not be singularly used as the basis of any investment
decision. Nothing in this document should be construed as investment or financial advice. Each recipient of this document should
make such investigations as they deem necessary to arrive at an independent evaluation of an investment in the securities of the
companies referred to in this document (including the merits and risks involved), and should consult their own advisors to determine
Reports based on technical and derivative analysis center on studying charts of a stock's price movement, outstanding positions and
trading volume, as opposed to focusing on a company's fundamentals and, as such, may not match with a report on a company's
fundamentals.
The information in this document has been printed on the basis of publicly available information, internal data and other reliable
sources believed to be true, but we do not represent that it is accurate or complete and it should not be relied on as such, as this
document is for general guidance only. Angel Broking Pvt. Limited or any of its affiliates/ group companies shall not be in any way
responsible for any loss or damage that may arise to any person from any inadvertent error in the information contained in this report.
Angel Broking Pvt. Limited has not independently verified all the information contained within this document. Accordingly, we cannot
testify, nor make any representation or warranty, express or implied, to the accuracy, contents or data contained within this document.
While Angel Broking Pvt. Limited endeavors to update on a reasonable basis the information discussed in this material, there may be
regulatory, compliance, or other reasons that prevent us from doing so.
This document is being supplied to you solely for your information, and its contents, information or data may not be reproduced,
redistributed or passed on, directly or indirectly.
Neither Angel Broking Pvt. Limited, nor its directors, employees or affiliates shall be liable for any loss or damage that may arise from
or in connection with the use of this information.
Note: Please refer to the important ‘Stock Holding Disclosure' report on the Angel website (Research Section). Also, please refer to the
latest update on respective stocks for the disclosure status in respect of those stocks. Angel Broking Pvt. Limited and its affiliates may
have investment positions in the stocks recommended in this report.
5