Technical & Derivatives Report
January 18, 2016
Sensex (24455) / Nifty (7438)
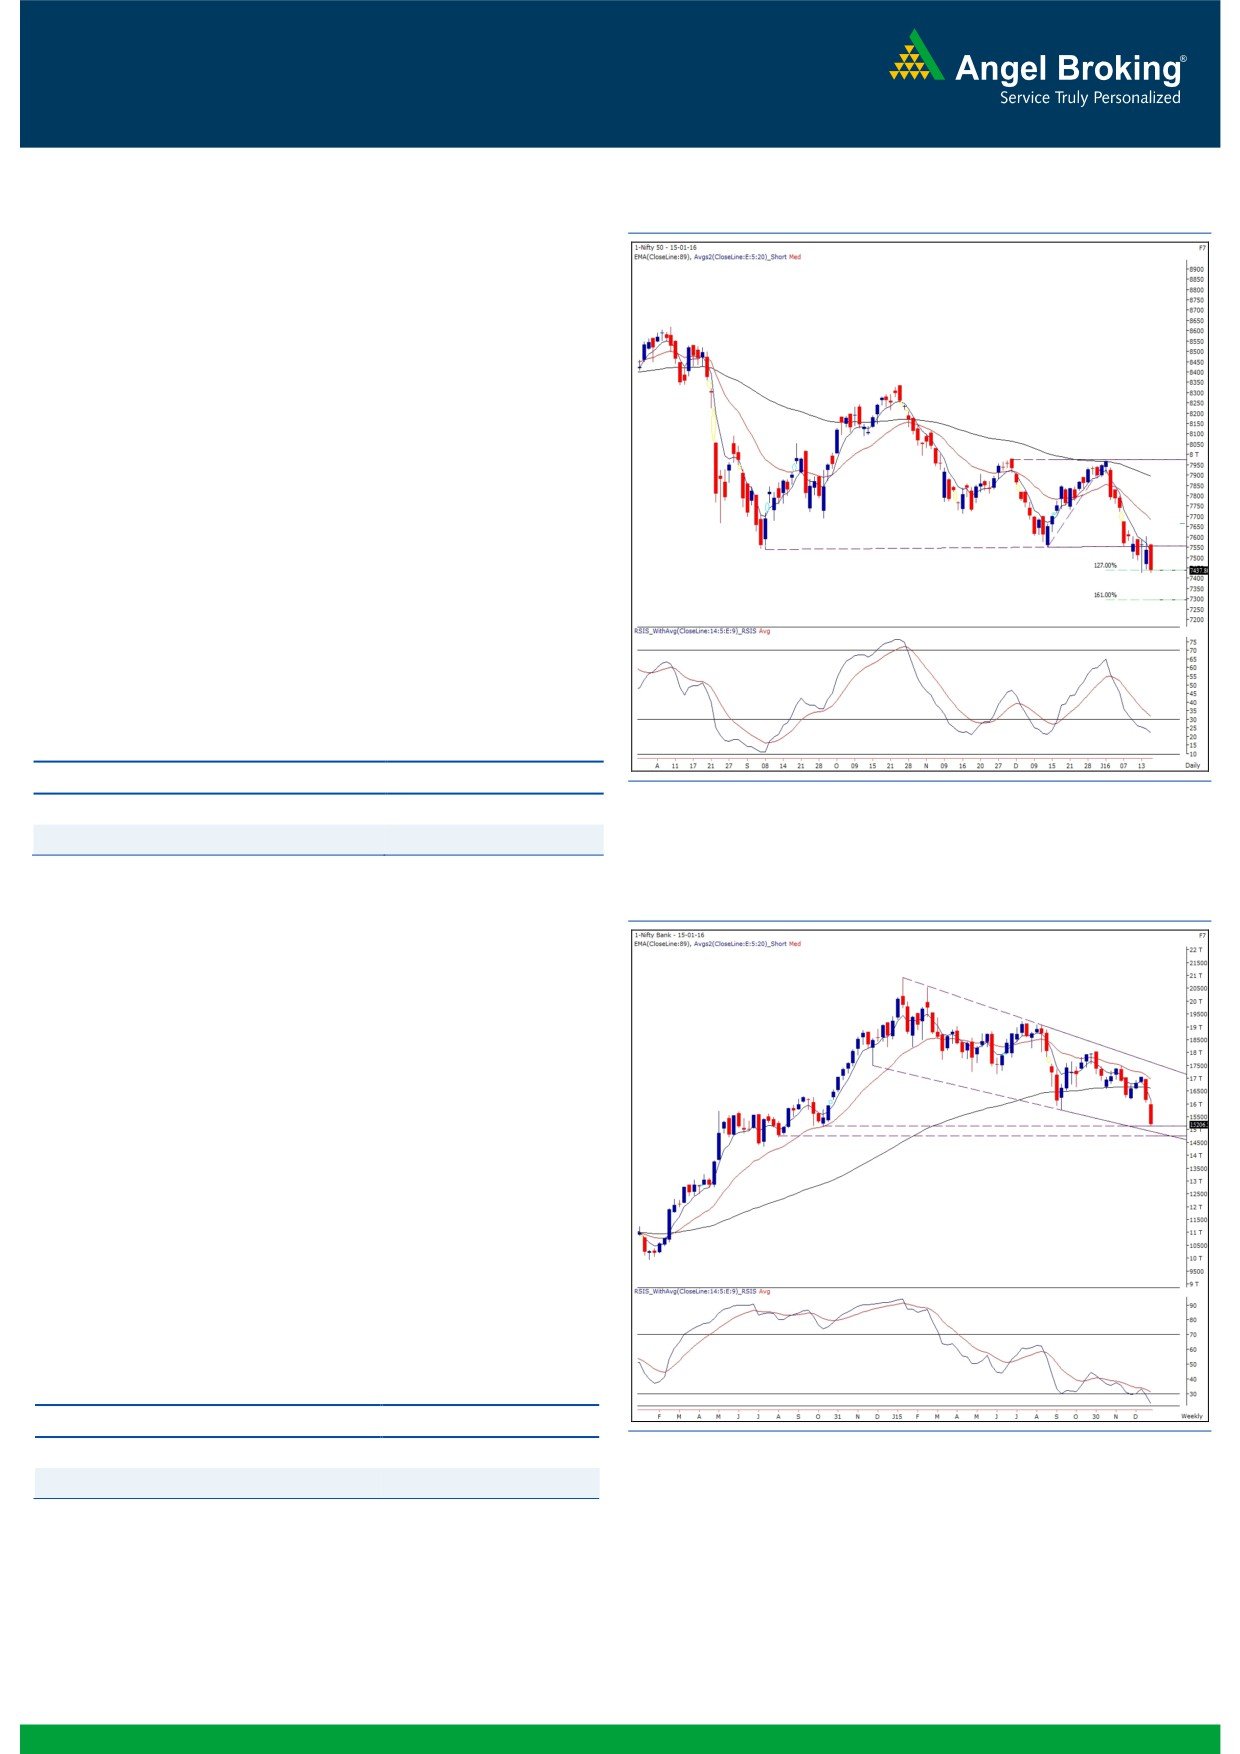
Exhibit 1: Nifty Daily Chart
On the concluding session of the week, the bears tightened
their strangle and in a show of dominance, dragged the Nifty
to close well below the 7500 mark. The Nifty has ended the
week at a 19-month closing low and yet there are no signs of
any reversal patterns being seen on the charts. We have often
been highlighting the ‘Falling Channel’ in which the index has
been trading since the last 10 months and post the recent fall,
the index is fast approaching the lower end of the channel.
The next strong support levels stand at 7340 - 7300.
This support coincides with the 161% Fibonacci retracement
level of the recent up move from 7551.05 to 7972.55. Hence,
it would be advisable to cover short positions at the mentioned
support zone and wait for further market developments. Any
reversal pattern if formed around the support could lead to an
up move in the Nifty up to the resistance zone of 7600 -
7620.
Key Levels
Support 1 - 7340
Resistance 1 - 7570
Support 2 - 7300
Resistance 2 - 7600
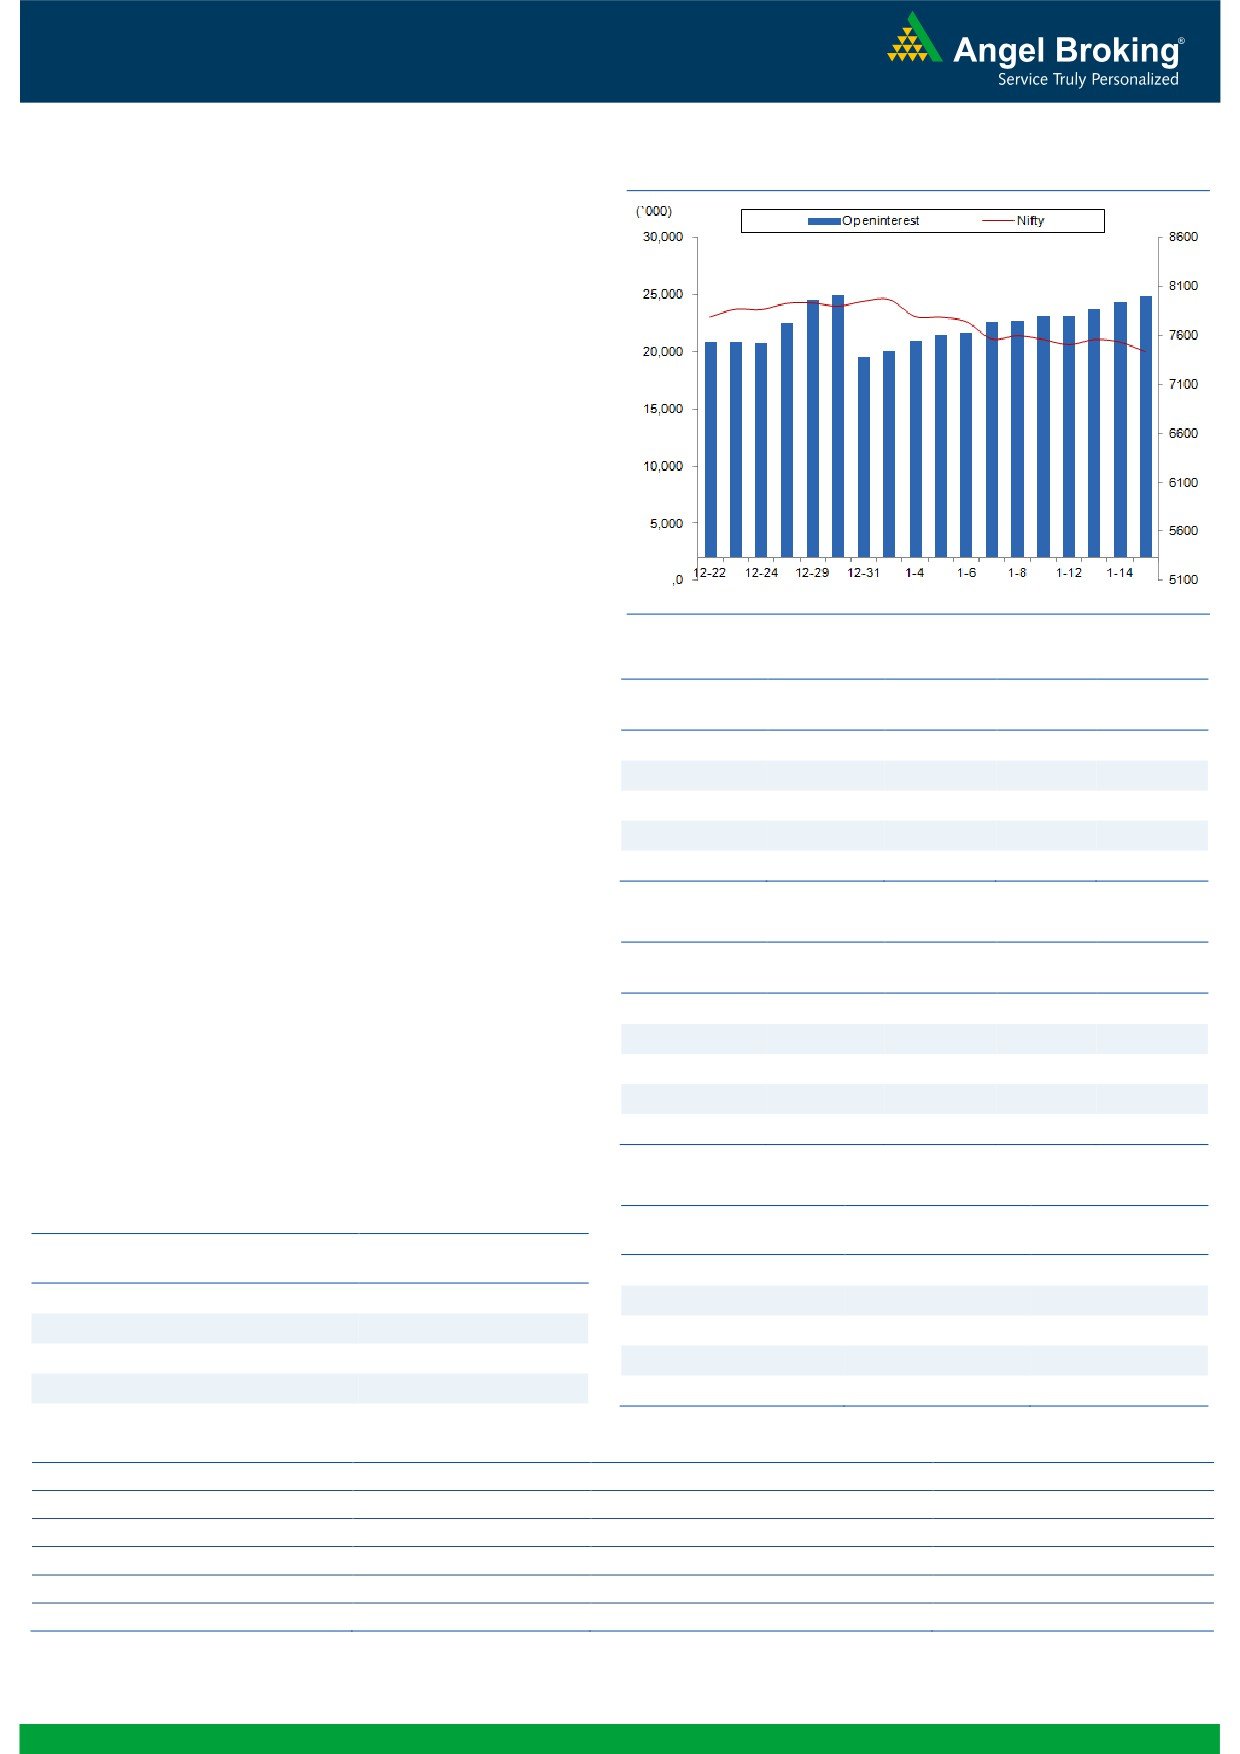
Exhibit 2: Bank Nifty Weekly Chart
Bank Nifty Outlook - (15206)
The Nifty Bank index opened on a flat note on Friday and
started correcting from the initial trades. The banking index
continued to move lower throughout the session. However, the
fall gets accelerated in the concluding hour of the session and
as a result the Nifty Bank index closed with the loss of 2.58
percent. The banking index underperformed the benchmark
indices on weekly basis too, by giving close with the deep cut
of 5.80 percent.
At current juncture, there is no sign of reversal seen on charts;
thus, one should not try to catch the falling knife. Going
forward, the immediate support for the Nifty Bank index is
placed at 15100 and 14750 levels. On the upside, 15455
and 15650 levels will now act as a crucial resistance for the
index. Traders are advised to wait for further development on
charts to initiate any fresh position in the index.
Key Levels
Support 1 - 15100
Resistance 1 - 15455
Support 2 - 14750
Resistance 2 - 15650
1
Technical & Derivatives Report
January 18, 2016
Comments
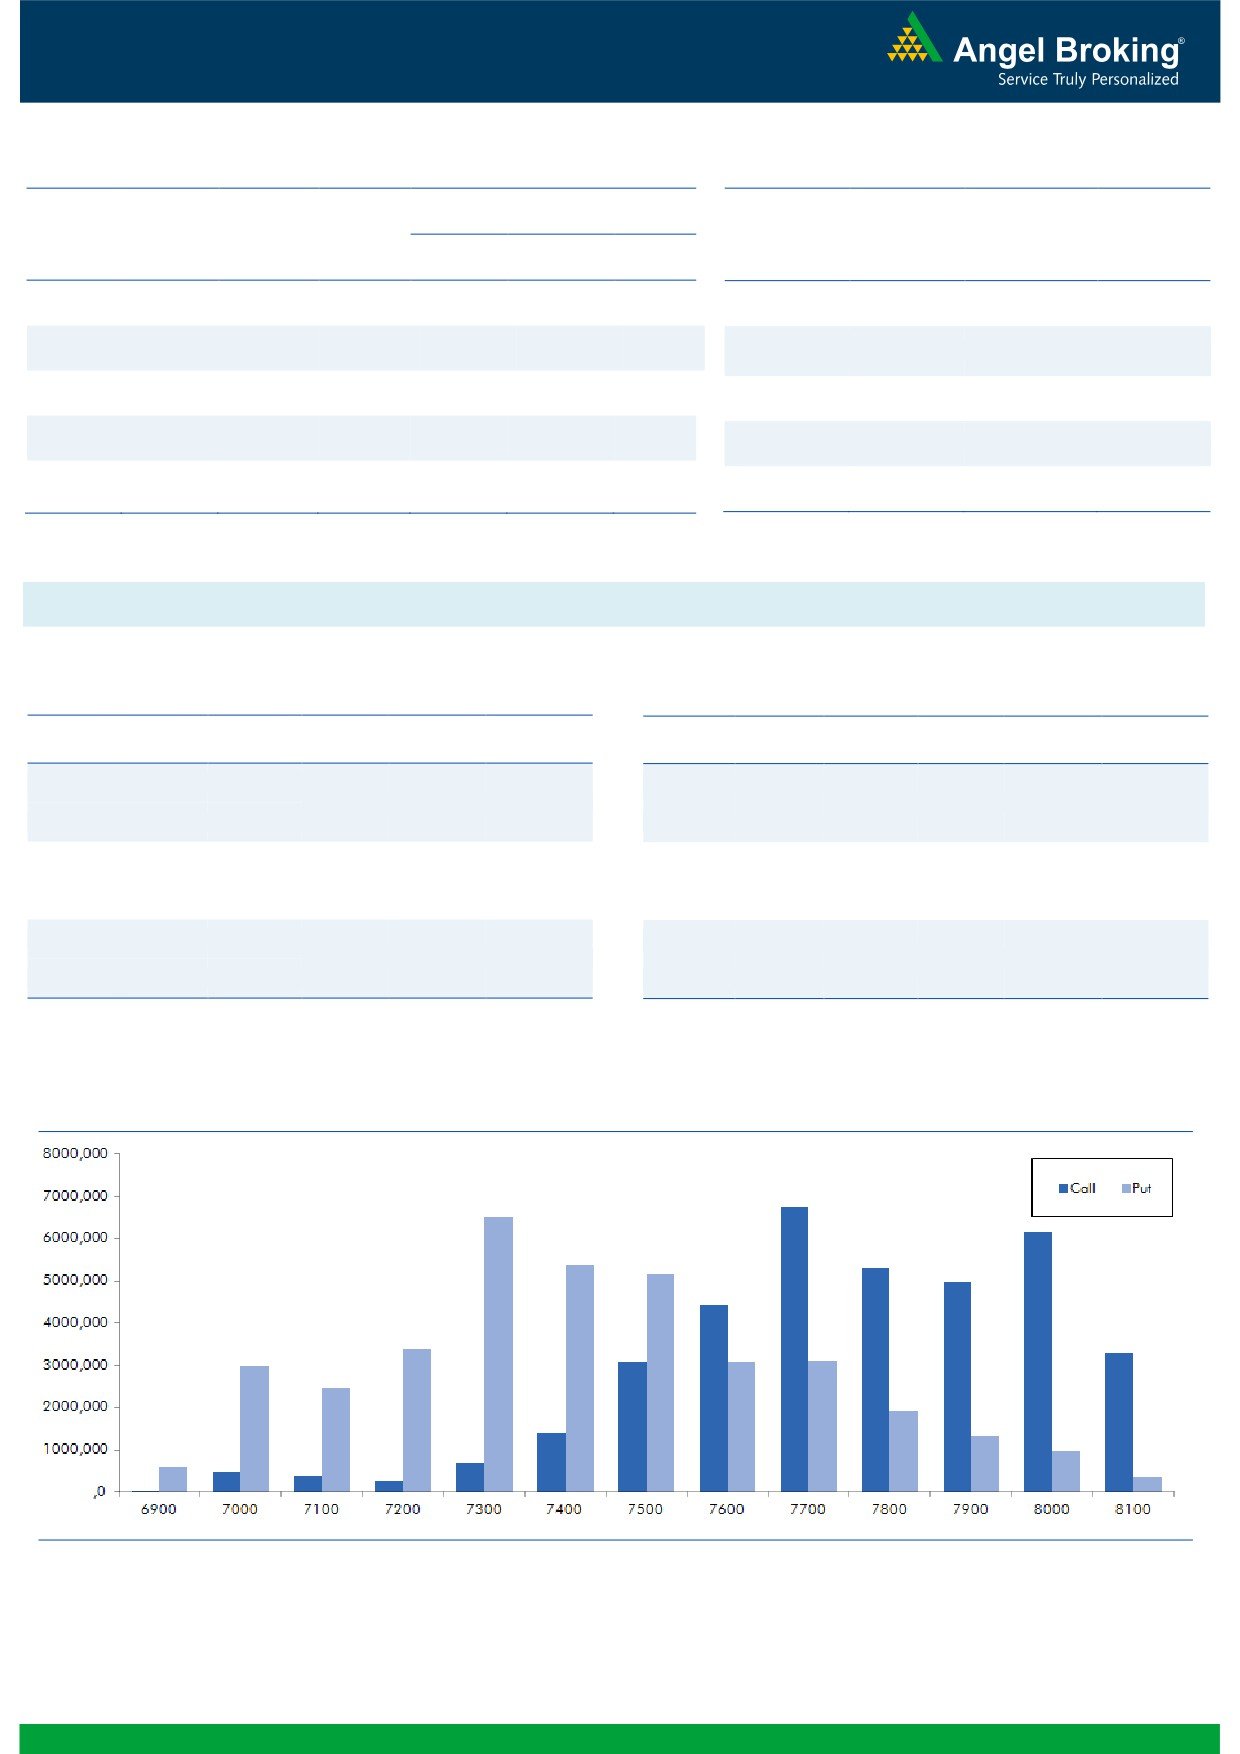
Nifty Vs OI
The Nifty futures open interest has increased by 2.16%
BankNifty futures open interest has increased by 5.97%
as market closed at 7437.80 levels.
The Nifty January future closed at a premium of 8.45
points against a premium of 3.75 points. The February
series closed at a premium of 28.55 points.
The Implied Volatility of at the money options has
increased from 17.60% to 18.31 %.
The total OI of the market is Rs. 2,44,942/- cr. and the
stock futures OI is Rs. 62,567/- cr.
Few of the liquid counters where we have seen high cost
of carry are ADANIPOWER, ENGINERSIN, LICHSGFIN,
ASIANPAINT and NTPC.
OI Gainers
Views
OI
PRICE
In equity segment, FIIs were net sellers to the tune of Rs.
SCRIP
OI
PRICE
CHG. (%)
CHG. (%)
1123 crores. In Index Futures, they were net buyers of
HINDUNILVR
4176600
11.68
804.30
-2.82
worth Rs. 158 with good amount of rise in OI, which
BPCL
5923800
9.51
929.75
2.28
suggest blend of both long and short formations in last
HCLTECH
7222800
8.30
837.55
1.23
trading session.
IOB
18746000
7.72
25.10
-9.06
In Index Options front, they sold of Rs. 1087 crores with
ASIANPAINT
5587200
7.06
882.90
-1.30
rise in open interest. In call options, 7600 & 7700 strikes
added decent OI, followed by unwinding in 7900 call
OI Losers
options. While in put options, decent unwinding was
OI
PRICE
witness in
7500 strike price. Maximum build-up in
SCRIP
OI
PRICE
CHG. (%)
CHG. (%)
current series is visible in 7700 call and 7300 put
BANKINDIA
31458000
-11.26
91.05
-2.36
options. In this correction, we are hardly witnessing any
PIDILITIND
632000
-10.86
554.70
-0.46
meaningful short formation in Nifty. We don’t expect
INDIACEM
29238000
-10.14
87.85
-9.94
major downside from current levels, avoid forming
RELCAPITAL
12241500
-8.93
373.15
-9.36
shorts.
ABIRLANUVO
957750
-8.42
2014.50
-1.89
Put-Call Ratio
Historical Volatility
SCRIP
PCR-OI
PCR-VOL
SCRIP
HV
NIFTY
0.82
0.81
WOCKPHARMA
88.62
BANKNIFTY
0.70
0.61
STAR
47.15
SBIN
0.33
0.39
IOB
58.44
INFY
0.99
0.69
SOUTHBANK
32.63
LT
0.42
0.40
TORNTPHARM
36.94
Strategy Date
Symbol
Strategy
Status
January 04, 2016
SBIN
Ratio Bear Put Spread
Active
January 11, 2016
TCS
Short Strangle
Active
2
Technical & Derivatives Report
January 18, 2016
FII Statistics for 15-January 2015
Turnover on 15-January 2015
Open Interest
No. of
Turnover
Change
Detail
Buy
Sell
Net
Instrument
Value
Change
Contracts
( in Cr. )
(%)
Contracts
(in Cr.)
(%)
INDEX
INDEX
1992.94
1834.87
158.07
300995
16055.32
3.67
318059
16761.18
-24.04
FUTURES
FUTURES
INDEX
INDEX
37978.27
39065.27
(1087.00)
1380004
75549.11
4.11
3554962
198395.95
-16.17
OPTIONS
OPTIONS
STOCK
4621.74
3827.39
794.35
1097744
49461.89
0.36
STOCK
FUTURES
594002
28562.60
-2.65
FUTURES
STOCK
STOCK
3691.61
3825.34
(133.73)
88349
4066.52
5.05
OPTIONS
393946
20171.55
-15.34
OPTIONS
TOTAL
48284.56
48552.87
(268.31)
2867092
145132.83
2.62
TOTAL
4860969
263891.28
-15.39
Nifty Spot = 7437.80
Lot Size = 75
Bull-Call Spreads
Bear-Put Spreads
Action
Strike
Price
Risk
Reward
BEP
Action
Strike
Price
Risk
Reward
BEP
Buy
7500
74.45
Buy
7400
86.05
36.15
63.85
7536.15
31.55
68.45
7368.45
Sell
7600
38.30
Sell
7300
54.50
Buy
7500
74.45
Buy
7400
86.05
57.10
142.90
7557.10
52.65
147.35
7347.35
Sell
7700
17.35
Sell
7200
33.40
Buy
7600
38.30
Buy
7300
54.50
20.95
79.05
7620.95
21.10
78.90
7278.90
Sell
7700
17.35
Sell
7200
33.40
Note: Above mentioned Bullish or Bearish Spreads in Nifty (Jan. Series) are given as an information and not as a recommendation.
Nifty Put-Call Analysis
3
Technical & Derivatives Report
January 18, 2016
Daily Pivot Levels for Nifty 50 Stocks
Scrips
S2
S1
PIVOT
R1
R2
ACC
1,191
1,210
1,243
1,262
1,294
ADANIPORTS
208
213
221
226
234
AMBUJACEM
189
191
195
198
202
ASIANPAINT
862
871
883
891
903
AXISBANK
353
364
380
390
407
BAJAJ-AUTO
2,278
2,300
2,335
2,357
2,392
BANKBARODA
120
123
128
131
136
BHARTIARTL
298
302
307
311
316
BHEL
129
133
139
143
149
BOSCHLTD
17,561
17,714
17,956
18,109
18,350
BPCL
892
912
930
950
967
CAIRN
111
115
122
126
133
CIPLA
595
602
609
617
624
COALINDIA
315
317
319
321
323
DRREDDY
2,900
2,918
2,941
2,959
2,983
GAIL
318
327
342
351
366
GRASIM
3,405
3,454
3,488
3,537
3,571
HCLTECH
806
822
832
848
858
HDFC
1,129
1,140
1,153
1,164
1,178
HDFCBANK
1,028
1,035
1,045
1,052
1,063
HEROMOTOCO
2,386
2,407
2,431
2,452
2,476
HINDALCO
69
70
73
74
77
HINDUNILVR
751
778
803
830
856
ICICIBANK
213
219
228
233
242
IDEA
105
109
115
119
126
INDUSINDBK
907
914
923
931
940
INFY
1,121
1,130
1,147
1,157
1,174
ITC
309
312
315
317
320
KOTAKBANK
660
668
679
686
697
LT
1,075
1,091
1,116
1,133
1,158
LUPIN
1,677
1,689
1,707
1,719
1,737
M&M
1,153
1,165
1,182
1,195
1,212
MARUTI
4,203
4,238
4,289
4,324
4,375
NTPC
130
133
139
142
148
ONGC
214
217
221
223
227
PNB
87
89
94
97
102
POWERGRID
135
137
140
142
145
RELIANCE
1,052
1,063
1,076
1,087
1,100
SBIN
171
178
188
194
205
VEDL
66
70
75
78
84
SUNPHARMA
770
779
789
797
808
TATAMOTORS
330
336
345
350
359
TATAPOWER
59
60
63
64
67
TATASTEEL
219
224
234
239
249
TCS
2,233
2,247
2,269
2,284
2,306
TECHM
503
512
521
530
539
ULTRACEMCO
2,552
2,585
2,614
2,648
2,677
WIPRO
531
537
543
549
555
YESBANK
646
655
669
678
693
ZEEL
381
392
407
418
433
4
Technical & Derivatives Report
January 18, 2016
Research Team Tel: 022 - 39357800
For Technical Queries
For Derivatives Queries
DISCLAIMER
Angel Broking Private Limited (hereinafter referred to as “Angel”) is a registered Member of National Stock Exchange of India Limited,
Bombay Stock Exchange Limited and MCX Stock Exchange Limited. It is also registered as a Depository Participant with CDSL and
Portfolio Manager with SEBI. It also has registration with AMFI as a Mutual Fund Distributor. Angel Broking Private Limited is a
registered entity with SEBI for Research Analyst in terms of SEBI (Research Analyst) Regulations, 2014 vide registration number
INH000000164. Angel or its associates has not been debarred/ suspended by SEBI or any other regulatory authority for accessing
/dealing in securities Market. Angel or its associates including its relatives/analyst do not hold any financial interest/beneficial
ownership of more than 1% in the company covered by Analyst. Angel or its associates/analyst has not received any compensation /
managed or co-managed public offering of securities of the company covered by Analyst during the past twelve months. Angel/analyst
has not served as an officer, director or employee of company covered by Analyst and has not been engaged in market making activity
of the company covered by Analyst.
This document is solely for the personal information of the recipient, and must not be singularly used as the basis of any investment
decision. Nothing in this document should be construed as investment or financial advice. Each recipient of this document should
make such investigations as they deem necessary to arrive at an independent evaluation of an investment in the securities of the
companies referred to in this document (including the merits and risks involved), and should consult their own advisors to determine
the merits and risks of such an investment.
Reports based on technical and derivative analysis center on studying charts of a stock's price movement, outstanding positions and
trading volume, as opposed to focusing on a company's fundamentals and, as such, may not match with a report on a company's
fundamentals.
The information in this document has been printed on the basis of publicly available information, internal data and other reliable
sources believed to be true, but we do not represent that it is accurate or complete and it should not be relied on as such, as this
document is for general guidance only. Angel Broking Pvt. Limited or any of its affiliates/ group companies shall not be in any way
responsible for any loss or damage that may arise to any person from any inadvertent error in the information contained in this report.
Angel Broking Pvt. Limited has not independently verified all the information contained within this document. Accordingly, we cannot
testify, nor make any representation or warranty, express or implied, to the accuracy, contents or data contained within this document.
While Angel Broking Pvt. Limited endeavors to update on a reasonable basis the information discussed in this material, there may be
regulatory, compliance, or other reasons that prevent us from doing so.
This document is being supplied to you solely for your information, and its contents, information or data may not be reproduced,
redistributed or passed on, directly or indirectly.
Neither Angel Broking Pvt. Limited, nor its directors, employees or affiliates shall be liable for any loss or damage that may arise from
or in connection with the use of this information.
Note: Please refer to the important ‘Stock Holding Disclosure' report on the Angel website (Research Section). Also, please refer to the
latest update on respective stocks for the disclosure status in respect of those stocks. Angel Broking Pvt. Limited and its affiliates may
have investment positions in the stocks recommended in this report.
5