Technical & Derivatives Report
November 17, 2016
Sensex (26299) / Nifty (8112)
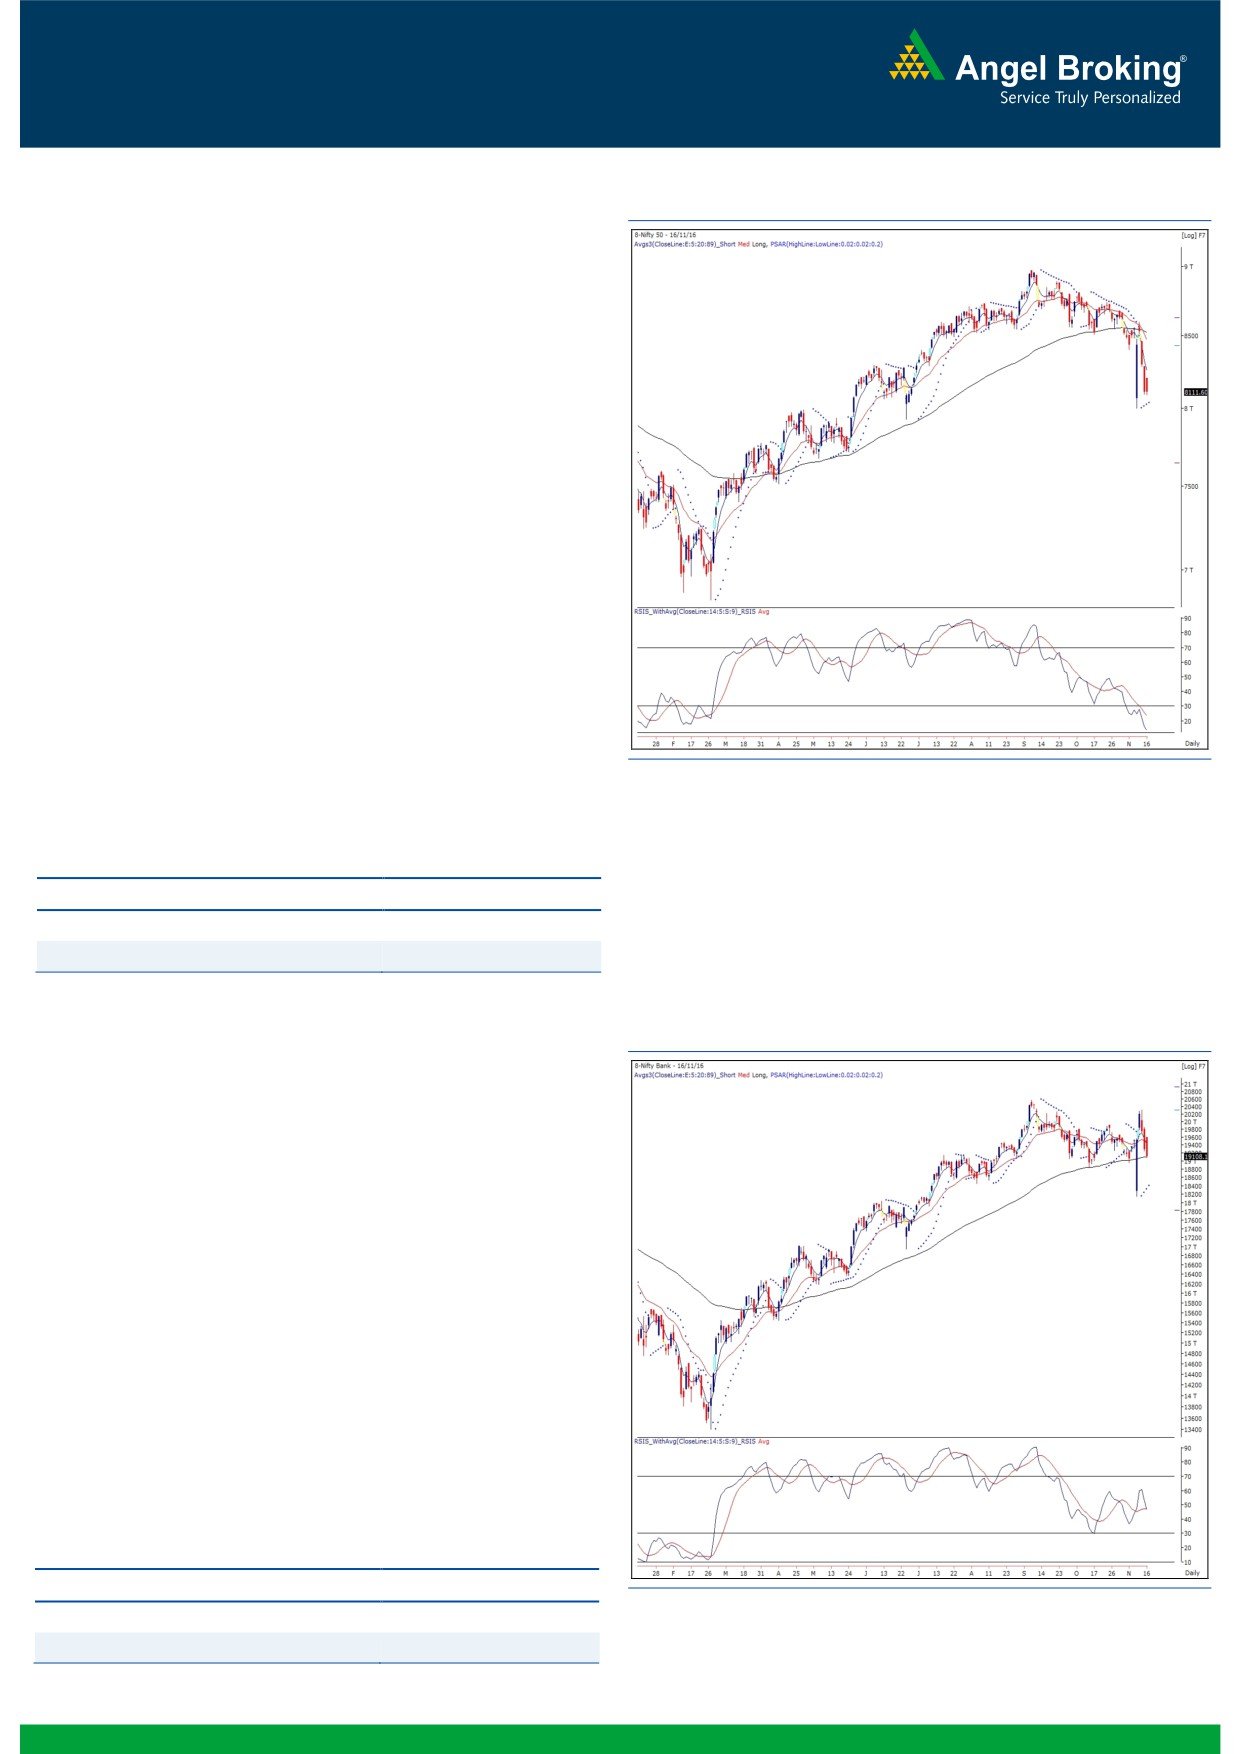
Exhibit 1: Nifty Daily Chart
Yesterday’s session opened with a decent upside gap as indicated
by the SGX Nifty. However, this lead was very short lived as we
witnessed a sharp decline in initial trades to pare down all
opening gains. Subsequently, the index consolidated for some
time with an attempt to recover from morning lows; but, once
again, a tail-end selling pressure in the broader market led to a
flat close tad above the 8100 mark.
Despite this price development, we still do not want to get carried
away by the momentum and hence, we would avoid going short
on the index at this juncture. Rather, if we combine last two day’s
candles on daily chart, we can observe a Japanese Candlestick
pattern which resembles a ‘Bullish Homing Pigeon’. As per the
requirement of this pattern, second red candle should be smaller
as compared to the previous one and importantly, its real body
should be located within the range of previous candle’s real body.
Going forward, 8080 - 8000 are seen as immediate support
levels; whereas on the other hand, a possibility of a bounce
towards 8220 - 8300 cannot be ruled out. Traders can use these
dips to create a contradictory buy call by placing a strict stop loss
below the 8000 mark.
Key Levels
Support 1 - 8080
Resistance 1 - 8220
Support 2 - 8000
Resistance 2 - 8300
Exhibit 2: Nifty Bank Daily Chart
Nifty Bank Outlook - (19108)
Tracking SGX Nifty, the Nifty Bank index too opened on a positive
note yesterday along with the broader indices. However, the bulls
were unable to carry the positive momentum and the index
corrected throughout the session to end near the day's low with
loss of 0.94%.
Although since last three sessions the Nifty Bank index had been
correcting from their opening quotes, the broader chart does not
indicate signs of any catastrophic down move. If we observe the
recent trading history, the Nifty Bank index has not breached the
crucial '89 DEMA' on closing basis in last seven months. Also, the
61.80% retracement of the up move from 18144 to 20310 is
placed around
18972. Considering the multiple technical
supports, we are expecting a pullback in the banking index from
the support zone of 19000 -
18900. On the higher side,
immediate resistance is placed at 19340 and 19460.
Key Levels
Support 1 - 19000
Resistance 1 - 19340
Support 2 - 18900
Resistance 2 - 19460
1
Technical & Derivatives Report
November 17, 2016
Comments
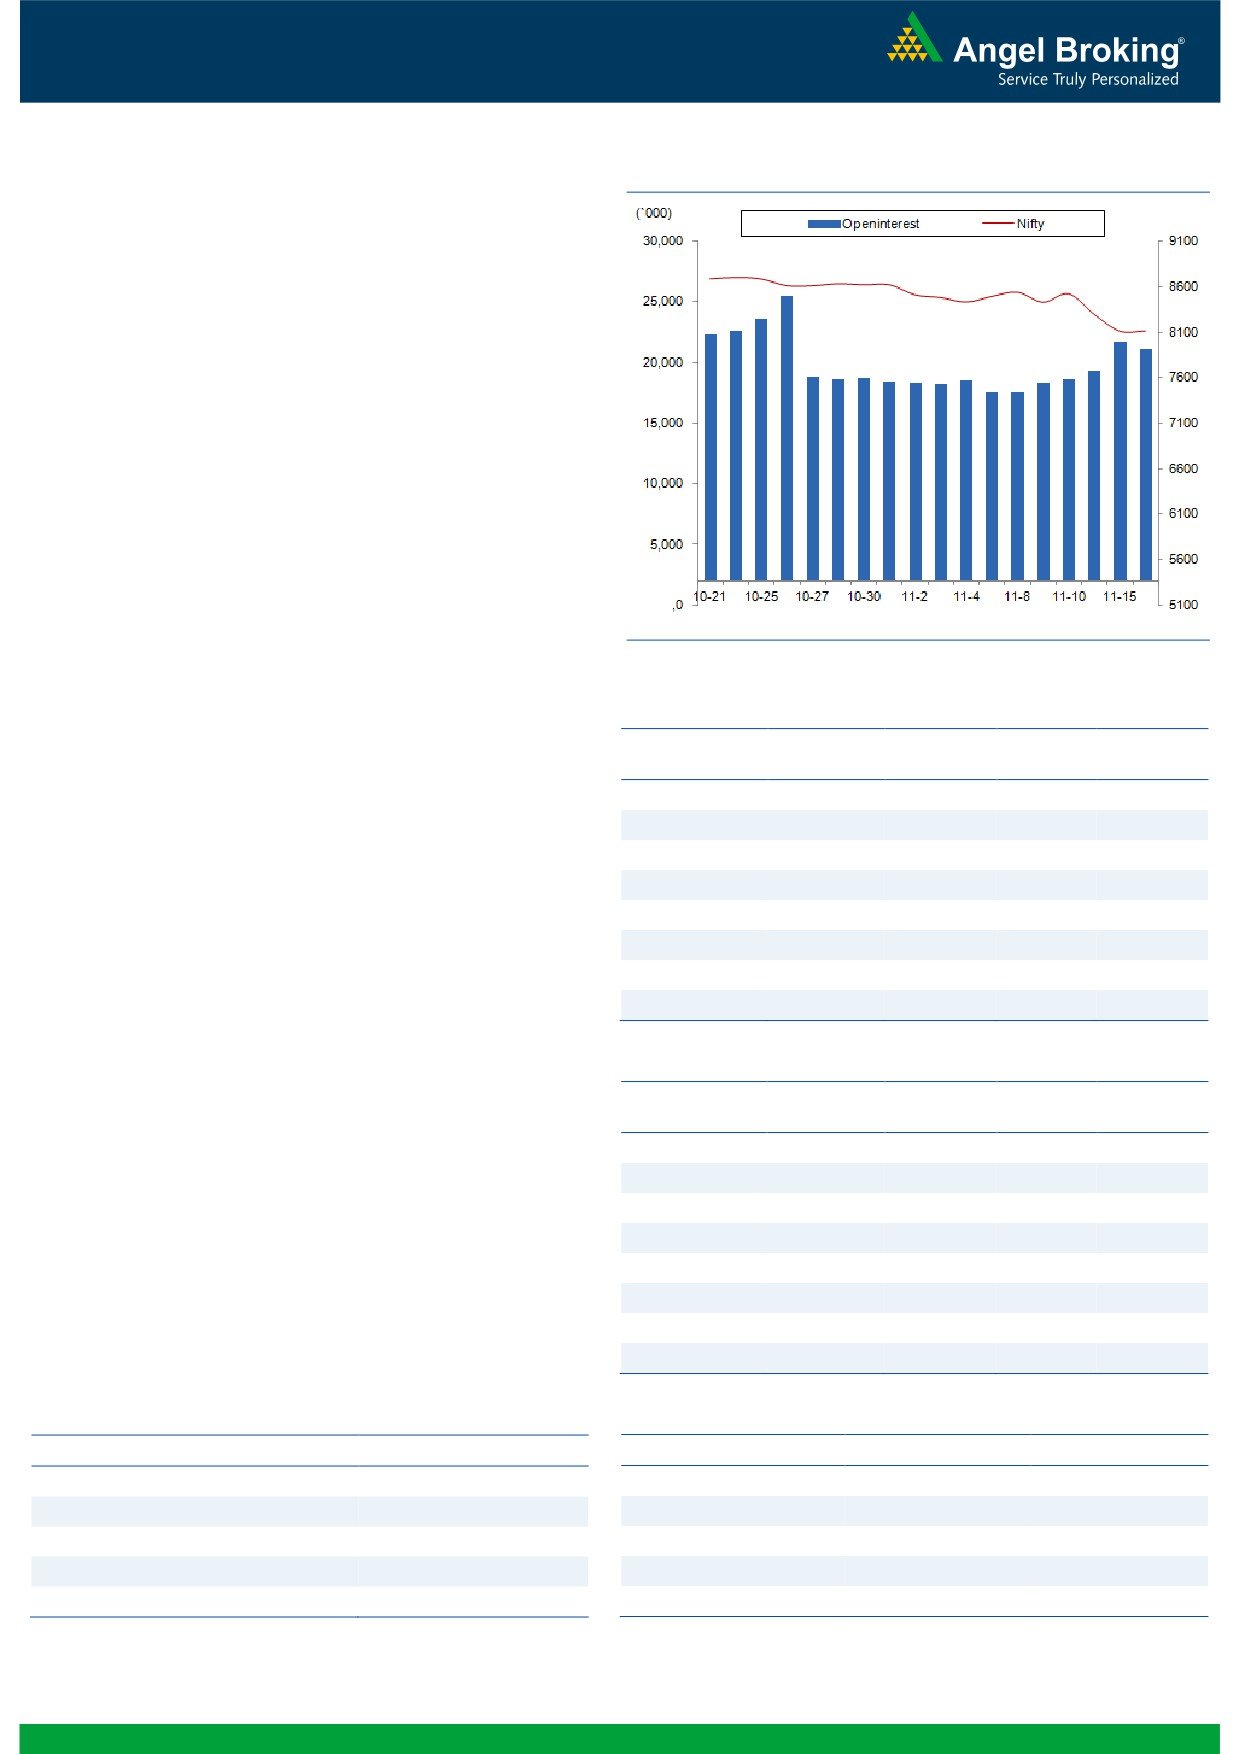
Nifty Vs OI
The Nifty futures open interest has decreased by 2.72%
BankNifty futures open interest has increased by 7.83%
as market closed at 8111.60 levels.
The Nifty November future closed with a premium of
6.95 against the premium of 31.10 points in last trading
session. The December series closed at a premium of
56.00 points.
The Implied Volatility of at the money options has
decreased from 25.45% to 22.54%. At the same time,
the PCR-OI of Nifty has increased from at 0.73 to 0.76
levels.
The total OI of the market is Rs. 2,89,347/- cr. and the
stock futures OI is Rs. 71,774/- cr.
Few of the liquid counters where we have seen high cost
of carry are JPASSOCIAT, BAJAJ-AUTO, JINDALSTEL,
SRTRANSFIN and FEDERALBNK.
Views
OI Gainers
FIIs continued their selling streak in cash segment in
OI
PRICE
SCRIP
OI
PRICE
CHG. (%)
CHG. (%)
yesterday's session too. They sold equities worth Rs. 1957
AMBUJACEM
16352500
23.02
203.00
-3.13
crores. While, in index futures, they were net buyer worth
SAIL
74052000
20.53
49.75
0.10
Rs. 94 crores with fall in open interest, indicating blend
PCJEWELLER
1006500
20.04
325.15
-8.49
of long and short unwinding in previous trading session.ing.com
CADILAHC
3265600
12.58
374.55
4.59
In Index options segment, FII were net sellers to the tune
APOLLOTYRE
9426000
11.14
184.80
-1.07
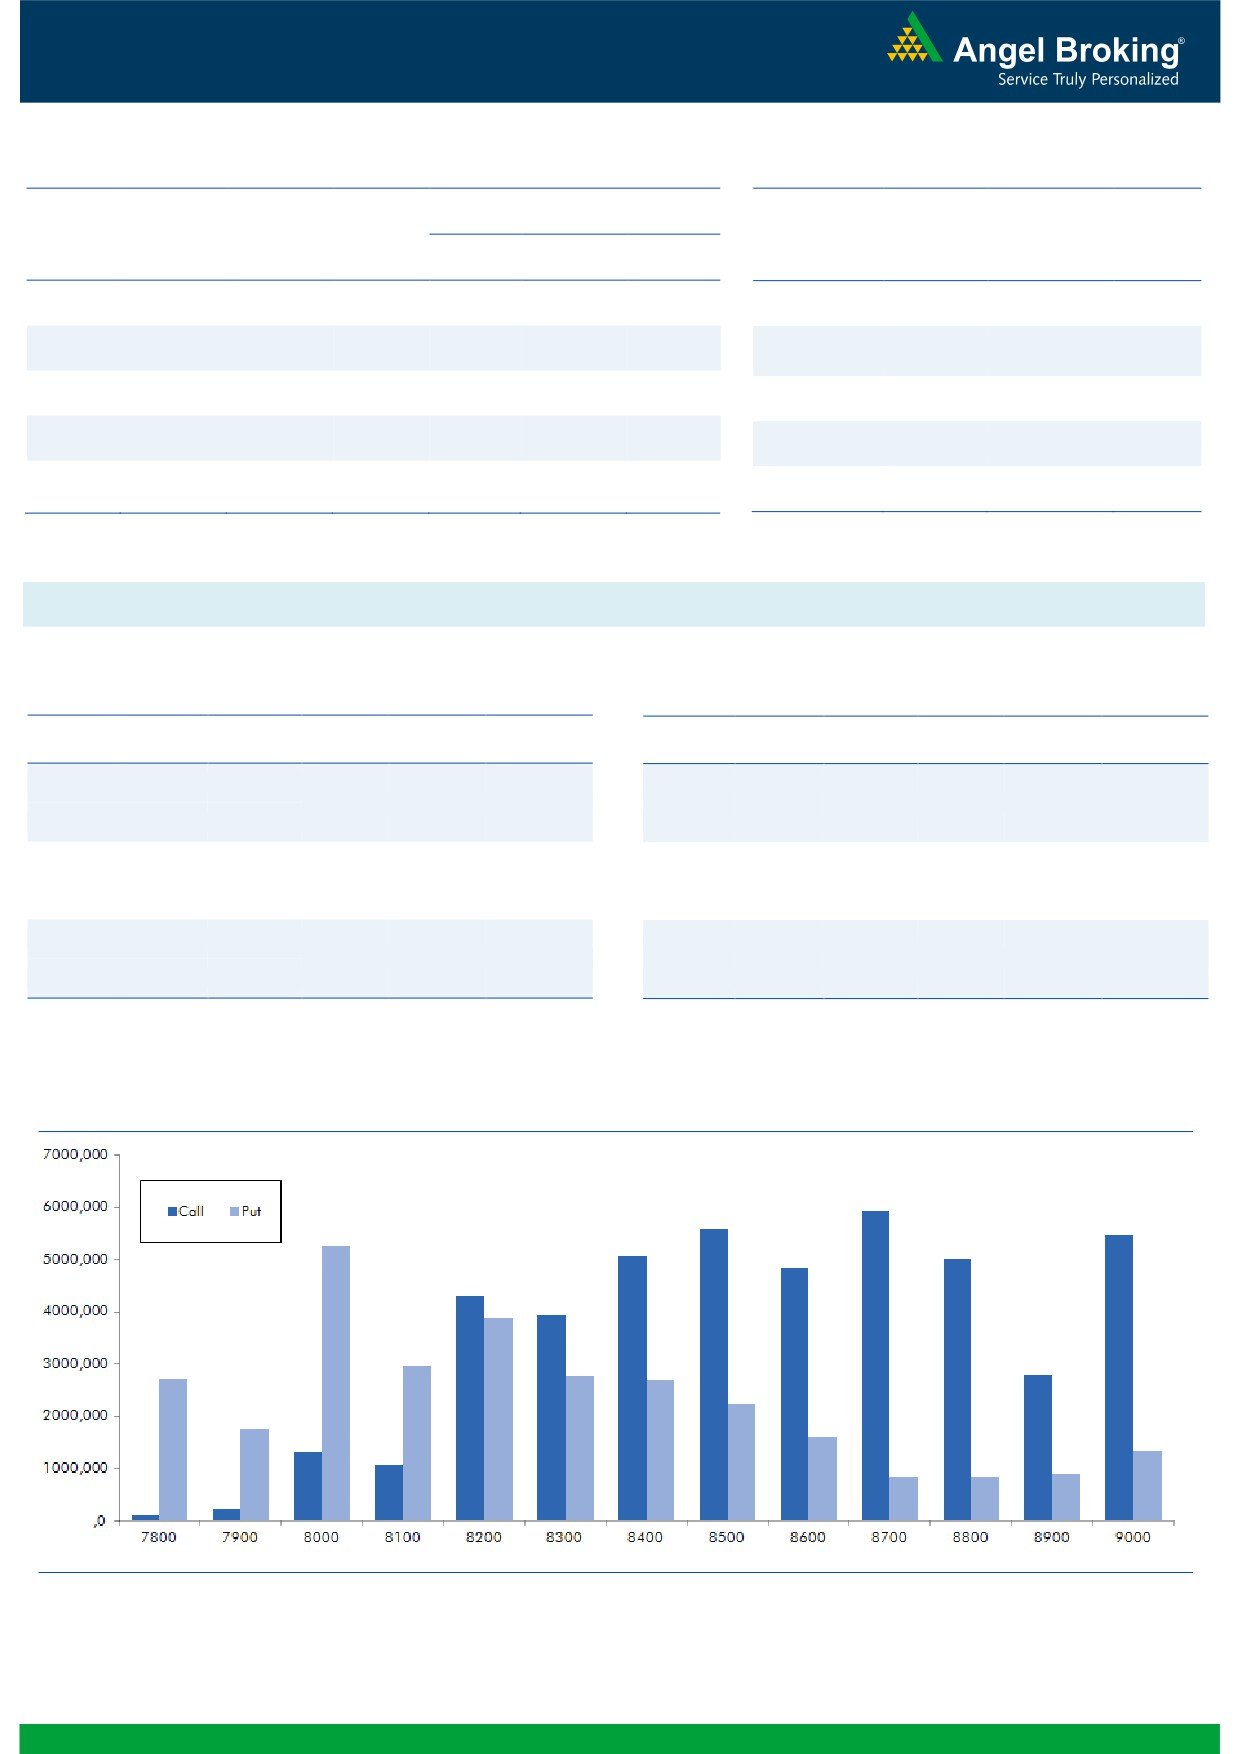
of Rs. 131 crores with rise in open interest. In call
TVSMOTOR
6402000
7.63
351.10
1.69
options, except some OI build-up in 8200 strike, we
JINDALSTEL
47484000
7.32
68.20
-3.94
witnessed decent unwinding in 8300-8700 strikes. On
INFRATEL
3522400
6.61
361.50
-1.19
the other hand, in put options, 8100 and 8000 strikes
added fresh positions; followed by unwinding in 8200
strike. Highest OI in current series is placed at 8700 call
OI Losers
and 8000 put.
OI
PRICE
SCRIP
OI
PRICE
CHG. (%)
CHG. (%)
FIIs are continuously liquidating their long positions in
BHARATFIN
6008000
-12.83
685.20
8.16
equity cash segment, which doesn't bode well for Bulls.
ULTRACEMCO
980400
-10.95
3365.80
0.07
While, some sign of relief was seen for Bulls as FIIs
PIDILITIND
1829000
-9.32
622.85
1.01
unwound some of their short positions in index futures.
TCS
5336500
-8.67
2193.95
2.83
Since, the quantum of short covering is quite low; we
INFY
13173500
-6.82
941.40
1.47
would like to wait for follow up action before pre-
LICHSGFIN
9055200
-6.75
512.00
6.52
empting any reversal. At current juncture, 8000-7970
remains good support for index and traders are advised
IDBI
37888000
-6.50
71.00
1.07
to remain light on positions.
DCBBANK
2974500
-6.37
103.15
1.48
Historical Volatility
Put-Call Ratio
SCRIP
HV
SCRIP
PCR-OI
PCR-VOL
BAJFINANCE
75.72
NIFTY
0.76
0.82
SRF
53.06
BANKNIFTY
0.65
0.69
AMARAJABAT
62.62
SBIN
0.56
0.62
MCLEODRUSS
44.71
ICICIBANK
0.46
0.46
BHARATFIN
82.65
RELIANCE
0.45
0.37
2
Technical & Derivatives Report
November 17, 2016
FII Statistics for November 16, 2016
Turnover on November 16, 2016
Open Interest
No. of
Turnover
Change
Detail
Buy
Sell
Net
Instrument
Value
Change
Contracts
( in Cr. )
(%)
Contracts
(in Cr.)
(%)
INDEX
INDEX
2894.45
2800.18
94.27
195942
12610.66
(1.65)
312410
20691.63
-23.48
FUTURES
FUTURES
INDEX
INDEX
69086.72
69217.70
(130.99)
1287365
80495.99
2.38
5300688
364023.29
-5.78
OPTIONS
OPTIONS
STOCK
9217.76
8199.11
1018.65
894518
53681.10
(0.84)
STOCK
FUTURES
604099
39827.97
-18.39
FUTURES
STOCK
STOCK
7022.94
7091.87
(68.93)
125825
8068.78
0.32
OPTIONS
448172
31180.19
-18.18
OPTIONS
TOTAL
88221.87
87308.87
913.00
2503650
154856.52
0.79
TOTAL
6665369
455723.07
-8.91
Nifty Spot = 8111.60
Lot Size = 75
Bull-Call Spreads
Bear-Put Spreads
Action
Strike
Price
Risk
Reward
BEP
Action
Strike
Price
Risk
Reward
BEP
Buy
8200
66.60
Buy
8000
67.25
33.75
66.25
8233.75
23.40
76.60
7976.60
Sell
8300
32.85
Sell
7900
43.85
Buy
8200
66.60
Buy
8000
67.25
52.65
147.35
8252.65
39.20
160.80
7960.80
Sell
8400
13.95
Sell
7800
28.05
Buy
8300
32.85
Buy
7900
43.85
18.90
81.10
8318.90
15.80
84.20
7884.20
Sell
8400
13.95
Sell
7800
28.05
Note: Above mentioned Bullish or Bearish Spreads in Nifty (November Series) are given as an information and not as a recommendation.
Nifty Put-Call Analysis
3
Technical & Derivatives Report
November 17, 2016
Daily Pivot Levels for Nifty Constituents
Scrips
S2
S1
PIVOT
R1
R2
ACC
1 273
1 306
1 341
1 373
1 408
ADANIPORTS
253
259
267
273
281
AMBUJACEM
194
198
206
210
217
ASIANPAINT
885
911
928
953
971
AUROPHARMA
664
689
723
748
782
AXISBANK
459
466
477
483
494
BAJAJ-AUTO
2 520
2 563
2 613
2 656
2 706
BANKBARODA
163
168
173
178
184
BHEL
128
130
133
135
139
BPCL
610
622
641
654
673
BHARTIARTL
300
305
308
313
316
INFRATEL
348
354
361
368
375
BOSCH
18 698
18 936
19 368
19 606
20 038
CIPLA
517
527
546
557
576
COALINDIA
305
309
313
317
321
DRREDDY
3 094
3 152
3 254
3 312
3 414
EICHERMOT
19 186
20 151
20 976
21 941
22 766
GAIL
412
420
433
441
454
GRASIM
779
798
817
836
855
HCLTECH
752
763
775
786
799
HDFCBANK
1 223
1 234
1 251
1 262
1 279
HDFC
1 204
1 230
1 248
1 273
1 291
HEROMOTOCO
2 816
2 863
2 939
2 986
3 062
HINDALCO
154
158
166
170
177
HINDUNILVR
791
800
807
816
822
ICICIBANK
256
261
270
275
284
IDEA
68
69
71
72
74
INDUSINDBK
1 055
1 075
1 096
1 116
1 136
INFY
914
927
942
956
970
ITC
222
226
233
237
244
KOTAKBANK
748
759
778
789
808
LT
1 334
1 355
1 372
1 392
1 409
LUPIN
1 353
1 380
1 418
1 444
1 482
M&M
1 186
1 212
1 245
1 271
1 304
MARUTI
4 859
4 925
4 967
5 033
5 075
NTPC
148
149
150
152
153
ONGC
263
267
276
281
290
POWERGRID
180
184
187
192
195
RELIANCE
972
979
988
995
1 004
SBIN
271
274
279
283
288
SUNPHARMA
639
653
674
688
709
TCS
2 108
2 149
2 179
2 220
2 250
TATAMTRDVR
276
284
295
303
314
TATAMOTORS
438
448
460
470
482
TATAPOWER
68
70
70
72
73
TATASTEEL
371
382
392
402
412
TECHM
427
435
442
450
457
ULTRACEMCO
3 269
3 320
3 393
3 444
3 517
WIPRO
435
440
447
453
460
YESBANK
1 106
1 144
1 172
1 209
1 237
ZEEL
450
462
472
485
495
4
Technical & Derivatives Report
November 17, 2016
Research Team Tel: 022 - 39357800
For Technical Queries
For Derivatives Queries
DISCLAIMER
Angel Broking Private Limited (hereinafter referred to as “Angel”) is a registered Member of National Stock Exchange of India Limited,
Bombay Stock Exchange Limited and Metropolitan Stock Exchange Limited. It is also registered as a Depository Participant with CDSL
and Portfolio Manager with SEBI. It also has registration with AMFI as a Mutual Fund Distributor. Angel Broking Private Limited is a
registered entity with SEBI for Research Analyst in terms of SEBI (Research Analyst) Regulations, 2014 vide registration number
INH000000164. Angel or its associates has not been debarred/ suspended by SEBI or any other regulatory authority for accessing
/dealing in securities Market. Angel or its associates/analyst has not received any compensation / managed or co-managed public
offering of securities of the company covered by Analyst during the past twelve months.
This document is solely for the personal information of the recipient, and must not be singularly used as the basis of any investment
decision. Nothing in this document should be construed as investment or financial advice. Each recipient of this document should
make such investigations as they deem necessary to arrive at an independent evaluation of an investment in the securities of the
companies referred to in this document (including the merits and risks involved), and should consult their own advisors to determine
the merits and risks of such an investment.
Reports based on technical and derivative analysis center on studying charts of a stock's price movement, outstanding positions and
trading volume, as opposed to focusing on a company's fundamentals and, as such, may not match with a report on a company's
fundamentals. Investors are advised to refer the Fundamental and Technical Research Reports available on our website to evaluate the
contrary view, if any.
The information in this document has been printed on the basis of publicly available information, internal data and other reliable
sources believed to be true, but we do not represent that it is accurate or complete and it should not be relied on as such, as this
document is for general guidance only. Angel Broking Pvt. Limited or any of its affiliates/ group companies shall not be in any way
responsible for any loss or damage that may arise to any person from any inadvertent error in the information contained in this report.
Angel Broking Pvt. Limited has not independently verified all the information contained within this document. Accordingly, we cannot
testify, nor make any representation or warranty, express or implied, to the accuracy, contents or data contained within this document.
While Angel Broking Pvt. Limited endeavors to update on a reasonable basis the information discussed in this material, there may be
regulatory, compliance, or other reasons that prevent us from doing so.
This document is being supplied to you solely for your information, and its contents, information or data may not be reproduced,
redistributed or passed on, directly or indirectly.
Neither Angel Broking Pvt. Limited, nor its directors, employees or affiliates shall be liable for any loss or damage that may arise from
or in connection with the use of this information.
5