Technical & Derivatives Report
November 17, 2015
Sensex (25760) / Nifty (7807)
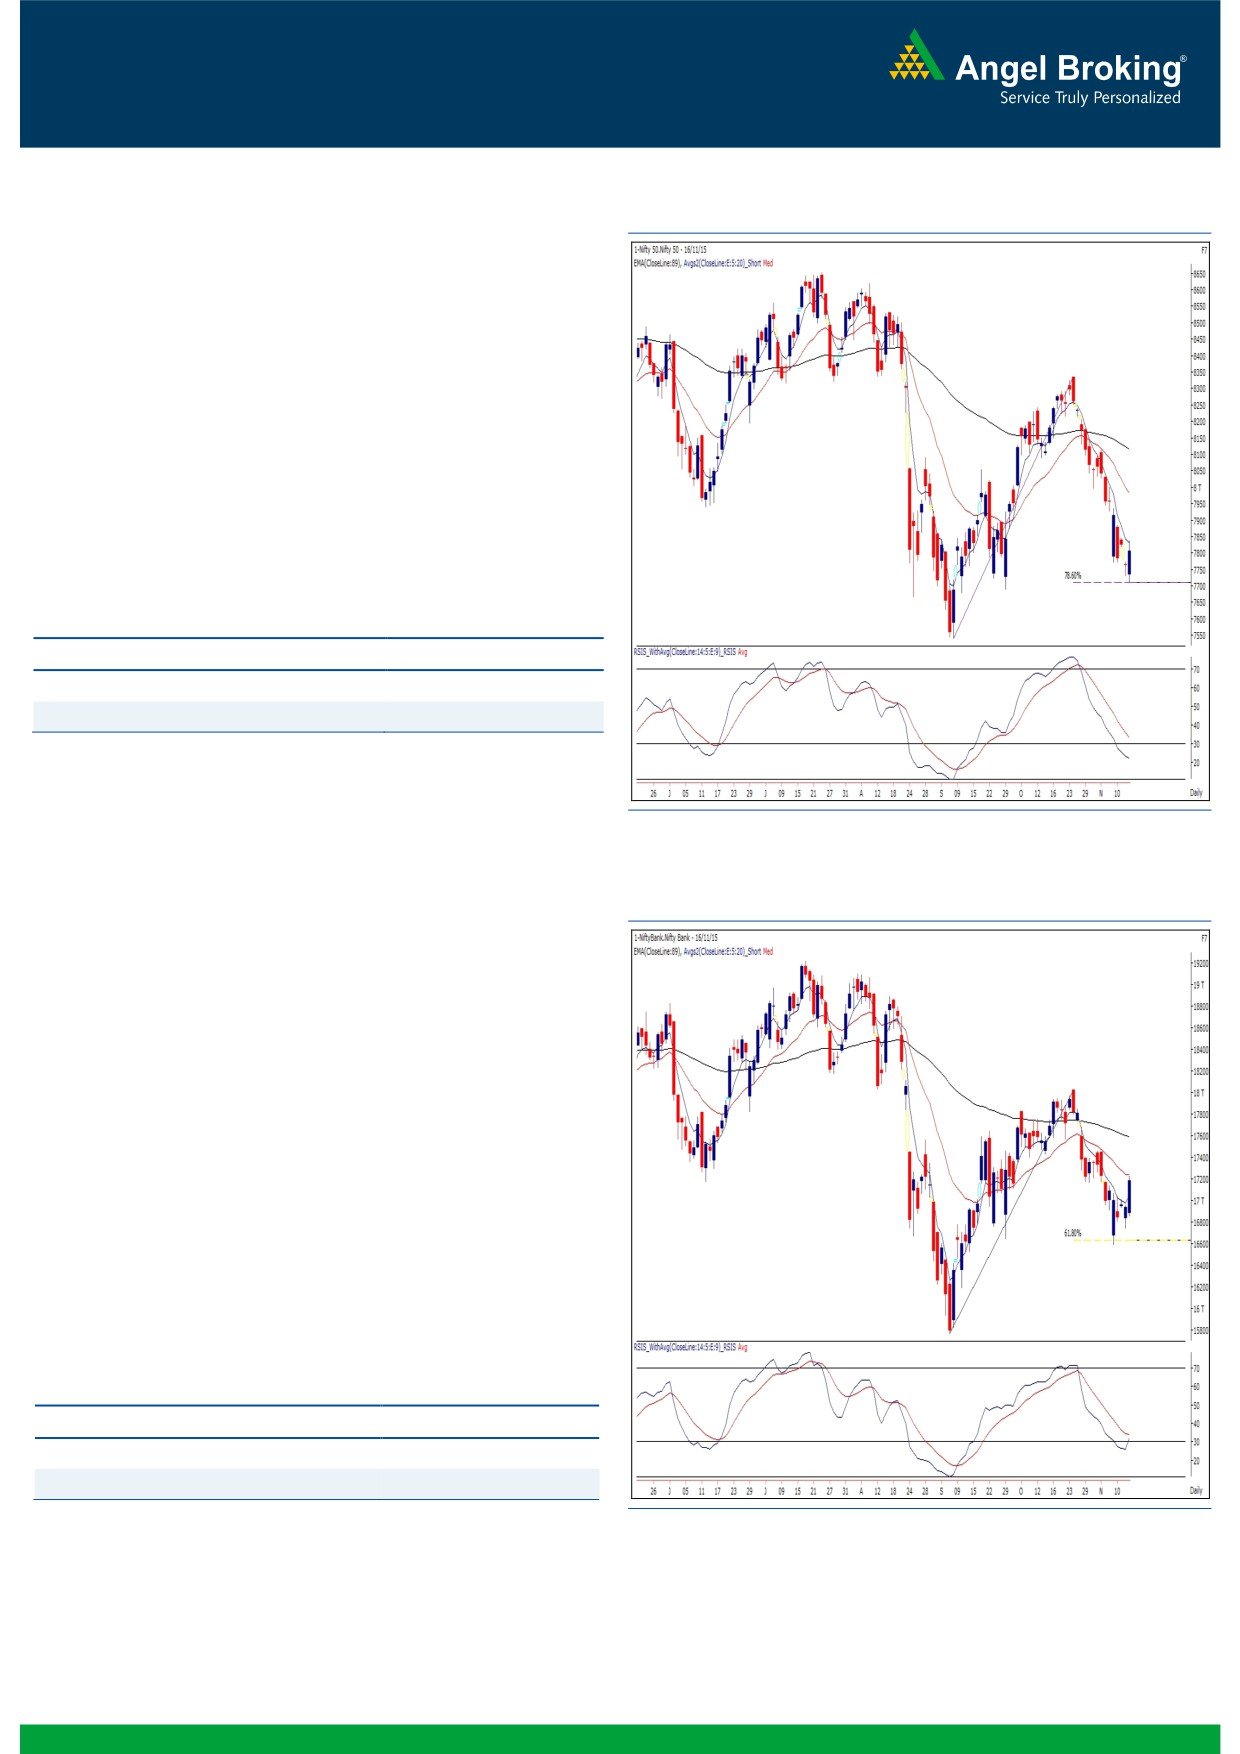
Exhibit 1: Nifty Daily Chart
Despite extremely negative cues from the global bourses, our
markets opened slightly lower. After a small dip in the initial
hour, we witnessed a smart recovery throughout the remaining
part of the day to regain the 7800 mark.
In line with our expectation, the Nifty managed to hold the
7700 mark, which resulted into a decent intraday rally. Our
markets clearly showed their outperformance over the global
bourses by shrugging off all negative developments.
Considering the chart structure, we expect this bounce to get
extended towards 7850 - 7900 levels. On the flipside, 7700
remains to be a strong as well as crucial support for the index.
Key Levels
Support 1 - 7750
Resistance 1 - 7850
Support 2 - 7700
Resistance 2 - 7900
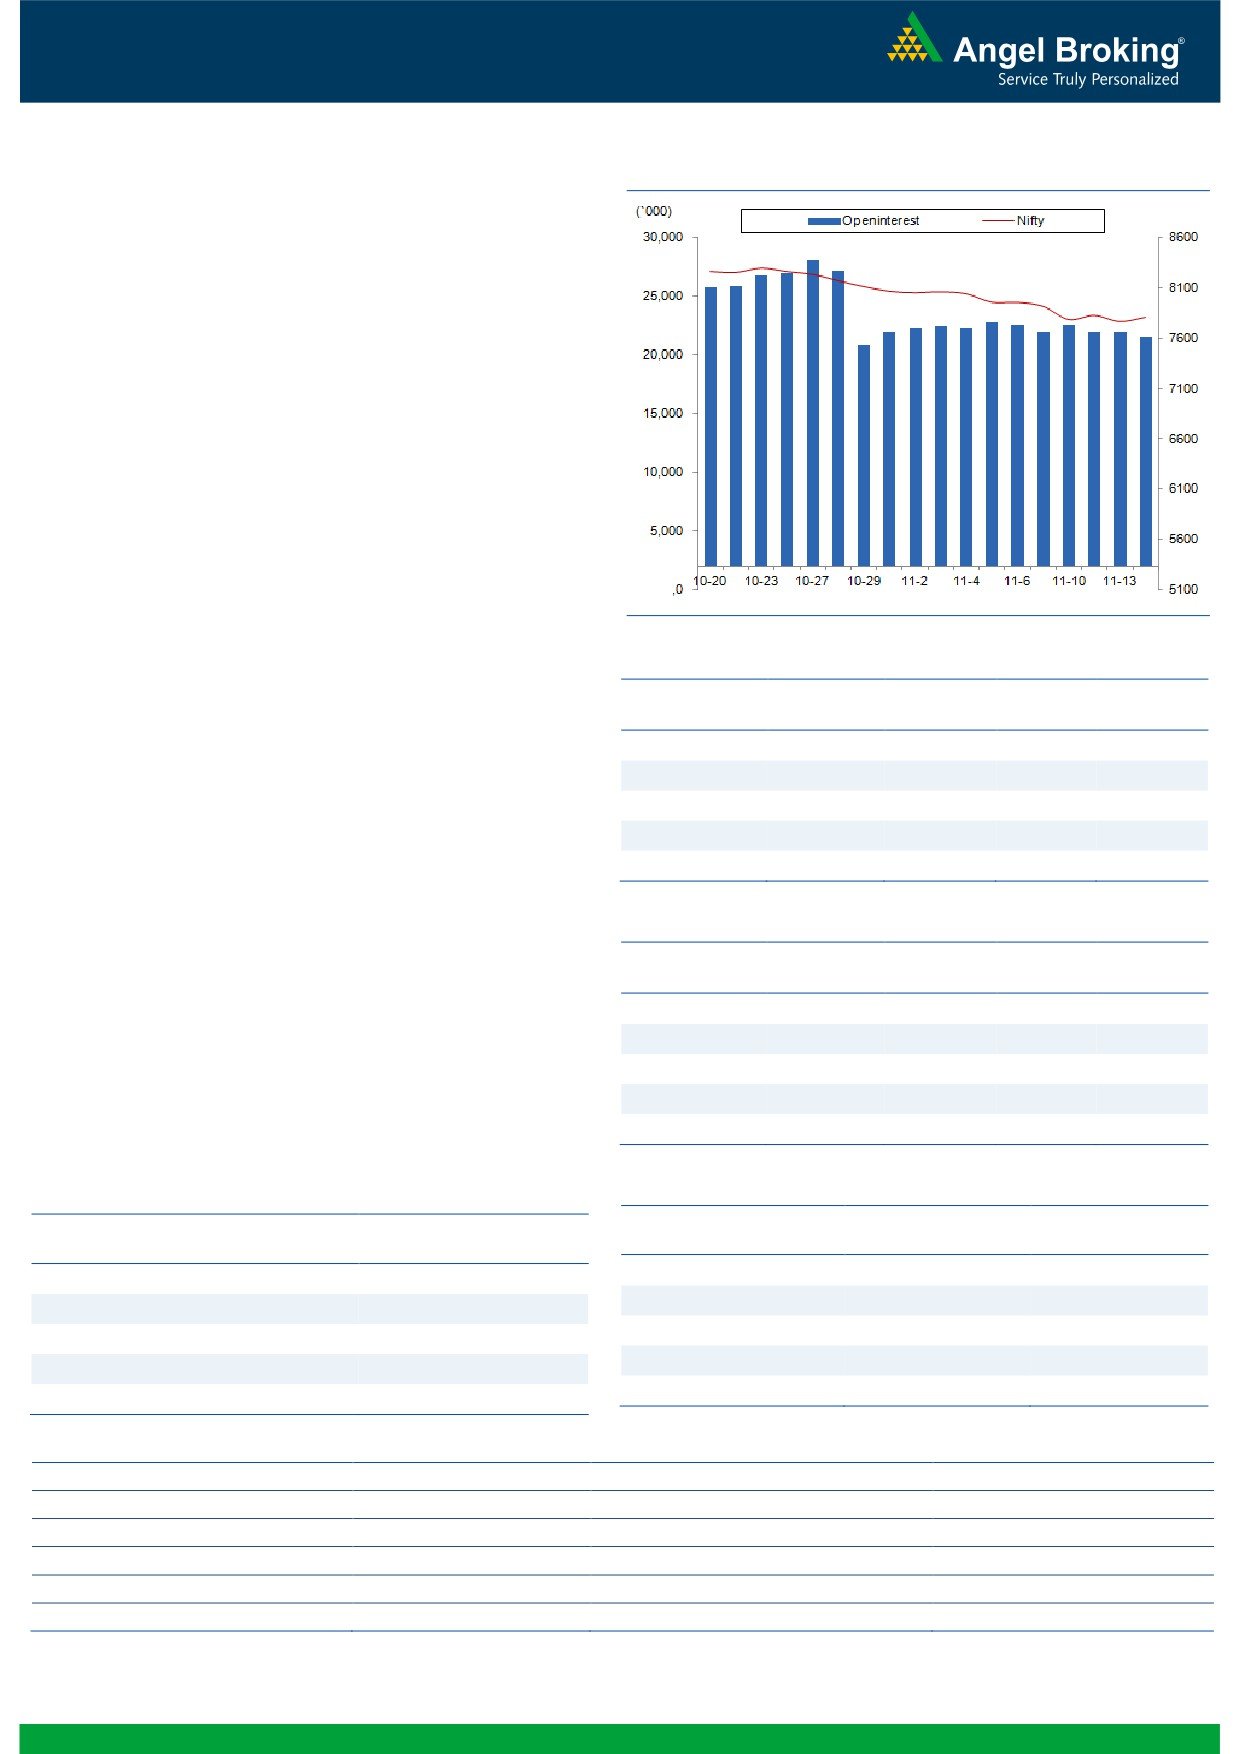
Exhibit 2: Bank Nifty Daily Chart
Bank Nifty Outlook - (17185)
Yesterday, the Bank Nifty opened with a loss of around 50
points and started moving higher from initial trades. The
bullish momentum persisted throughout the session and as a
result, the banking index continued to make ‘Higher Highs’ for
the second consecutive session. Eventually, the Bank Nifty
outperformed the benchmark indices and ended the session
with gains of 1.49 percent.
The Bank Nifty has crossed its crucial resistance of 17170 with
an ease on a closing basis. The outperformance of the
banking counters may continue in upcoming sessions too.
Going forward, the Bank Nifty may move towards its strong
resistance zone of 17440 - 17590 levels. On the flipside, the
immediate support for the index is placed at 17000 and
16850 levels.
Key Levels
Support 1 - 17000
Resistance 1 - 17440
Support 2 - 16850
Resistance 2 - 17590
1
Technical & Derivatives Report
November 17, 2015
Comments
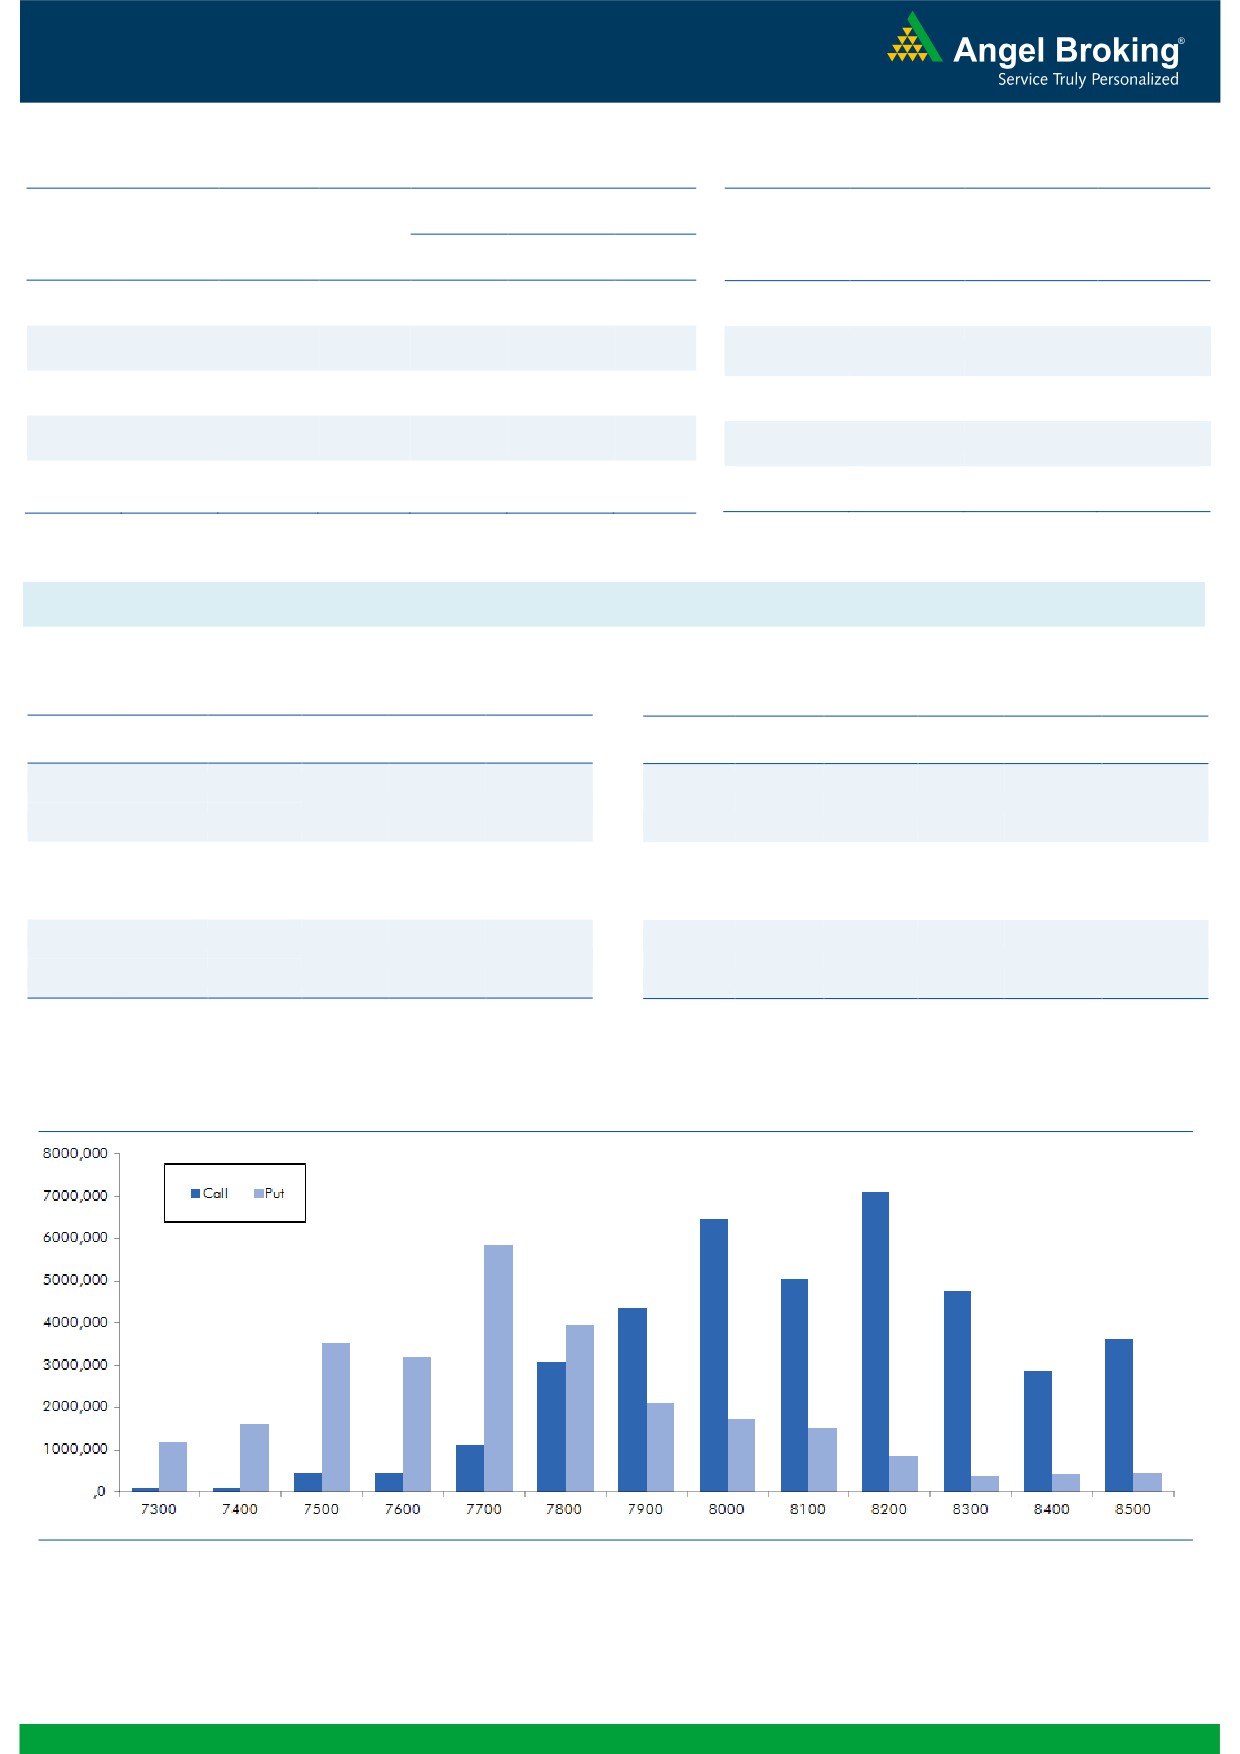
Nifty Vs OI
The Nifty futures open interest has decreased by 1.71%
BankNifty futures open interest has increased by 1.96%
as market closed at 7806.60 levels.
The Nifty November future closed at a premium of 20.65
points against a premium of
12.05 points. The
December series closed at a premium of 64.35 points.
The Implied Volatility of at the money options has
increased from 14.34% to 16.14%.
The total OI of the market is Rs. 2,33,722/- cr. and the
stock futures OI is Rs. 61,915/- cr.
Few of the liquid counters where we have seen high cost
of carry are JPASSOCIAT, GMRINFRA, JINDALSTEL,
UNITECH and ADANIPOWER.
OI Gainers
Views
OI
PRICE
SCRIP
OI
PRICE
CHG. (%)
CHG. (%)
FIIs were net sellers in both cash market segment and in
DABUR
3496000
21.98
262.05
-2.00
Index Futures. They sold equities to the tune of Rs. 1051
OIL
3338400
21.64
358.85
-2.14
crores and Index Futures of Rs. 646 crores with marginal
AJANTPHARM
697600
21.03
1336.35
-4.19
change in OI, which indicates blend of fresh short
KOTAKBANK
10740800
17.02
681.95
1.58
formation and long unwinding in last trading session.
IBULHSGFIN
7884800
13.56
631.60
-2.28
In Index Options front, they bought of worth Rs. 1498
crores with decent rise in OI. If we see the overall Nifty
OI Losers
options data, both in call and put options we hardly saw
OI
PRICE
any meaningful OI addition. In call options, 8000 strike
SCRIP
OI
PRICE
CHG. (%)
CHG. (%)
continue to be most active and added some OI.
DRREDDY
1889850
-10.49
3510.65
3.43
Maximum build-up is visible in 8200 call and 7700 put
FEDERALBNK
26488000
-4.86
56.75
5.48
options. Seeing continuous selling in equities and Index
HINDPETRO
9406200
-4.58
777.90
1.41
Futures by bigger hands, we believe market may still
JINDALSTEL
46354000
-4.36
81.70
2.77
remain in pressure and one should avoid bottom fishing
GLENMARK
3629500
-4.17
964.55
2.56
till we see any meaningful changes in data.
Put-Call Ratio
Historical Volatility
SCRIP
PCR-OI
PCR-VOL
SCRIP
HV
NIFTY
0.71
0.77
GMRINFRA
71.17
BANKNIFTY
0.83
0.72
KSCL
77.32
LT
0.39
0.31
JPASSOCIAT
78.91
DRREDDY
0.33
0.37
GAIL
39.51
SBIN
0.52
0.40
FEDERALBNK
51.04
Strategy Date
Symbol
Strategy
Status
November 02, 2015
RELIANCE
Short Strangle
Active
November 09, 2015
ITC
Short Strangle
Did not trigger.
November 16, 2015
TATAMOTORS
Long Put Ladder
Active
2
Technical & Derivatives Report
November 17, 2015
FII Statistics for 16-November 2015
Turnover on 16-November 2015
Open Interest
No. of
Turnover
Change
Detail
Buy
Sell
Net
Instrument
Value
Change
Contracts
( in Cr. )
(%)
Contracts
(in Cr.)
(%)
INDEX
INDEX
1386.19
2032.16
(645.96)
284924
16377.90
0.12
274189
15280.90
35.01
FUTURES
FUTURES
INDEX
INDEX
20706.57
19208.70
1497.87
1282325
74367.40
3.57
2875537
167225.54
33.04
OPTIONS
OPTIONS
STOCK
3137.36
3495.44
(358.08)
967386
47361.31
0.84
STOCK
FUTURES
472327
23393.14
0.67
FUTURES
STOCK
STOCK
2190.24
2266.26
(76.03)
76284
3750.17
2.28
OPTIONS
275158
14031.24
-2.20
OPTIONS
TOTAL
27420.36
27002.55
417.80
2610919
141856.78
2.13
TOTAL
3897212
219930.91
25.96
Nifty Spot = 7806.60
Lot Size = 25
Bull-Call Spreads
Bear-Put Spreads
Action
Strike
Price
Risk
Reward
BEP
Action
Strike
Price
Risk
Reward
BEP
Buy
7800
95.30
Buy
7800
70.40
46.05
53.95
7846.05
32.50
67.50
7767.50
Sell
7900
49.25
Sell
7700
37.90
Buy
7800
95.30
Buy
7800
70.40
74.10
125.90
7874.10
50.75
149.25
7749.25
Sell
8000
21.20
Sell
7600
19.65
Buy
7900
49.25
Buy
7700
37.90
28.05
71.95
7928.05
18.25
81.75
7681.75
Sell
8000
21.20
Sell
7600
19.65
Note: Above mentioned Bullish or Bearish Spreads in Nifty (Nov. Series) are given as an information and not as a recommendation.
Nifty Put-Call Analysis
3
Technical & Derivatives Report
November 17, 2015
Daily Pivot Levels for Nifty 50 Stocks
Scrips
S2
S1
PIVOT
R1
R2
ACC
1,289
1,307
1,319
1,337
1,349
ADANIPORTS
264
268
271
275
277
AMBUJACEM
186
190
193
197
200
ASIANPAINT
787
794
802
809
817
AXISBANK
473
477
481
485
489
BAJAJ-AUTO
2,311
2,342
2,375
2,406
2,440
BANKBARODA
172
174
176
178
179
BHARTIARTL
326
331
335
340
344
BHEL
174
176
178
181
183
BOSCHLTD
18,580
18,869
19,073
19,361
19,565
BPCL
887
893
903
909
918
CAIRN
127
129
131
134
136
CIPLA
605
616
623
634
641
COALINDIA
321
326
331
336
342
DRREDDY
3,366
3,438
3,481
3,553
3,596
GAIL
270
282
289
301
308
GRASIM
3,570
3,626
3,660
3,716
3,750
HCLTECH
818
828
835
846
853
HDFC
1,143
1,161
1,175
1,193
1,208
HDFCBANK
1,037
1,049
1,057
1,069
1,077
HEROMOTOCO
2,547
2,579
2,612
2,644
2,677
HINDALCO
75
77
78
80
81
HINDUNILVR
767
775
789
797
811
ICICIBANK
256
262
265
271
274
IDEA
128
129
131
132
133
INDUSINDBK
878
895
906
924
935
INFY
1,054
1,067
1,080
1,094
1,107
ITC
326
332
336
342
345
KOTAKBANK
655
667
678
690
702
LT
1,312
1,335
1,349
1,371
1,385
LUPIN
1,733
1,771
1,799
1,837
1,865
M&M
1,218
1,248
1,268
1,298
1,319
MARUTI
4,537
4,592
4,628
4,683
4,719
NTPC
129
130
131
132
133
ONGC
218
224
227
234
237
PNB
136
138
139
141
143
POWERGRID
127
128
129
130
132
RELIANCE
916
925
934
943
951
SBIN
235
242
246
252
256
VEDL
84
87
89
92
94
SUNPHARMA
725
732
740
747
755
TATAMOTORS
389
395
400
405
410
TATAPOWER
66
66
68
68
69
TATASTEEL
216
223
228
235
239
TCS
2,340
2,357
2,374
2,391
2,408
TECHM
504
510
514
520
525
ULTRACEMCO
2,598
2,667
2,718
2,787
2,838
WIPRO
536
545
551
560
567
YESBANK
728
740
746
758
764
ZEEL
371
375
379
383
387
4
Technical & Derivatives Report
November 17, 2015
Research Team Tel: 022 - 39357800
For Technical Queries
For Derivatives Queries
DISCLAIMER
Angel Broking Private Limited (hereinafter referred to as “Angel”) is a registered Member of National Stock Exchange of India Limited,
Bombay Stock Exchange Limited and MCX Stock Exchange Limited. It is also registered as a Depository Participant with CDSL and
Portfolio Manager with SEBI. It also has registration with AMFI as a Mutual Fund Distributor. Angel Broking Private Limited is a
registered entity with SEBI for Research Analyst in terms of SEBI (Research Analyst) Regulations, 2014 vide registration number
INH000000164. Angel or its associates has not been debarred/ suspended by SEBI or any other regulatory authority for accessing
/dealing in securities Market. Angel or its associates including its relatives/analyst do not hold any financial interest/beneficial
ownership of more than 1% in the company covered by Analyst. Angel or its associates/analyst has not received any compensation /
managed or co-managed public offering of securities of the company covered by Analyst during the past twelve months. Angel/analyst
has not served as an officer, director or employee of company covered by Analyst and has not been engaged in market making activity
of the company covered by Analyst.
This document is solely for the personal information of the recipient, and must not be singularly used as the basis of any investment
decision. Nothing in this document should be construed as investment or financial advice. Each recipient of this document should
make such investigations as they deem necessary to arrive at an independent evaluation of an investment in the securities of the
companies referred to in this document (including the merits and risks involved), and should consult their own advisors to determine
the merits and risks of such an investment.
Reports based on technical and derivative analysis center on studying charts of a stock's price movement, outstanding positions and
trading volume, as opposed to focusing on a company's fundamentals and, as such, may not match with a report on a company's
fundamentals.
The information in this document has been printed on the basis of publicly available information, internal data and other reliable
sources believed to be true, but we do not represent that it is accurate or complete and it should not be relied on as such, as this
document is for general guidance only. Angel Broking Pvt. Limited or any of its affiliates/ group companies shall not be in any way
responsible for any loss or damage that may arise to any person from any inadvertent error in the information contained in this report.
Angel Broking Pvt. Limited has not independently verified all the information contained within this document. Accordingly, we cannot
testify, nor make any representation or warranty, express or implied, to the accuracy, contents or data contained within this document.
While Angel Broking Pvt. Limited endeavors to update on a reasonable basis the information discussed in this material, there may be
regulatory, compliance, or other reasons that prevent us from doing so.
This document is being supplied to you solely for your information, and its contents, information or data may not be reproduced,
redistributed or passed on, directly or indirectly.
Neither Angel Broking Pvt. Limited, nor its directors, employees or affiliates shall be liable for any loss or damage that may arise from
or in connection with the use of this information.
Note: Please refer to the important ‘Stock Holding Disclosure' report on the Angel website (Research Section). Also, please refer to the
latest update on respective stocks for the disclosure status in respect of those stocks. Angel Broking Pvt. Limited and its affiliates may
have investment positions in the stocks recommended in this report.
5