Technical & Derivatives Report
December 16, 2016
Sensex (26519) / Nifty (8154)
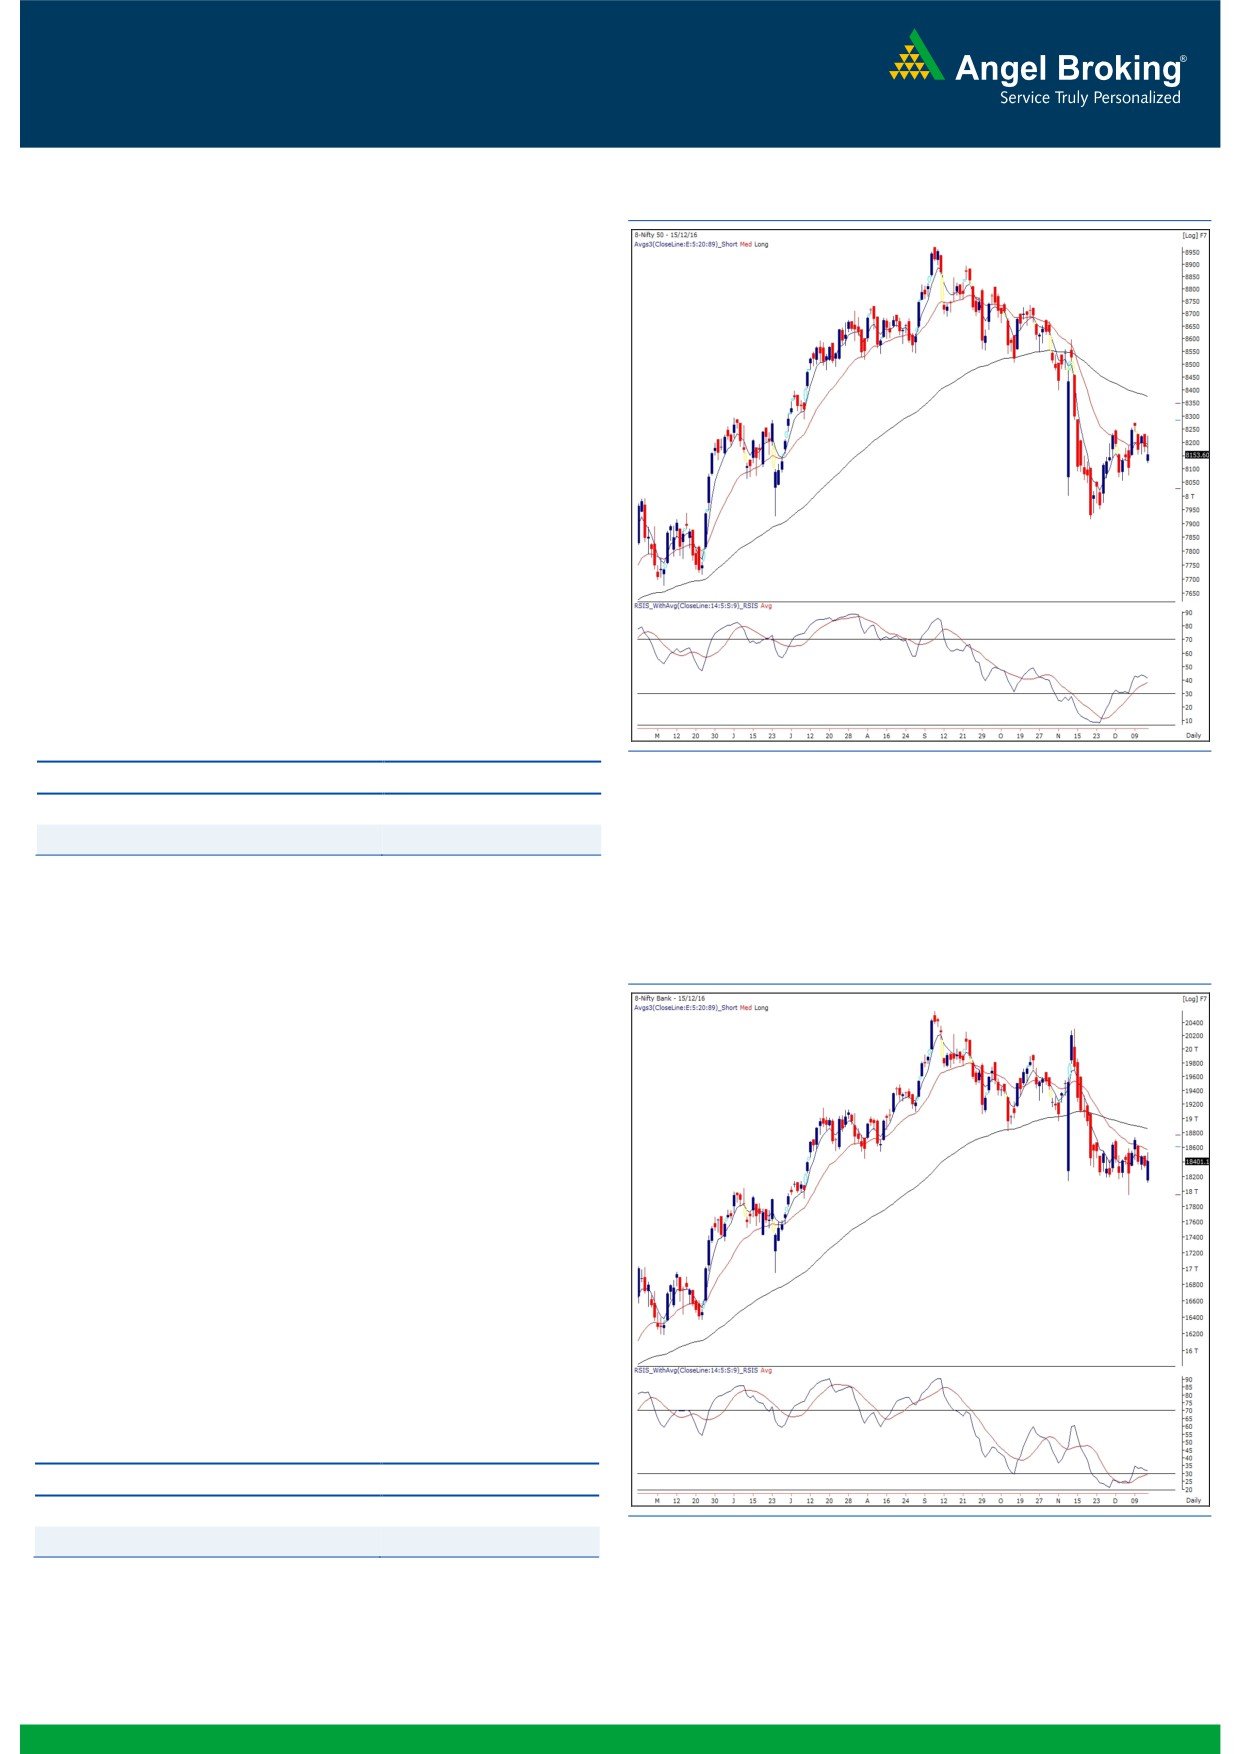
Exhibit 1: Nifty Daily Chart
Yesterday’s gap down opening was mainly a kneejerk reaction to
the Fed’s outcome of raising key interest rates by 25 bps. As a
result, the US Dollar index shot up to 14-year high. However, the
Fed’s move was quite on expected lines and thus, we witnessed a
v-shaped recovery in our market in the initial trades.
During the remaining part of the day, we witnessed immense
volatility in the market due to which we saw wild swings on both
sides in a range of 8220 - 8150. The Nifty eventually closed
inside the negative territory; however, the outlook for the
forthcoming session remains positive as the ‘Higher Top Higher
Bottom’ formed on daily chart is still intact. In addition, the ‘RSI-
Smoothened’ oscillator is placed around the 40 mark. Any uptick
in this indicator may result into a decent up move. Now, intraday
supports for Friday’s session are seen at 8121 - 8077; whereas,
a breakout beyond 8226 would lead to strong rally in the upward
direction.
Key Levels
Support 1 - 8121
Resistance 1 - 8226
Support 2 - 8077
Resistance 2 - 8275
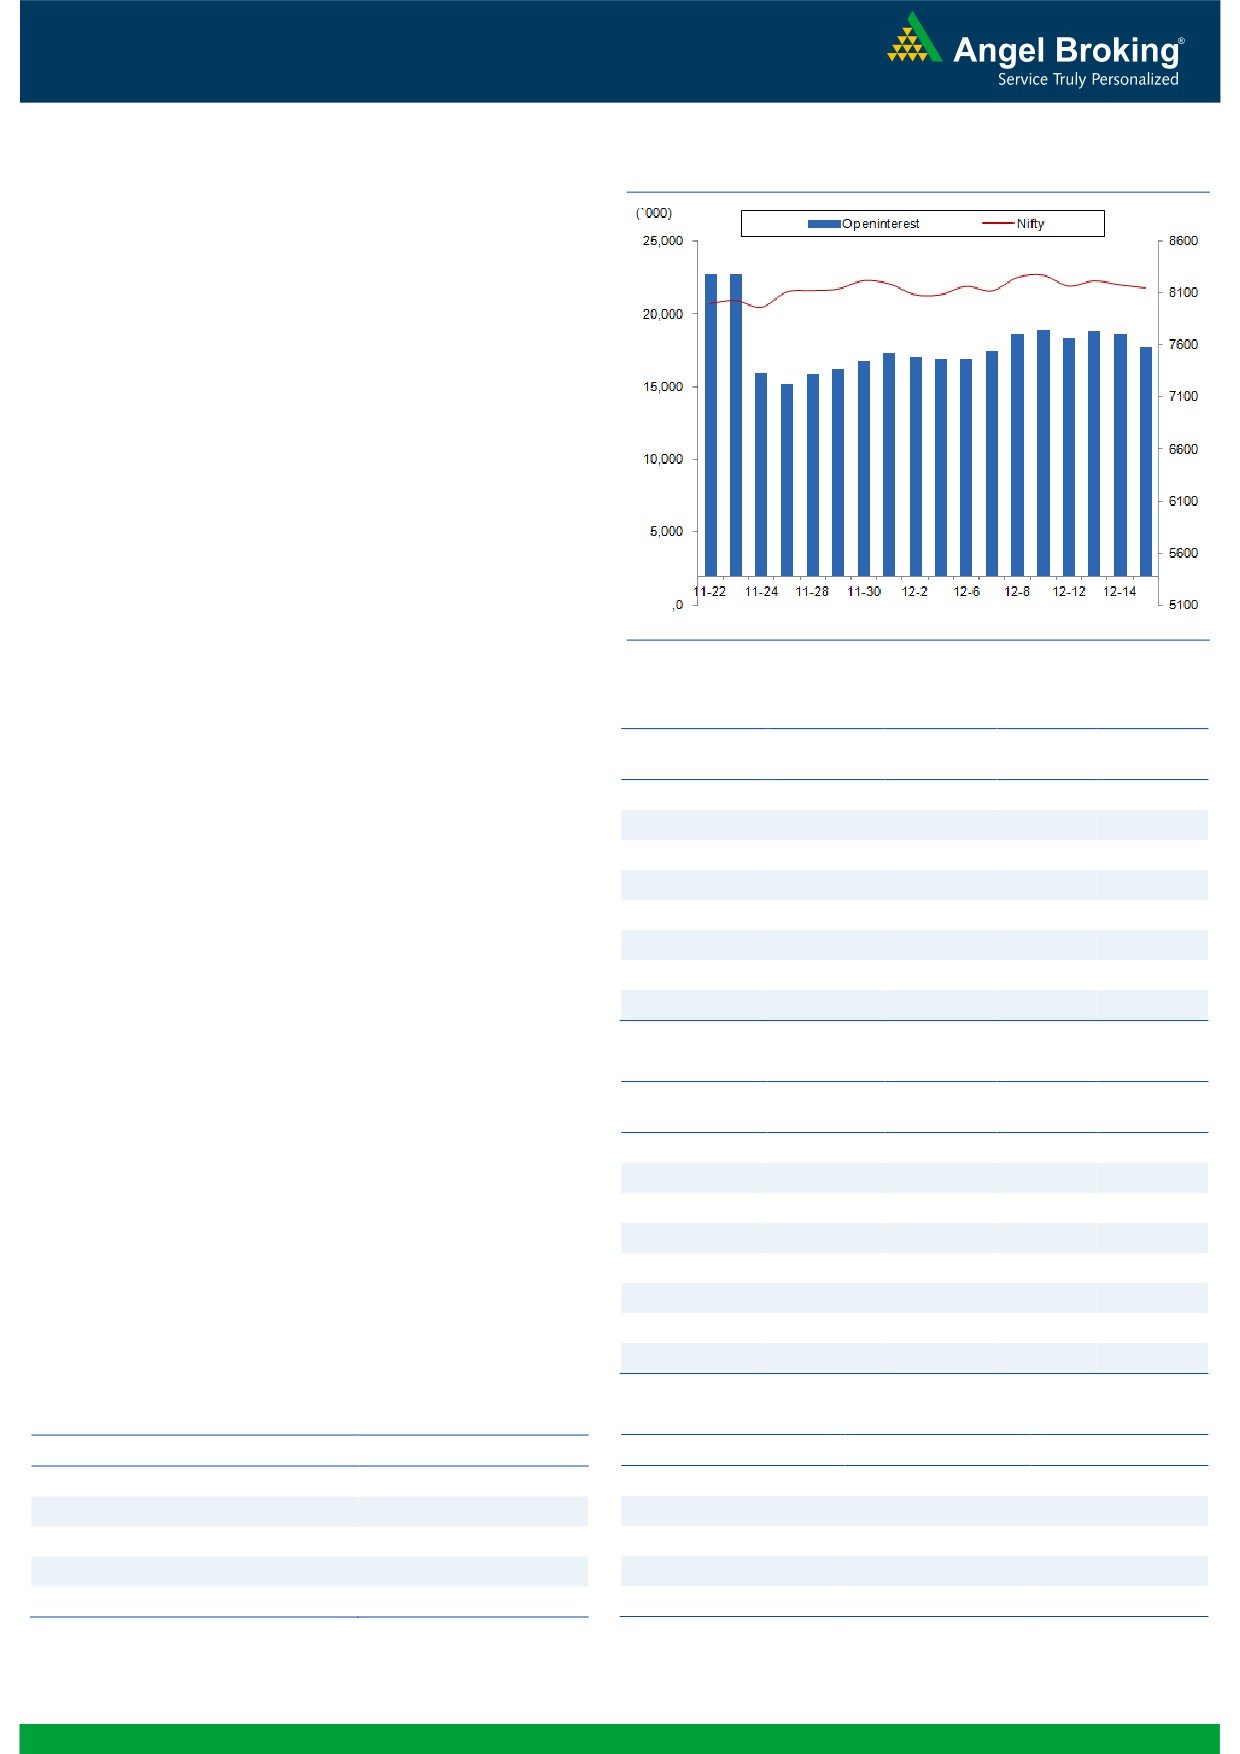
Nifty Bank Outlook - (18401)
Exhibit 2: Nifty Bank Daily Chart
The US FOMC raised the federal funds rate target range by 25
basis points last night. The Asian markets were trading negative
on back of this news which led to a gap down opening in Nifty
Bank index as well. However, the Nifty Bank recovered from the
support around 18120 in short span of time and traded in
positive territory. The Nifty Bank index ended the session with
marginal gains of 0.33 percent.
Inspite of the above mentioned activity, there is no major change
in the chart structure and thus, the range bound activity in the in
the banking sector is expected to continue. Hence, we continue to
advise traders to focus on stock specific moves from short-term
perspective and avoid forming short positions. The intraday
supports for the Nifty Bank index are placed around 18300 and
18120 whereas resistances are seen around 18490 and 18725.
Key Levels
Support 1 - 18300
Resistance 1 - 18490
Support 2 - 18120
Resistance 2 - 18725
1
Technical & Derivatives Report
December 16, 2016
Comments
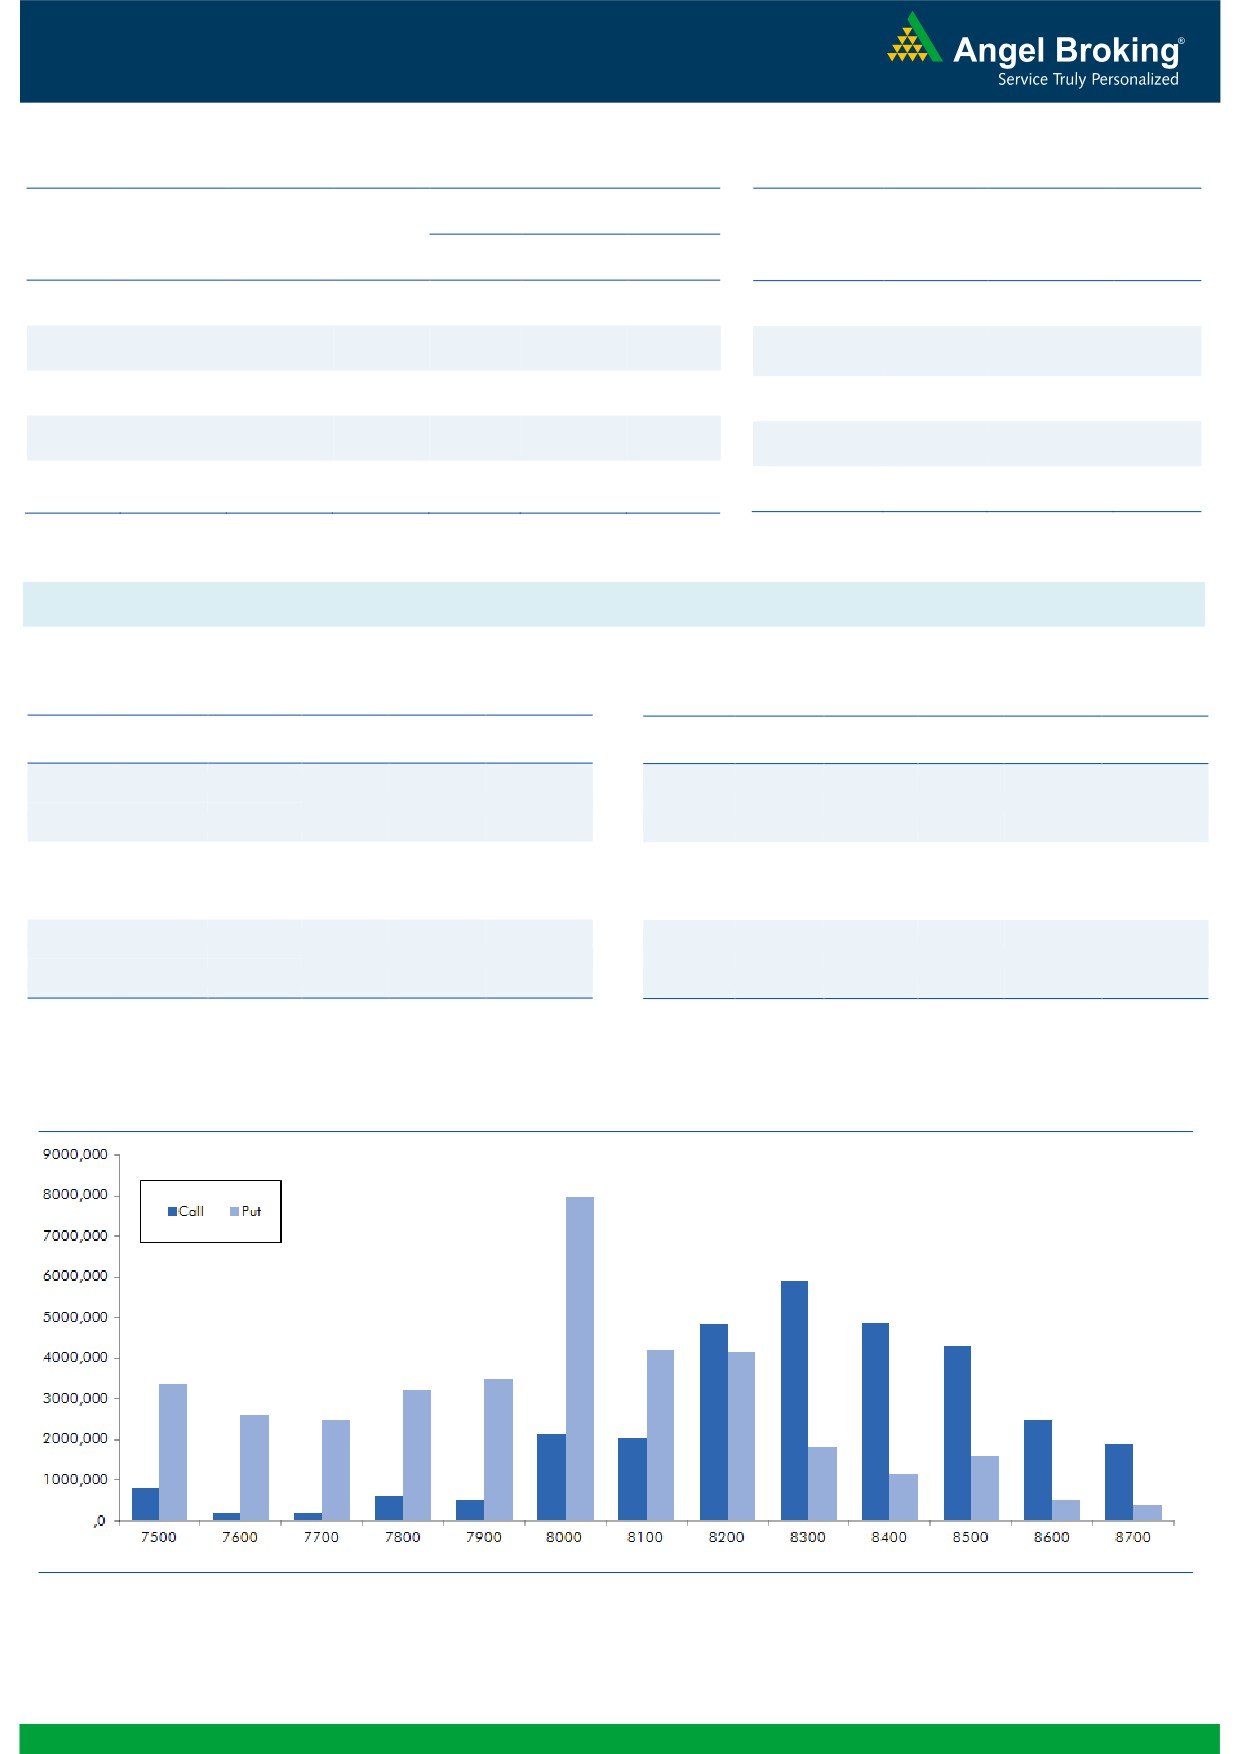
Nifty Vs OI
The Nifty futures open interest has decreased by 4.61%
BankNifty futures open interest has decreased by 1.26%
as market closed at 8153.60 levels.
The Nifty December future closed with a premium of
19.45 against the premium of 15.20 points in last
trading session. The January series closed at a premium
of 54.35 points.
The Implied Volatility of at the money options has
decreased from 15.26% to 13.50%. At the same time,
the PCR-OI of Nifty has decreased from 1.08 to 1.05
levels.
The total OI of the market is Rs. 2,74,931/- cr. and the
stock futures OI is Rs. 69,619/- cr.
Few of the liquid counters where we have seen high cost
of carry are GMRINFRA, JPASSOCIAT, ICIL, JSWENERGY
and NHPC.
OI Gainers
Views
OI
PRICE
SCRIP
OI
PRICE
CHG. (%)
CHG. (%)
Yesterday, FIIs were net seller in both cash market and
IGL
1741300
31.26
909.00
4.61
index futures segment. They sold equities worth Rs. 612
GODREJIND
1852500
14.56
417.05
0.85
crores. While in index futures, they were net sellers to the
BEML
728400
12.98
930.10
3.25
tune of Rs. 1520 crores with good amount of fall in openng.com
JSWENERGY
33456000
11.94
62.10
4.37
interest, suggesting long unwinding took place in
BHARATFIN
9395000
11.53
662.50
1.09
previous trading session.
ORIENTBANK
15900000
11.25
116.20
0.43
In Index options segment, FIIs were net buyers worth
UBL
1257200
10.18
819.35
-1.59
Rs. 910 crores with rise in open interest. In call options,
JUBLFOOD
2244500
8.33
831.15
-1.62
8300-8400 strikes added some fresh positions. While, in
put options, we hardly witnessed any relevant build-up.
Highest OI in current series is placed at 8300 call and
OI Losers
8000 put option.
OI
PRICE
SCRIP
OI
PRICE
CHG. (%)
CHG. (%)
Yesterday, FIIs unwounded good amount of their longs in
EXIDEIND
14508000
-7.87
175.15
1.95
Index Futures. However, decent amount of their long
MCDOWELL-N
2602750
-4.95
1924.70
-0.69
positions in index futures formed in last week are still
MINDTREE
2617200
-4.01
496.80
-1.09
intact. Since, strong support for the index is placed at
RELIANCE
15027000
-3.58
1055.30
-0.44
8100-8150, intraday dips should be used as buying
DCBBANK
2065500
-3.57
108.55
1.59
opportunity. Thus, traders are advised to trade with
AMARAJABAT
588000
-3.26
913.05
1.40
positive bias.
STAR
1353500
-3.22
1090.65
-0.22
TATAMOTORS
21942000
-3.19
464.45
-1.59
Historical Volatility
Put-Call Ratio
SCRIP
HV
SCRIP
PCR-OI
PCR-VOL
IGL
35.56
NIFTY
1.05
1.19
GRANULES
44.96
BANKNIFTY
1.16
0.91
SUNPHARMA
45.00
SUNPHARMA
0.47
0.64
JSWENERGY
46.81
SBIN
0.62
0.58
JUSTDIAL
35.31
INFY
0.67
0.74
2
Technical & Derivatives Report
December 16, 2016
FII Statistics for December 15, 2016
Turnover on December 15, 2016
Open Interest
No. of
Turnover
Change
Detail
Buy
Sell
Net
Instrument
Value
Change
Contracts
( in Cr. )
(%)
Contracts
(in Cr.)
(%)
INDEX
INDEX
1935.19
3455.61
(1520.42)
190889
12061.75
(10.84)
327047
21627.43
94.37
FUTURES
FUTURES
INDEX
INDEX
59088.63
58178.62
910.01
1087992
67679.31
2.25
8499662
591870.66
216.69
OPTIONS
OPTIONS
STOCK
6563.11
6826.67
(263.56)
896540
54666.27
(0.02)
STOCK
FUTURES
503033
33155.99
25.83
FUTURES
STOCK
STOCK
3786.20
3823.90
(37.70)
84041
5438.81
2.29
OPTIONS
315713
21259.39
28.77
OPTIONS
TOTAL
71373.13
72284.80
(911.67)
2259462
139846.14
0.11
TOTAL
9645455
667913.47
177.28
Nifty Spot = 8153.60
Lot Size = 75
Bull-Call Spreads
Bear-Put Spreads
Action
Strike
Price
Risk
Reward
BEP
Action
Strike
Price
Risk
Reward
BEP
Buy
8200
71.75
Buy
8100
61.35
38.60
61.40
8238.60
23.65
76.35
8076.35
Sell
8300
33.15
Sell
8000
37.70
Buy
8200
71.75
Buy
8100
61.35
59.30
140.70
8259.30
38.50
161.50
8061.50
Sell
8400
12.45
Sell
7900
22.85
Buy
8300
33.15
Buy
8000
37.70
20.70
79.30
8320.70
14.85
85.15
7985.15
Sell
8400
12.45
Sell
7900
22.85
Note: Above mentioned Bullish or Bearish Spreads in Nifty (December Series) are given as an information and not as a recommendation.
Nifty Put-Call Analysis
3
Technical & Derivatives Report
December 16, 2016
Daily Pivot Levels for Nifty Constituents
Scrips
S2
S1
PIVOT
R1
R2
ACC
1,293
1,304
1,316
1,327
1,339
ADANIPORTS
278
281
286
290
295
AMBUJACEM
197
199
203
205
209
ASIANPAINT
892
898
907
913
922
AUROPHARMA
678
686
697
705
716
AXISBANK
452
465
472
485
493
BAJAJ-AUTO
2,596
2,633
2,666
2,704
2,736
BANKBARODA
154
157
159
162
164
BHEL
123
124
125
127
128
BPCL
596
606
618
628
641
BHARTIARTL
315
317
319
321
324
INFRATEL
345
348
354
357
362
BOSCH
19,392
19,683
20,092
20,383
20,792
CIPLA
549
556
566
573
584
COALINDIA
287
288
291
293
296
DRREDDY
3,065
3,086
3,123
3,144
3,181
EICHERMOT
21,081
21,298
21,682
21,900
22,284
GAIL
408
412
419
423
429
GRASIM
812
822
838
848
865
HCLTECH
813
823
831
841
849
HDFCBANK
1,147
1,162
1,178
1,193
1,209
HDFC
1,242
1,251
1,264
1,273
1,286
HEROMOTOCO
3,078
3,124
3,162
3,208
3,246
HINDALCO
171
174
176
178
180
HINDUNILVR
808
812
818
822
828
ICICIBANK
256
258
260
262
264
IDEA
75
76
77
78
79
INDUSINDBK
1,041
1,061
1,077
1,097
1,113
INFY
970
981
1,000
1,011
1,030
ITC
225
227
231
233
237
KOTAKBANK
701
713
724
736
746
LT
1,340
1,348
1,358
1,366
1,376
LUPIN
1,460
1,470
1,480
1,490
1,500
M&M
1,152
1,170
1,183
1,200
1,214
MARUTI
5,026
5,089
5,143
5,206
5,260
NTPC
157
158
162
163
166
ONGC
198
202
205
210
213
POWERGRID
178
181
183
186
188
RELIANCE
1,037
1,045
1,056
1,064
1,075
SBIN
255
260
264
269
272
SUNPHARMA
628
639
656
667
685
TCS
2,174
2,217
2,244
2,287
2,315
TATAMTRDVR
289
293
299
303
309
TATAMOTORS
455
459
466
470
478
TATAPOWER
76
77
79
80
81
TATASTEEL
405
412
420
427
434
TECHM
462
470
476
484
490
ULTRACEMCO
3,221
3,243
3,277
3,299
3,333
WIPRO
455
461
466
472
478
YESBANK
1,166
1,175
1,190
1,200
1,214
ZEEL
426
432
440
446
453
4
Technical & Derivatives Report
December 16, 2016
Research Team Tel: 022 - 39357800
For Technical Queries
For Derivatives Queries
DISCLAIMER
Angel Broking Private Limited (hereinafter referred to as “Angel”) is a registered Member of National Stock Exchange of India Limited,
Bombay Stock Exchange Limited and Metropolitan Stock Exchange Limited. It is also registered as a Depository Participant with CDSL
and Portfolio Manager with SEBI. It also has registration with AMFI as a Mutual Fund Distributor. Angel Broking Private Limited is a
registered entity with SEBI for Research Analyst in terms of SEBI (Research Analyst) Regulations, 2014 vide registration number
INH000000164. Angel or its associates has not been debarred/ suspended by SEBI or any other regulatory authority for accessing
/dealing in securities Market. Angel or its associates/analyst has not received any compensation / managed or co-managed public
offering of securities of the company covered by Analyst during the past twelve months.
This document is solely for the personal information of the recipient, and must not be singularly used as the basis of any investment
decision. Nothing in this document should be construed as investment or financial advice. Each recipient of this document should
make such investigations as they deem necessary to arrive at an independent evaluation of an investment in the securities of the
companies referred to in this document (including the merits and risks involved), and should consult their own advisors to determine
the merits and risks of such an investment.
Reports based on technical and derivative analysis center on studying charts of a stock's price movement, outstanding positions and
trading volume, as opposed to focusing on a company's fundamentals and, as such, may not match with a report on a company's
fundamentals. Investors are advised to refer the Fundamental and Technical Research Reports available on our website to evaluate the
contrary view, if any.
The information in this document has been printed on the basis of publicly available information, internal data and other reliable
sources believed to be true, but we do not represent that it is accurate or complete and it should not be relied on as such, as this
document is for general guidance only. Angel Broking Pvt. Limited or any of its affiliates/ group companies shall not be in any way
responsible for any loss or damage that may arise to any person from any inadvertent error in the information contained in this report.
Angel Broking Pvt. Limited has not independently verified all the information contained within this document. Accordingly, we cannot
testify, nor make any representation or warranty, express or implied, to the accuracy, contents or data contained within this document.
While Angel Broking Pvt. Limited endeavors to update on a reasonable basis the information discussed in this material, there may be
regulatory, compliance, or other reasons that prevent us from doing so.
This document is being supplied to you solely for your information, and its contents, information or data may not be reproduced,
redistributed or passed on, directly or indirectly.
Neither Angel Broking Pvt. Limited, nor its directors, employees or affiliates shall be liable for any loss or damage that may arise from
or in connection with the use of this information.
5