Technical & Derivatives Report
November 16, 2015
Sensex (25611) / Nifty (7762)
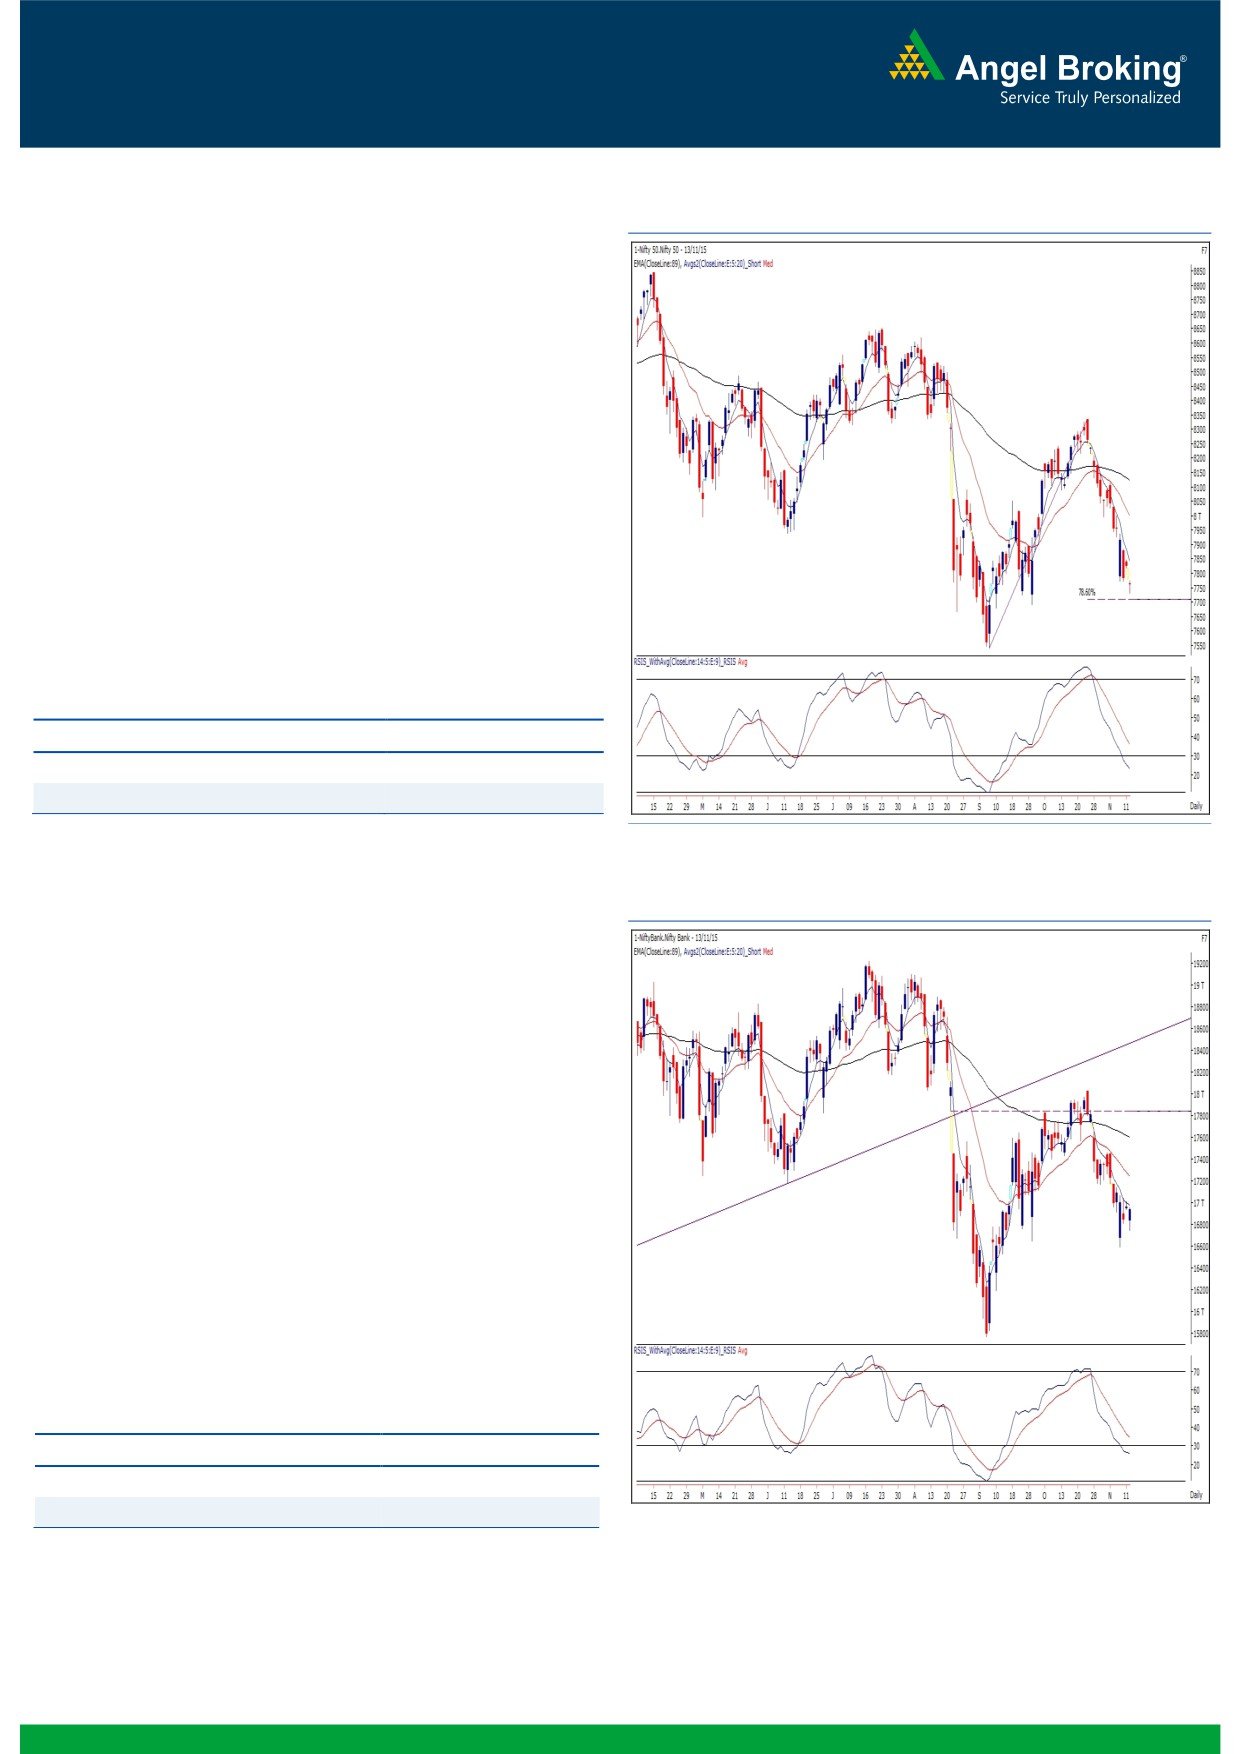
Exhibit 1: Nifty Daily Chart
The first half of the forthcoming week would be very important
for the market. If the Nifty manages to hold the support of
7691, then we may witness an immediate bounce back
towards 7850 - 7930 levels. Further, if we meticulously
observe the weekly chart, an ‘Inverted Hammer’ pattern is
clearly visible. The ongoing pessimism may get arrested once
the Nifty surpasses the high (7937.75) of the pattern on a
closing basis. In this scenario, an immediate up move towards
8100 on the Nifty cannot be ruled out. This pattern needs a
confirmation and thus, traders are advised not to pre-empt
any move, but rather wait for developments to happen around
the mentioned key level. On the flipside, a sustainable move
below 7691 may lead to an extension of this down move and
the Nifty could test its recent low of 7539.50. Meanwhile, a
stock specific approach should be continued to be followed
with a proper exit strategy.
Key Levels
Support 1 - 7691
Resistance 1 - 7850
Support 2 - 7539
Resistance 2 - 7930
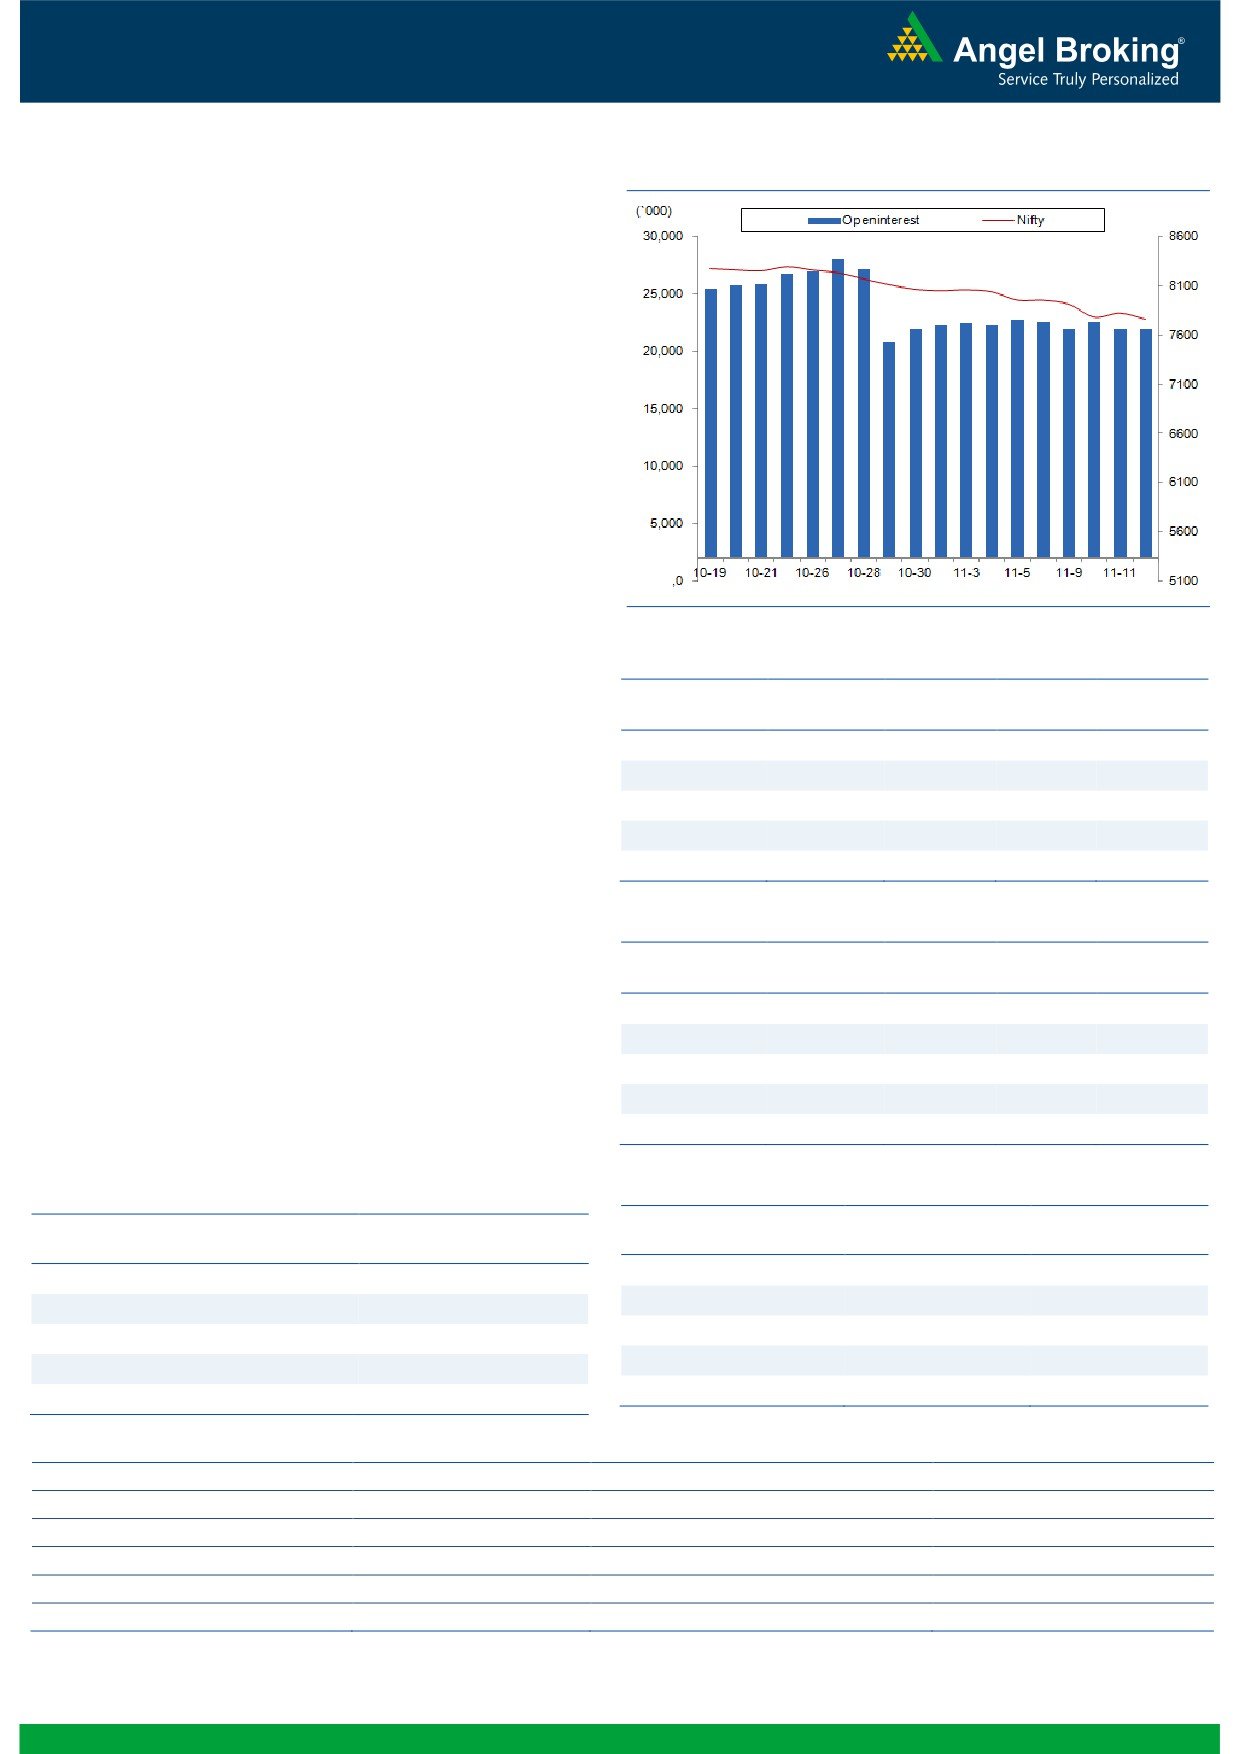
Exhibit 2: Bank Nifty Daily Chart
Bank Nifty Outlook - (16933)
Last week, the Nifty Bank Index ended with losses of 0.90 per
cent as compared to its previous week's close. On weekly
charts, the index has formed a small body candle near the 89
weekly EMA. The support also coincides with the
61.8%
retracement level of the previous up-leg from 15762 to
18029. Hence, it will be prudent to watch last week's low of
16587 which is a crucial support level. The index could show
pullback moves as the correction has halted near the above
mentioned crucial support. However, there are no major
reversal signals at this juncture. Hence, any pullback could just
be a dead cat bounce unless we see any strength in broader
market. The resistance on pullbacks will be seen around
17170 and hence we expect the index to trade in the range of
16587
-
17170 in near term. Any breakout from the
mentioned range could lead to a directional momentum in the
direction of the breakout.
Key Levels
Support 1 - 16700
Resistance 1 - 17000
Support 2 - 16587
Resistance 2 - 17170
1
Technical & Derivatives Report
November 16, 2015
Comments
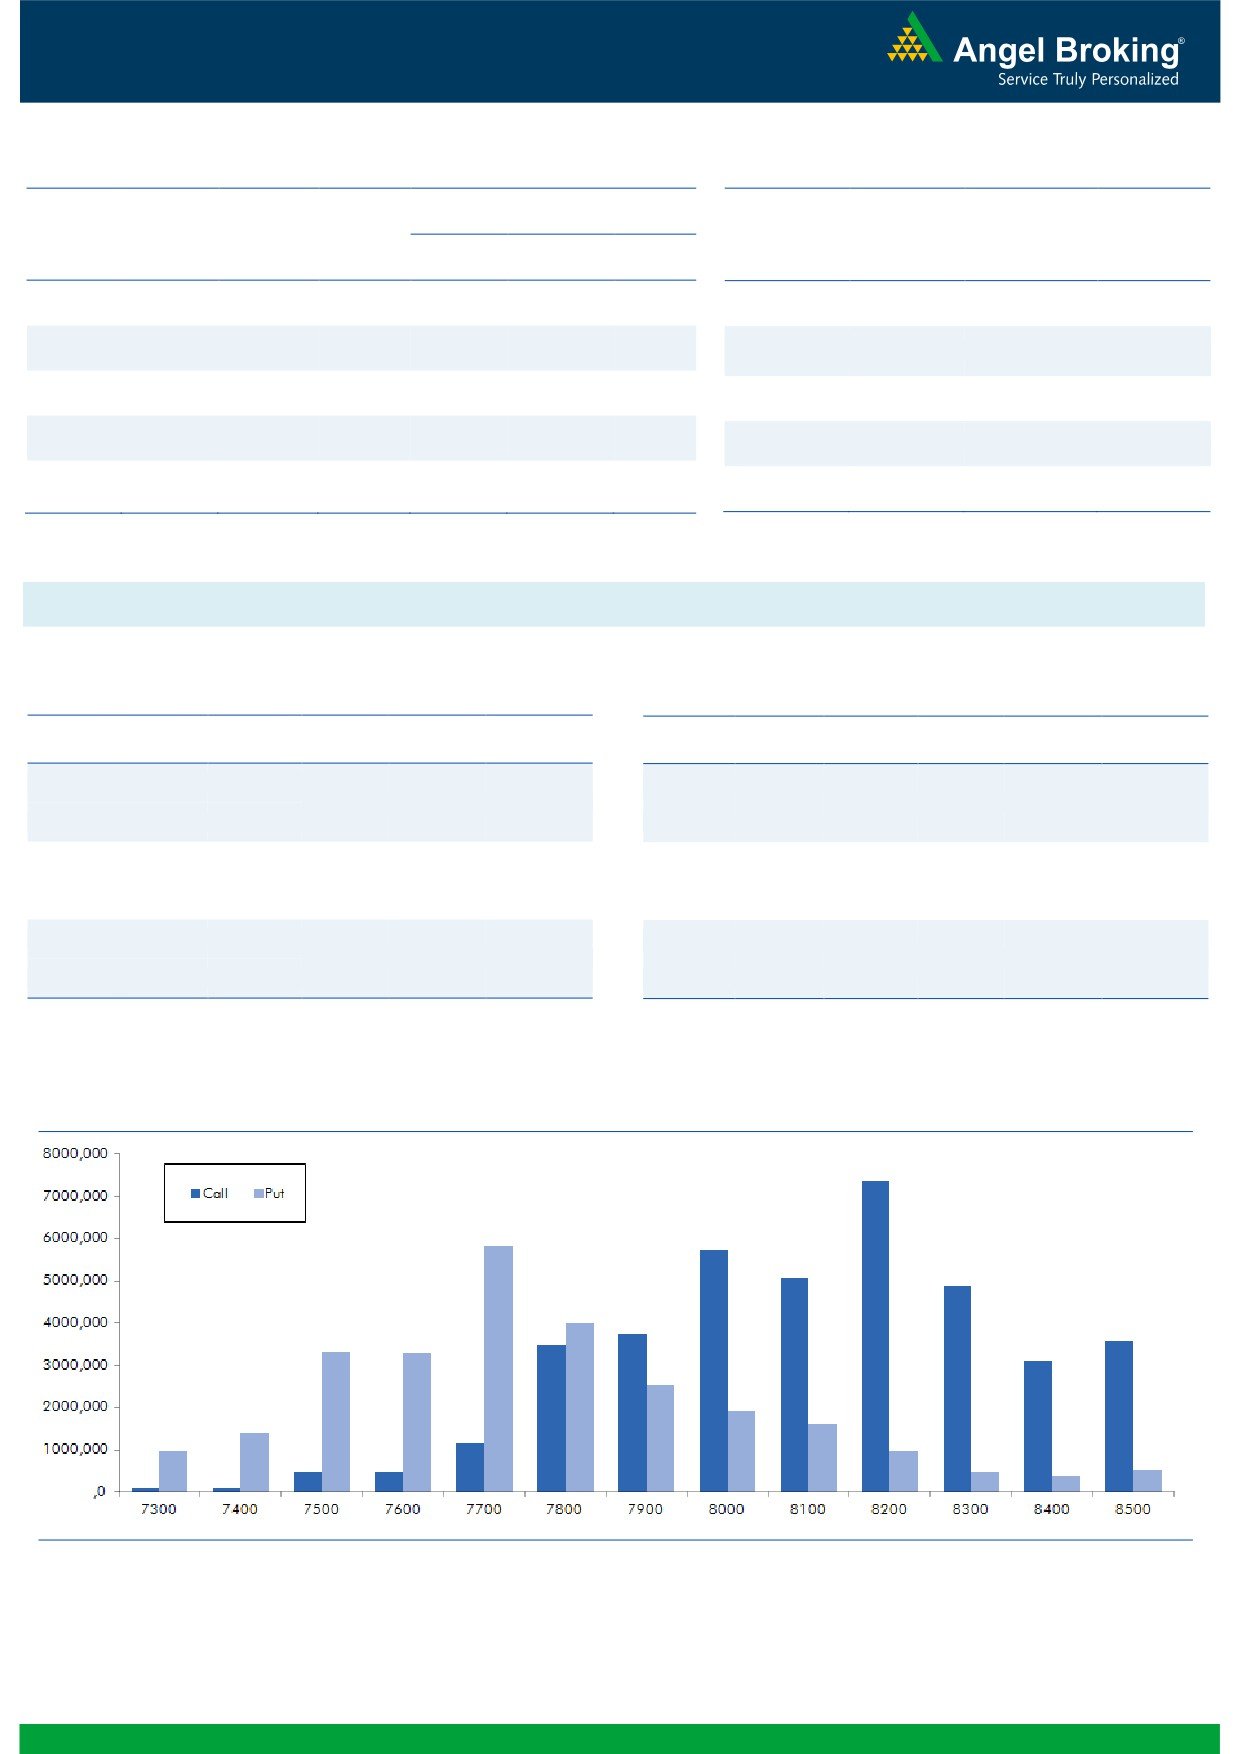
Nifty Vs OI
The Nifty futures open interest has decreased by 0.09%
BankNifty futures open interest has increased by 0.22%
as market closed at 7762.25 levels.
The Nifty November future closed at a premium of 12.05
points against a premium of 0.05 points. The December
series closed at a premium of 56.50 points.
The Implied Volatility of at the money options has
increased from 14.13% to 14.34%.
The total OI of the market is Rs. 2,29,546/- cr. and the
stock futures OI is Rs. 60,677/- cr.
Few of the liquid counters where we have seen high cost
of carry are JPASSOCIAT, PIDILITIND, UNITECH, NCC
and SUNTV.
OI Gainers
Views
OI
PRICE
SCRIP
OI
PRICE
CHG. (%)
CHG. (%)
FIIs were net sellers in both cash market segment and in
IBULHSGFIN
6943200
27.09
646.35
-10.15
Index Futures. They sold equities to the tune of Rs. 747
CESC
2432000
20.81
559.25
6.18
crores and Index Futures of Rs.
1250 crores with
TATAMTRDVR
15306900
15.90
290.60
4.44
marginal change in OI, which indicates blend of fresh
RCOM
65824000
12.37
66.15
-6.83
short formation and long unwinding.
OIL
2744400
12.22
366.70
-3.97
In Index Options front, they bought of worth Rs. 979
crores with decent rise in OI. If we see the overall Nifty
OI Losers
options data, both in call and put options we hardly saw
OI
PRICE
any meaningful OI addition. In call options, 8000 strike
SCRIP
OI
PRICE
CHG. (%)
CHG. (%)
was most active and added some OI. Maximum build-up
MARUTI
2369625
-15.40
4618.30
-2.41
is visible in 8200 call and 7700 put options. Seeing
DABUR
2866000
-9.13
267.40
-0.04
continuous selling in equities and Index Futures by bigger
COALINDIA
14354400
-6.58
337.60
2.69
hands, we believe market may still remain in pressure
HEROMOTOCO
1180000
-4.93
2619.95
-1.26
and one should avoid bottom fishing till we see any
AXISBANK
37781000
-4.46
485.80
1.07
meaningful changes in data.
Put-Call Ratio
Historical Volatility
SCRIP
PCR-OI
PCR-VOL
SCRIP
HV
NIFTY
0.72
0.71
IBULHSGFIN
59.29
BANKNIFTY
0.76
0.72
OIL
39.47
LT
0.40
0.28
JINDALSTEL
70.51
DRREDDY
0.32
0.41
BRITANNIA
34.13
SBIN
0.48
0.47
CIPLA
30.61
Strategy Date
Symbol
Strategy
Status
November 02, 2015
RELIANCE
Short Strangle
Active
November 09, 2015
ITC
Short Strangle
Did not trigger.
2
Technical & Derivatives Report
November 16, 2015
FII Statistics for 13-November 2015
Turnover on 13-November 2015
Open Interest
No. of
Turnover
Change
Detail
Buy
Sell
Net
Instrument
Value
Change
Contracts
( in Cr. )
(%)
Contracts
(in Cr.)
(%)
INDEX
INDEX
1115.36
2365.03
(1249.67)
284579
16222.54
0.64
204938
11318.60
-24.30
FUTURES
FUTURES
INDEX
INDEX
16266.62
15287.30
979.32
1238111
71369.01
3.29
2148819
125696.62
-24.32
OPTIONS
OPTIONS
STOCK
3221.19
3564.54
(343.35)
959317
46554.07
(0.26)
STOCK
FUTURES
465055
23236.71
-4.14
FUTURES
STOCK
STOCK
2645.96
2530.68
115.29
74582
3630.32
8.87
OPTIONS
276953
14346.24
-6.22
OPTIONS
TOTAL
23249.13
23747.54
(498.41)
2556589
137775.95
1.79
TOTAL
3095765
174598.17
-20.85
Nifty Spot = 7762.25
Lot Size = 25
Bull-Call Spreads
Bear-Put Spreads
Action
Strike
Price
Risk
Reward
BEP
Action
Strike
Price
Risk
Reward
BEP
Buy
7800
70.70
Buy
7700
57.85
35.15
64.85
7835.15
25.80
74.20
7674.20
Sell
7900
35.55
Sell
7600
32.05
Buy
7800
70.70
Buy
7700
57.85
54.75
145.25
7854.75
40.25
159.75
7659.75
Sell
8000
15.95
Sell
7500
17.60
Buy
7900
35.55
Buy
7600
32.05
19.60
80.40
7919.60
14.45
85.55
7585.55
Sell
8000
15.95
Sell
7500
17.60
Note: Above mentioned Bullish or Bearish Spreads in Nifty (Nov. Series) are given as an information and not as a recommendation.
Nifty Put-Call Analysis
3
Technical & Derivatives Report
November 16, 2015
Daily Pivot Levels for Nifty 50 Stocks
Scrips
S2
S1
PIVOT
R1
R2
ACC
1,305
1,316
1,325
1,336
1,345
ADANIPORTS
259
263
266
270
273
AMBUJACEM
188
190
194
196
199
ASIANPAINT
785
793
800
808
816
AXISBANK
467
476
481
491
496
BAJAJ-AUTO
2,303
2,342
2,406
2,445
2,509
BANKBARODA
167
171
173
177
179
BHARTIARTL
321
327
332
338
343
BHEL
174
176
179
180
183
BOSCHLTD
18,509
18,748
19,003
19,242
19,498
BPCL
882
894
901
913
919
CAIRN
126
128
133
135
140
CIPLA
602
610
623
631
644
COALINDIA
324
331
336
343
349
DRREDDY
3,255
3,322
3,365
3,433
3,476
GAIL
277
280
282
284
286
GRASIM
3,529
3,576
3,603
3,650
3,677
HCLTECH
808
825
841
859
875
HDFC
1,149
1,164
1,173
1,187
1,196
HDFCBANK
1,035
1,044
1,049
1,058
1,063
HEROMOTOCO
2,586
2,601
2,625
2,640
2,664
HINDALCO
75
76
78
79
81
HINDUNILVR
789
793
796
800
803
ICICIBANK
257
260
261
264
265
IDEA
128
129
130
131
133
INDUSINDBK
874
883
889
899
905
INFY
1,083
1,092
1,099
1,108
1,115
ITC
324
327
330
333
337
KOTAKBANK
637
653
663
680
690
LT
1,311
1,321
1,340
1,350
1,369
LUPIN
1,742
1,760
1,778
1,796
1,814
M&M
1,234
1,243
1,251
1,260
1,268
MARUTI
4,518
4,569
4,653
4,704
4,788
NTPC
128
129
131
132
134
ONGC
225
227
230
232
236
PNB
130
134
136
139
141
POWERGRID
126
128
130
132
134
RELIANCE
905
919
929
943
953
SBIN
236
238
240
242
244
SUNPHARMA
84
86
88
90
92
TATAMOTORS
727
734
743
750
759
TATAPOWER
392
398
408
414
423
TATASTEEL
67
68
68
69
70
TCS
214
218
221
225
228
TECHM
2,356
2,377
2,407
2,428
2,459
ULTRACEMCO
514
517
521
524
529
VEDL
2,627
2,654
2,688
2,714
2,748
WIPRO
548
550
552
554
557
YESBANK
719
729
743
753
767
ZEEL
368
373
380
385
393
4
Technical & Derivatives Report
November 16, 2015
Research Team Tel: 022 - 39357800
For Technical Queries
For Derivatives Queries
DISCLAIMER
Angel Broking Private Limited (hereinafter referred to as “Angel”) is a registered Member of National Stock Exchange of India Limited,
Bombay Stock Exchange Limited and MCX Stock Exchange Limited. It is also registered as a Depository Participant with CDSL and
Portfolio Manager with SEBI. It also has registration with AMFI as a Mutual Fund Distributor. Angel Broking Private Limited is a
registered entity with SEBI for Research Analyst in terms of SEBI (Research Analyst) Regulations, 2014 vide registration number
INH000000164. Angel or its associates has not been debarred/ suspended by SEBI or any other regulatory authority for accessing
/dealing in securities Market. Angel or its associates including its relatives/analyst do not hold any financial interest/beneficial
ownership of more than 1% in the company covered by Analyst. Angel or its associates/analyst has not received any compensation /
managed or co-managed public offering of securities of the company covered by Analyst during the past twelve months. Angel/analyst
has not served as an officer, director or employee of company covered by Analyst and has not been engaged in market making activity
of the company covered by Analyst.
This document is solely for the personal information of the recipient, and must not be singularly used as the basis of any investment
decision. Nothing in this document should be construed as investment or financial advice. Each recipient of this document should
make such investigations as they deem necessary to arrive at an independent evaluation of an investment in the securities of the
companies referred to in this document (including the merits and risks involved), and should consult their own advisors to determine
the merits and risks of such an investment.
Reports based on technical and derivative analysis center on studying charts of a stock's price movement, outstanding positions and
trading volume, as opposed to focusing on a company's fundamentals and, as such, may not match with a report on a company's
fundamentals.
The information in this document has been printed on the basis of publicly available information, internal data and other reliable
sources believed to be true, but we do not represent that it is accurate or complete and it should not be relied on as such, as this
document is for general guidance only. Angel Broking Pvt. Limited or any of its affiliates/ group companies shall not be in any way
responsible for any loss or damage that may arise to any person from any inadvertent error in the information contained in this report.
Angel Broking Pvt. Limited has not independently verified all the information contained within this document. Accordingly, we cannot
testify, nor make any representation or warranty, express or implied, to the accuracy, contents or data contained within this document.
While Angel Broking Pvt. Limited endeavors to update on a reasonable basis the information discussed in this material, there may be
regulatory, compliance, or other reasons that prevent us from doing so.
This document is being supplied to you solely for your information, and its contents, information or data may not be reproduced,
redistributed or passed on, directly or indirectly.
Neither Angel Broking Pvt. Limited, nor its directors, employees or affiliates shall be liable for any loss or damage that may arise from
or in connection with the use of this information.
Note: Please refer to the important ‘Stock Holding Disclosure' report on the Angel website (Research Section). Also, please refer to the
latest update on respective stocks for the disclosure status in respect of those stocks. Angel Broking Pvt. Limited and its affiliates may
have investment positions in the stocks recommended in this report.
5