Technical & Derivatives Report
October 16, 2015
Sensex (27010) / Nifty (8180)
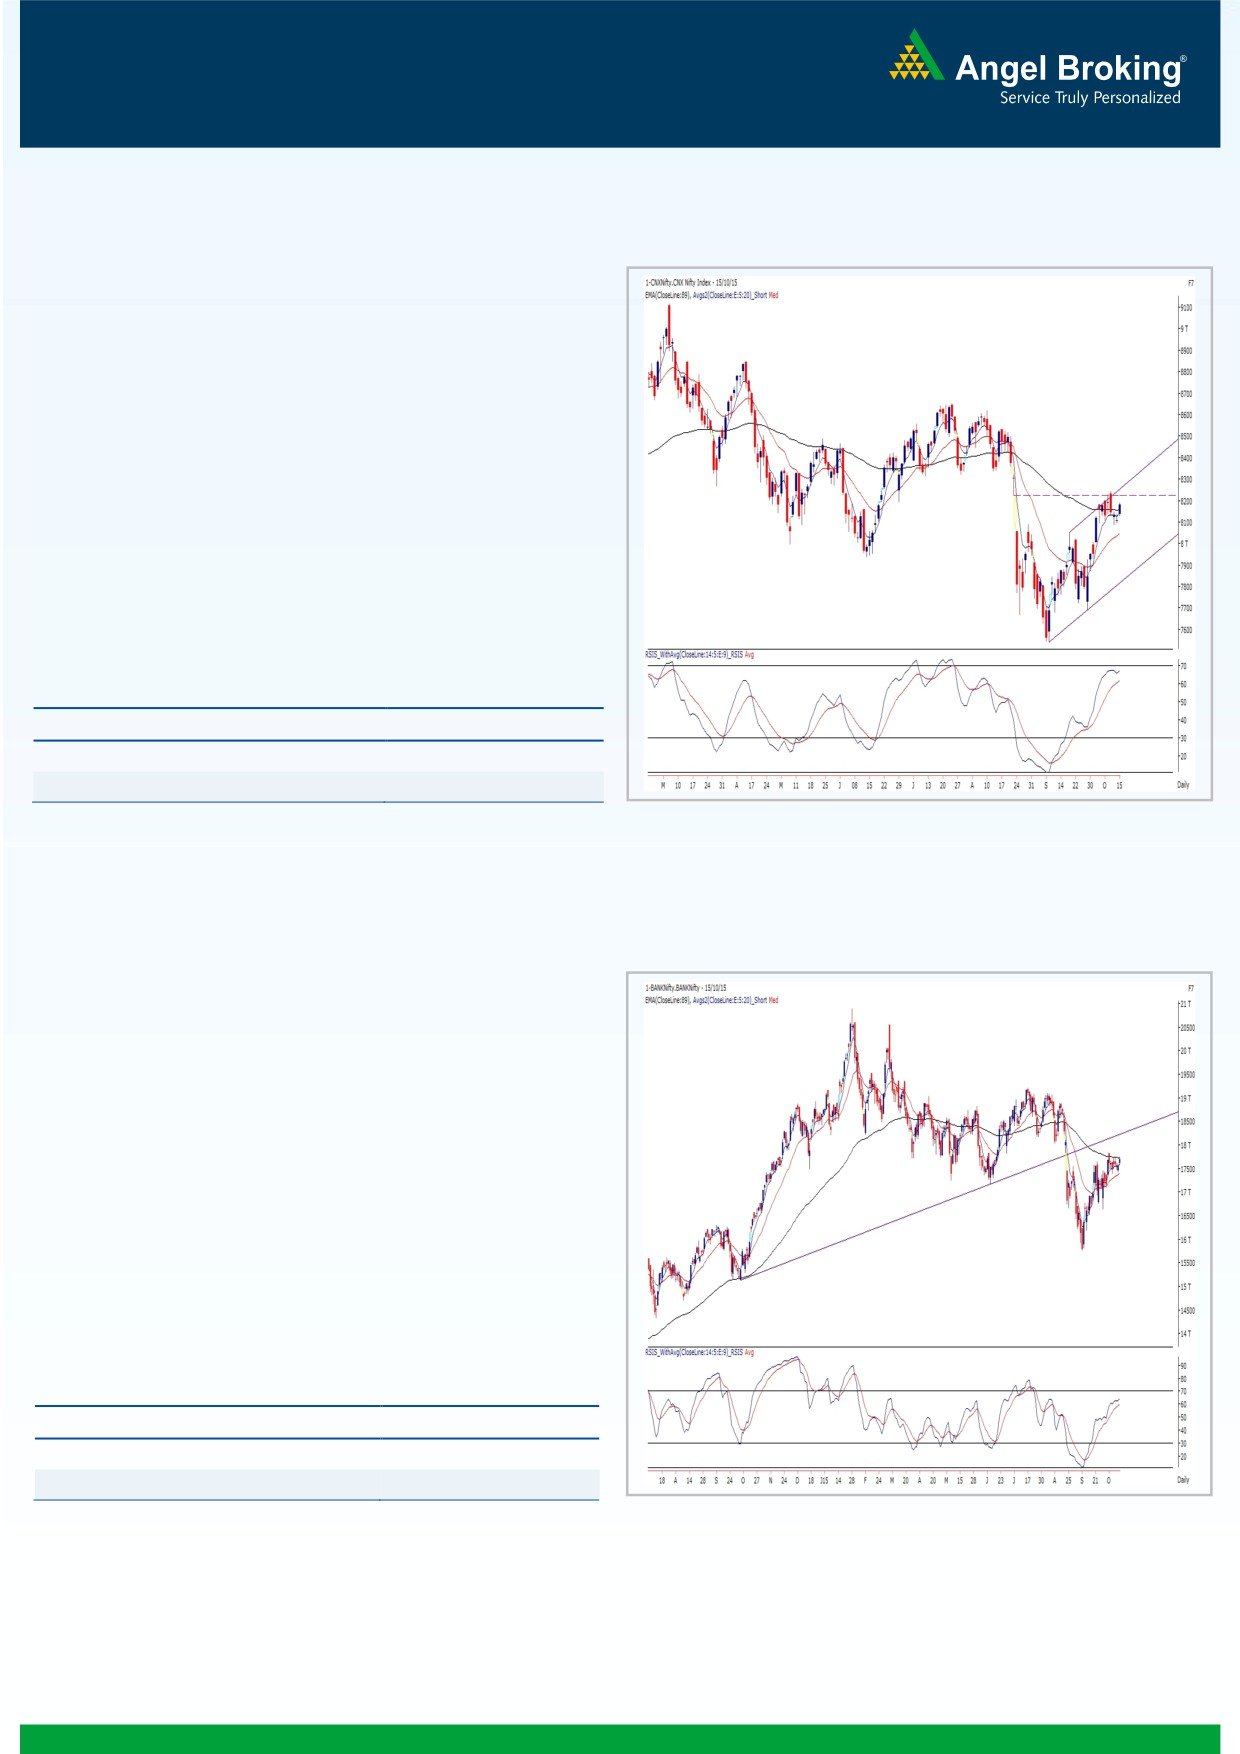
Exhibit 1: Nifty Daily Chart
Despite unfavorable cues from overnight correction in US
bourses, the Asian markets managed to trade with a positive bias
and thus, our benchmark index too kick started the session with
half a percent upside gap. This early morning lead extended a bit
in the remaining part of the day to end with decent gains.
After four days of lethargic movement, finally bulls had something
to cheer for. The Nifty maintained its optimism throughout the
session; but, the Nifty couldn't move beyond the 8200 mark.
Going forward, we continue to expect the Nifty to remain within a
small range of 8250 to 8050 whilst the 8250 mark is likely to act
as a major hurdle for the bulls. It’s advisable to stay light on
positions and focus more on stock specific moves.
Key Levels
Support 1 - 8130
Resistance 1 - 8225
Support 2 - 8090
Resistance 2 - 8250
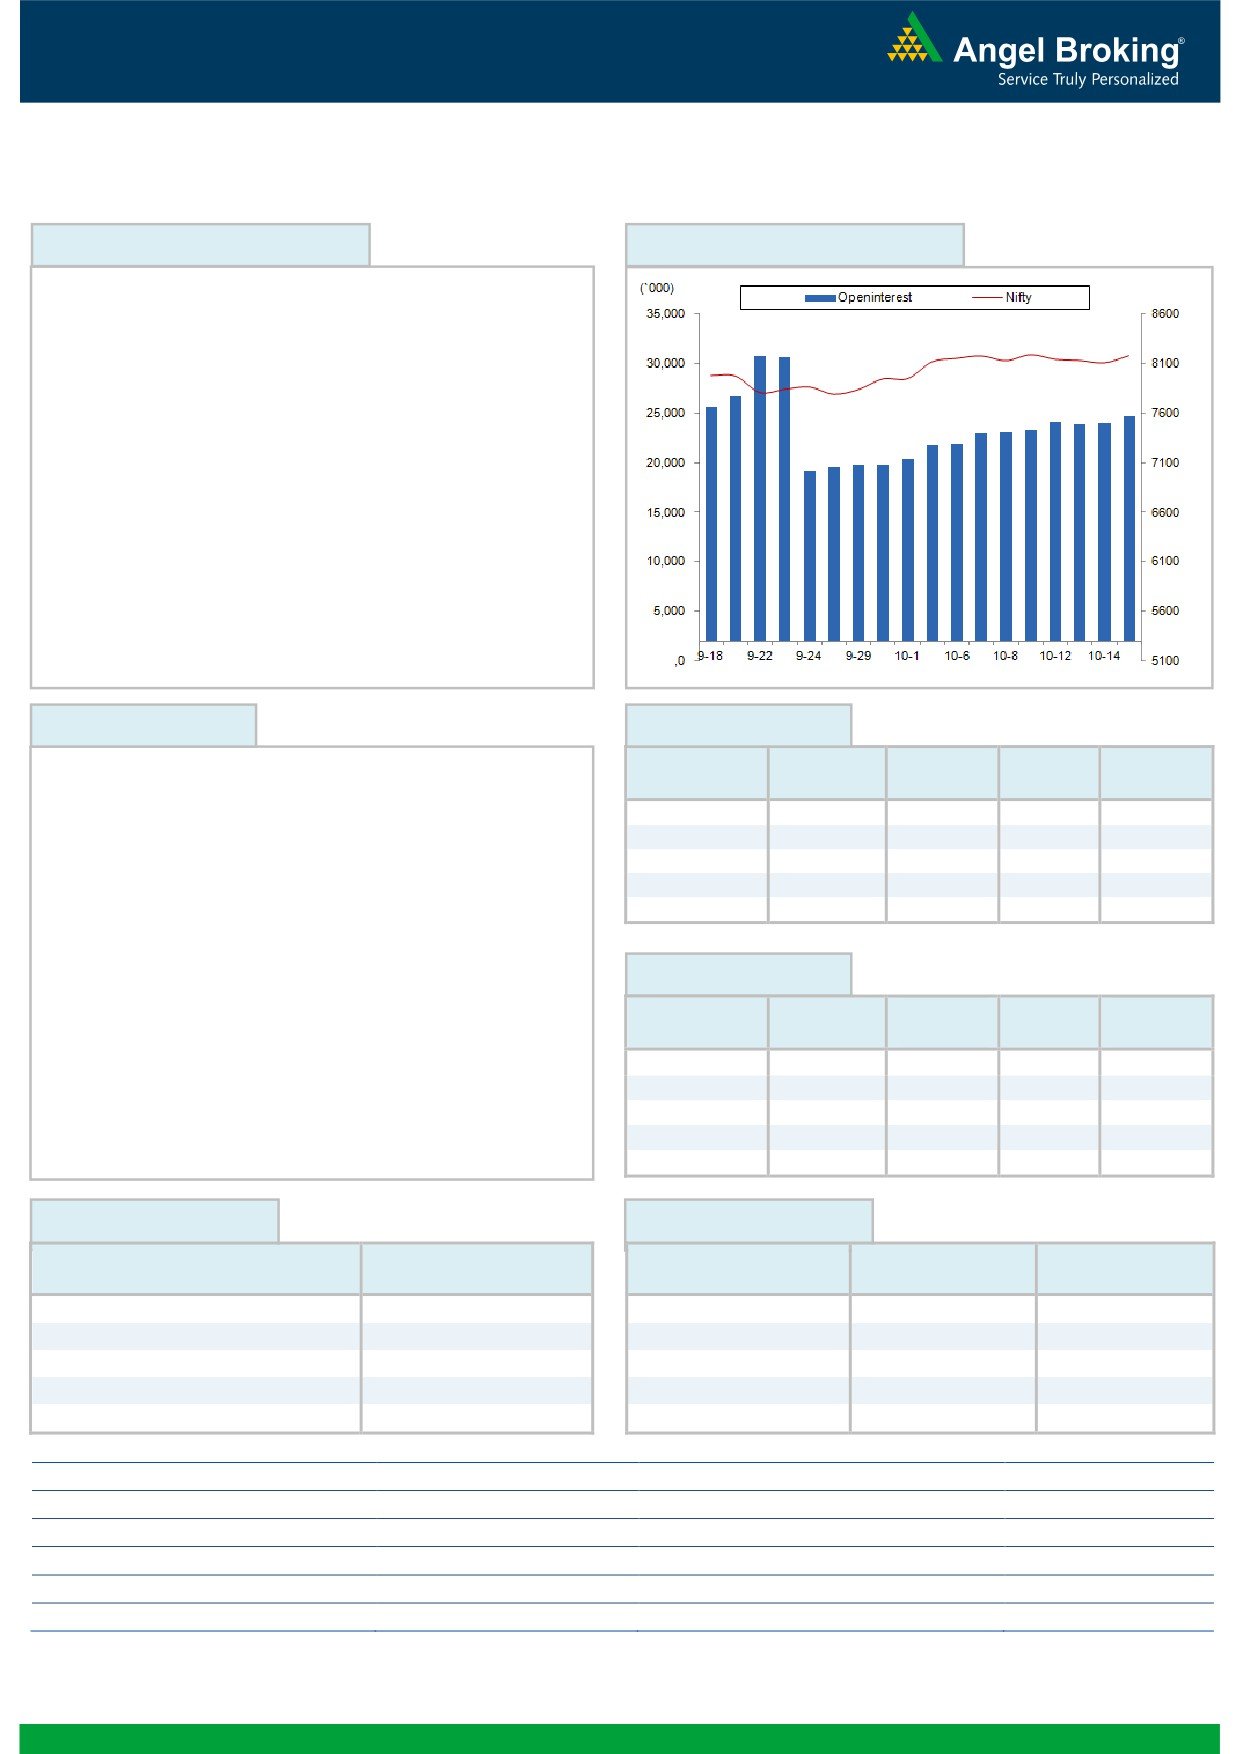
Bank Nifty Outlook - (17686)
Exhibit 2: Bank Nifty Daily
Yesterday, in-line with the broader indices, the Bank Nifty too
opened with an upside gap of around 50 points and rallied
higher in the first half of the session. However, we witnessed some
corrective action in the latter half of the session and as a result,
the Bank Nifty ended with gains of 0.81 percent. Currently, the
banking index is hovering around the ’89 EMA’ in the daily chart;
while, the gap area in the weekly chart and the
61.80%
retracement levels of the fall from 19229.05 to 15762.20 would
be a major hurdle for the Bulls. At this juncture, traders are
advised to be vigilant towards the stock specific moves rather than
taking undue risk in the index. Going forward, the immediate
resistance for the index is placed at 17842 and 17910 levels. On
the flipside, 17434 and 17350 levels will now act as support in
coming trading session.
Key Levels
Support 1 - 17434
Resistance 1 - 17842
Support 2 - 17350
Resistance 2 - 17910
1
Technical & Derivatives Report
October 16, 2015
Comments
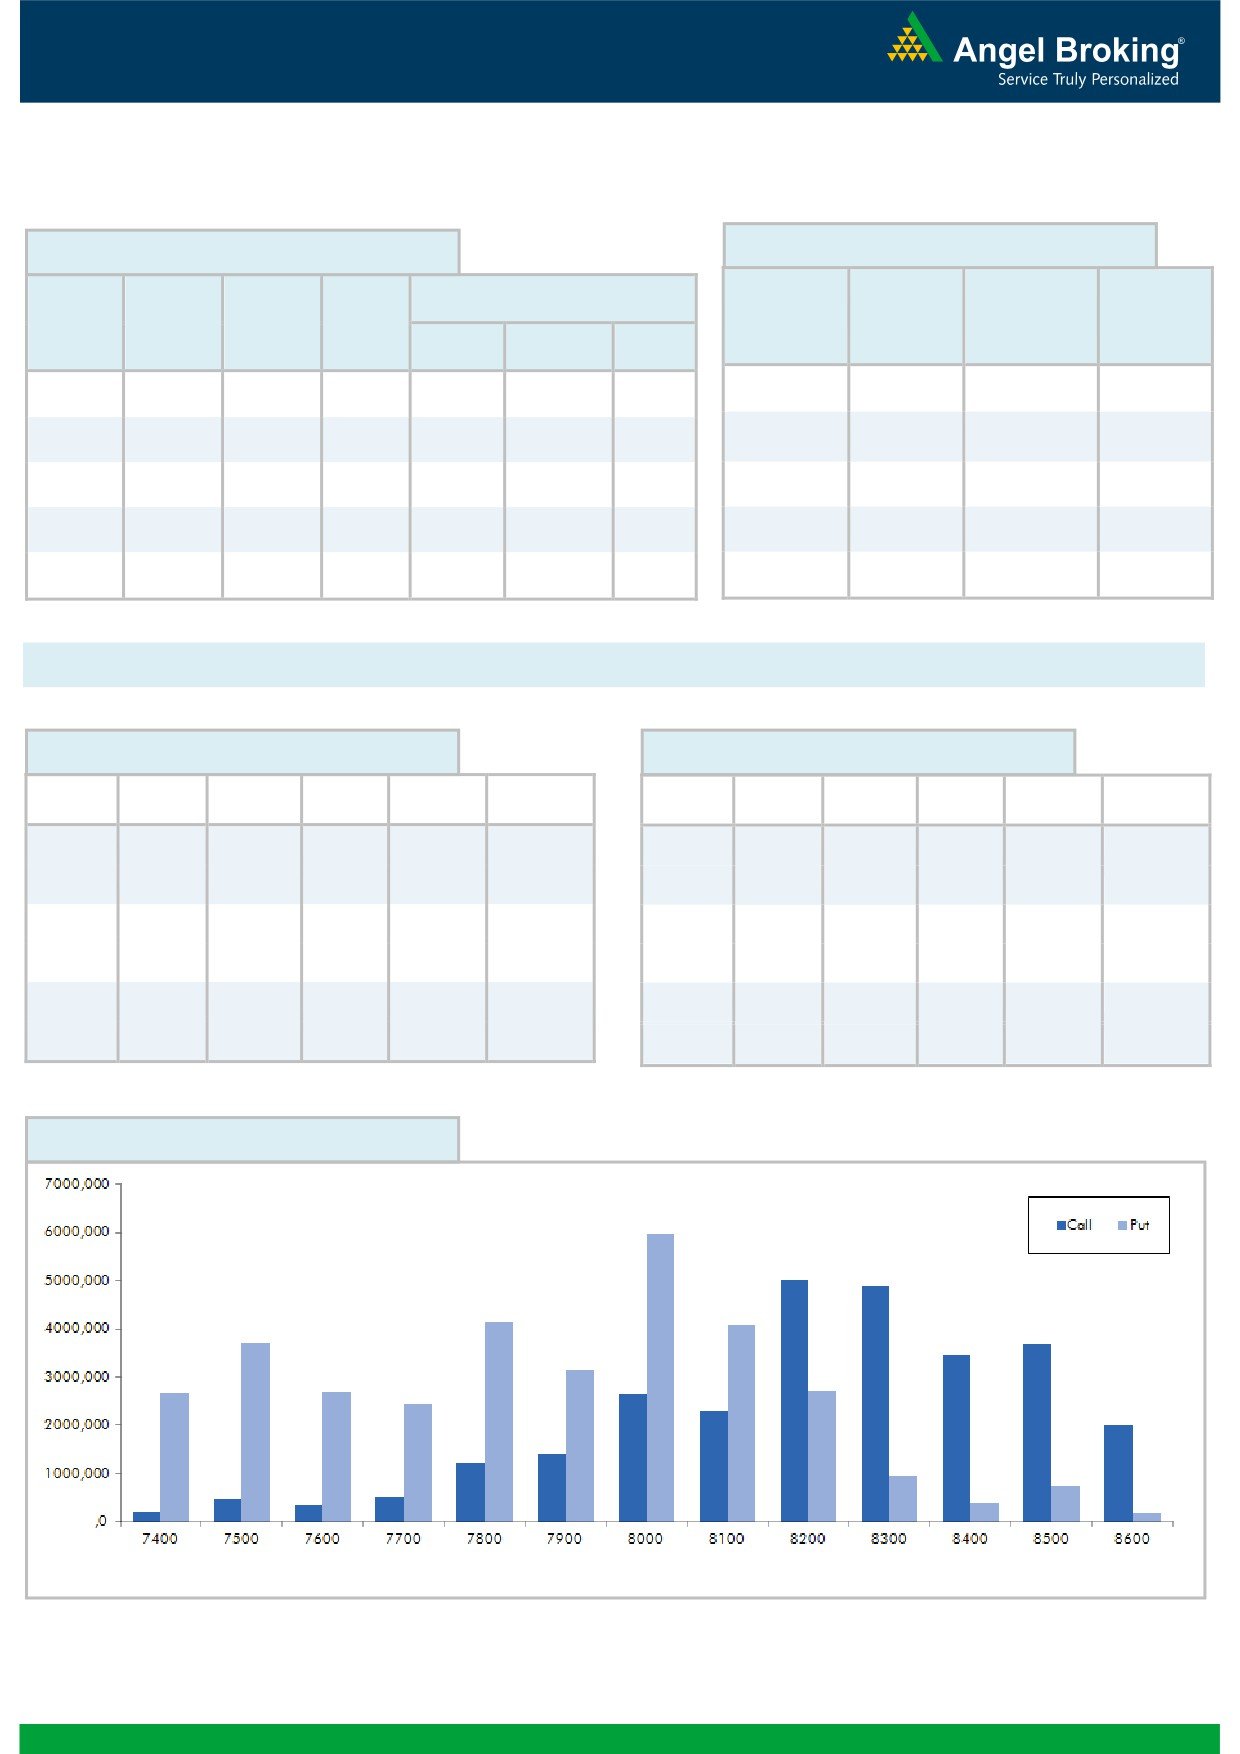
Nifty Vs OI
The Nifty futures open interest has increased by 3.24%
BankNifty futures open interest has increased by 5.82%
as market closed at 8179.50 levels.
The Nifty October future closed at a premium of 7.50
points against a premium of
13.50 points. The
November series closed at a premium of 48.35 points.
The Implied Volatility of at the money options has
decreased from 15.39% to 13.81%.
The total OI of the market is Rs. 2,25,420/- cr. and the
stock futures OI is Rs. 60,729/- cr.
Few of the liquid counters where we have seen high cost
of carry are AMTEKAUTO, GMRINFRA, JPASSOCIAT,
SOUTHBANK and ALBK.
Views
OI Gainers
OI
PRICE
Yesterday, FIIs were net buyers in equity segment to the
SCRIP
OI
PRICE
CHG. (%)
CHG. (%)
tune of Rs. 292 crores. While in Index Futures they sold
MINDTREE
524500
21.58
1402.35
-0.70
of Rs. 105 crores with rise in OI, suggesting mix of long
TV18BRDCST
17068000
14.09
32.95
-1.93
and short formation in last trading session.
PIDILITIND
749500
11.95
582.20
0.48
m
INDIACEM
26156000
9.96
84.55
3.81
In Index Options front, they bought of Rs. 749 crores
IRB
4238100
9.32
253.80
0.10
with marginal change in OI. In call options, we saw
some build-up in 8400 strike; meaningful unwinding
was also visible in 8100 call options. On the other hand
OI Losers
in put options, huge OI addition was seen in 8000 &
OI
PRICE
SCRIP
OI
PRICE
8100 strikes, followed by significant unwinding in 7900
CHG. (%)
CHG. (%)
put strike. Maximum OI is seen in 8200 call and 8000
SRF
928000
-5.41
1267.75
-0.34
KSCL
1126750
-4.41
475.65
-3.19
put options. We believe Nifty may trade in a narrow
TATAMTRDVR
15553400
-4.38
259.55
7.23
range of 7900-7950 on the lower side and 8200-8250
MCLEODRUSS
2566200
-3.87
175.95
2.21
on higher side.
HEXAWARE
3423000
-3.58
245.65
1.74
Historical Volatility
Put-Call Ratio
SCRIP
HV
SCRIP
PCR-OI
PCR-VOL
ZEEL
51.32
NIFTY
1.00
1.01
ADANIENT
84.78
BANKNIFTY
0.87
0.81
TATAMOTORS
67.57
INFY
0.31
0.27
TATAMTRDVR
64.32
TATAMOTORS
1.25
0.66
BPCL
37.98
RELIANCE
0.80
0.71
Strategy Date
Symbol
Strategy
Status
September 28, 2015
NIFTY
Long Strangle
Active
October 05, 2015
SBIN
Ratio Bear Put Spread
Active
October 12, 2015
LT
Long Put Ladder
Active
2
Technical & Derivatives Report
October 16, 2015
Turnover on 15-October 2015
FII Statistics for 15-October 2015
Open Interest
No. of
Turnover
Change
Instrument
Detail
Buy
Sell
Net
Contracts
( in Cr. )
(%)
Value
Change
Contracts
(in Cr.)
(%)
INDEX
INDEX
530283
14536.46
14.70
1932.34
2036.95
(104.61)
993104
24466.64
2.33
FUTURES
FUTURES
INDEX
INDEX
9194.98
8445.36
749.62
2228053
70901.53
0.01
5757666
131160.45
37.79
OPTIONS
OPTIONS
STOCK
STOCK
2515.54
2711.55
(196.01)
1803173
48274.55
0.09
840716
22435.30
11.17
FUTURES
FUTURES
STOCK
STOCK
1738.93
1745.07
(6.13)
132078
3567.41
(0.32)
517048
13347.13
-5.26
OPTIONS
OPTIONS
TOTAL
15381.79
14938.92
442.87
5156408
147210.14
0.47
TOTAL
7645713
181479.34
27.68
Nifty Spot = 8179.50
Lot Size = 25
Bull-Call Spreads
Bear-Put Spreads
Action
Strike
Price
Risk
Reward
BEP
Action
Strike
Price
Risk
Reward
BEP
Buy
Buy
8200
82.85
8100
59.80
40.80
59.20
a
8240.80
g.com
24.20
75.80
8075.80
Sell
Sell
8300
42.05
8000
35.60
Buy
Buy
8200
82.85
8100
59.80
64.95
135.05
8264.95
37.95
162.05
8062.05
Sell
Sell
8400
17.90
7900
21.85
Buy
Buy
8300
42.05
8000
35.60
24.15
75.85
8324.15
13.75
86.25
7986.25
Sell
Sell
8400
17.90
7900
21.85
Nifty Put-Call Analysis
3
Technical & Derivatives Report
October 16, 2015
Daily Pivot Levels for Nifty 50 Stocks
Scrips
S2
S1
PIVOT
R1
R2
ACC
1,352
1,361
1,378
1,388
1,405
AMBUJACEM
208
209
210
211
212
ASIANPAINT
857
863
871
877
885
AXISBANK
492
496
499
502
505
BAJAJ-AUTO
2,431
2,441
2,450
2,460
2,470
BANKBARODA
172
176
178
182
184
BHARTIARTL
340
346
350
355
359
BHEL
203
207
210
214
217
BOSCHLTD
20,911
21,022
21,186
21,297
21,461
BPCL
854
874
886
905
918
CAIRN
157
158
160
161
163
CIPLA
660
666
675
680
689
COALINDIA
329
335
339
346
350
DRREDDY
4,158
4,183
4,211
4,236
4,264
GAIL
312
319
323
329
333
GRASIM
3,606
3,625
3,651
3,670
3,695
HCLTECH
823
829
834
840
845
HDFC
1,279
1,287
1,296
1,304
1,313
HDFCBANK
1,072
1,078
1,087
1,093
1,103
HEROMOTOCO
2,468
2,516
2,548
2,596
2,628
HINDALCO
83
86
89
91
94
HINDUNILVR
755
773
787
805
819
ICICIBANK
282
284
286
288
289
IDEA
150
151
152
153
154
INDUSINDBK
945
951
959
965
973
INFY
1,082
1,090
1,097
1,105
1,112
ITC
340
345
348
353
357
KOTAKBANK
645
649
657
661
668
LT
1,538
1,549
1,556
1,568
1,575
LUPIN
2,050
2,075
2,093
2,118
2,137
M&M
1,247
1,261
1,281
1,295
1,315
MARUTI
4,214
4,296
4,343
4,424
4,471
NMDC
98
99
100
101
102
NTPC
123
124
125
126
128
ONGC
252
256
258
263
265
PNB
135
136
137
138
139
POWERGRID
132
134
135
136
137
RELIANCE
894
899
905
910
916
SBIN
244
246
248
251
253
VEDL
104
107
109
112
114
SUNPHARMA
874
881
887
894
899
TATAMOTORS
345
363
373
392
402
TATAPOWER
69
70
70
71
72
TATASTEEL
244
250
254
259
263
TCS
2,440
2,454
2,479
2,493
2,517
TECHM
531
538
547
554
562
ULTRACEMCO
2,878
2,912
2,942
2,976
3,006
WIPRO
569
573
580
585
592
YESBANK
735
747
754
766
773
ZEEL
379
399
411
431
443
4
Technical & Derivatives Report
October 16, 2015
Research Team Tel: 022 - 39357800
For Technical Queries
For Derivatives Queries
DISCLAIMER
Angel Broking Private Limited (hereinafter referred to as “Angel”) is a registered Member of National Stock Exchange of India Limited,
Bombay Stock Exchange Limited and MCX Stock Exchange Limited. It is also registered as a Depository Participant with CDSL and
Portfolio Manager with SEBI. It also has registration with AMFI as a Mutual Fund Distributor. Angel Broking Private Limited is a
registered entity with SEBI for Research Analyst in terms of SEBI (Research Analyst) Regulations, 2014 vide registration number
INH000000164. Angel or its associates has not been debarred/ suspended by SEBI or any other regulatory authority for accessing
/dealing in securities Market. Angel or its associates including its relatives/analyst do not hold any financial interest/beneficial
ownership of more than 1% in the company covered by Analyst. Angel or its associates/analyst has not received any compensation /
managed or co-managed public offering of securities of the company covered by Analyst during the past twelve months. Angel/analyst
has not served as an officer, director or employee of company covered by Analyst and has not been engaged in market making activity
of the company covered by Analyst.
This document is solely for the personal information of the recipient, and must not be singularly used as the basis of any investment
decision. Nothing in this document should be construed as investment or financial advice. Each recipient of this document should
make such investigations as they deem necessary to arrive at an independent evaluation of an investment in the securities of the
companies referred to in this document (including the merits and risks involved), and should consult their own advisors to determine
the merits and risks of such an investment.
Reports based on technical and derivative analysis center on studying charts of a stock's price movement, outstanding positions and
trading volume, as opposed to focusing on a company's fundamentals and, as such, may not match with a report on a company's
fundamentals.
The information in this document has been printed on the basis of publicly available information, internal data and other reliable
sources believed to be true, but we do not represent that it is accurate or complete and it should not be relied on as such, as this
document is for general guidance only. Angel Broking Pvt. Limited or any of its affiliates/ group companies shall not be in any way
responsible for any loss or damage that may arise to any person from any inadvertent error in the information contained in this report.
Angel Broking Pvt. Limited has not independently verified all the information contained within this document. Accordingly, we cannot
testify, nor make any representation or warranty, express or implied, to the accuracy, contents or data contained within this document.
While Angel Broking Pvt. Limited endeavors to update on a reasonable basis the information discussed in this material, there may be
regulatory, compliance, or other reasons that prevent us from doing so.
This document is being supplied to you solely for your information, and its contents, information or data may not be reproduced,
redistributed or passed on, directly or indirectly.
Neither Angel Broking Pvt. Limited, nor its directors, employees or affiliates shall be liable for any loss or damage that may arise from
or in connection with the use of this information.
Note: Please refer to the important ‘Stock Holding Disclosure' report on the Angel website (Research Section). Also, please refer to the
latest update on respective stocks for the disclosure status in respect of those stocks. Angel Broking Pvt. Limited and its affiliates may
5