Technical & Derivatives Report
March 16, 2016
Sensex (24551) / Nifty (7461)
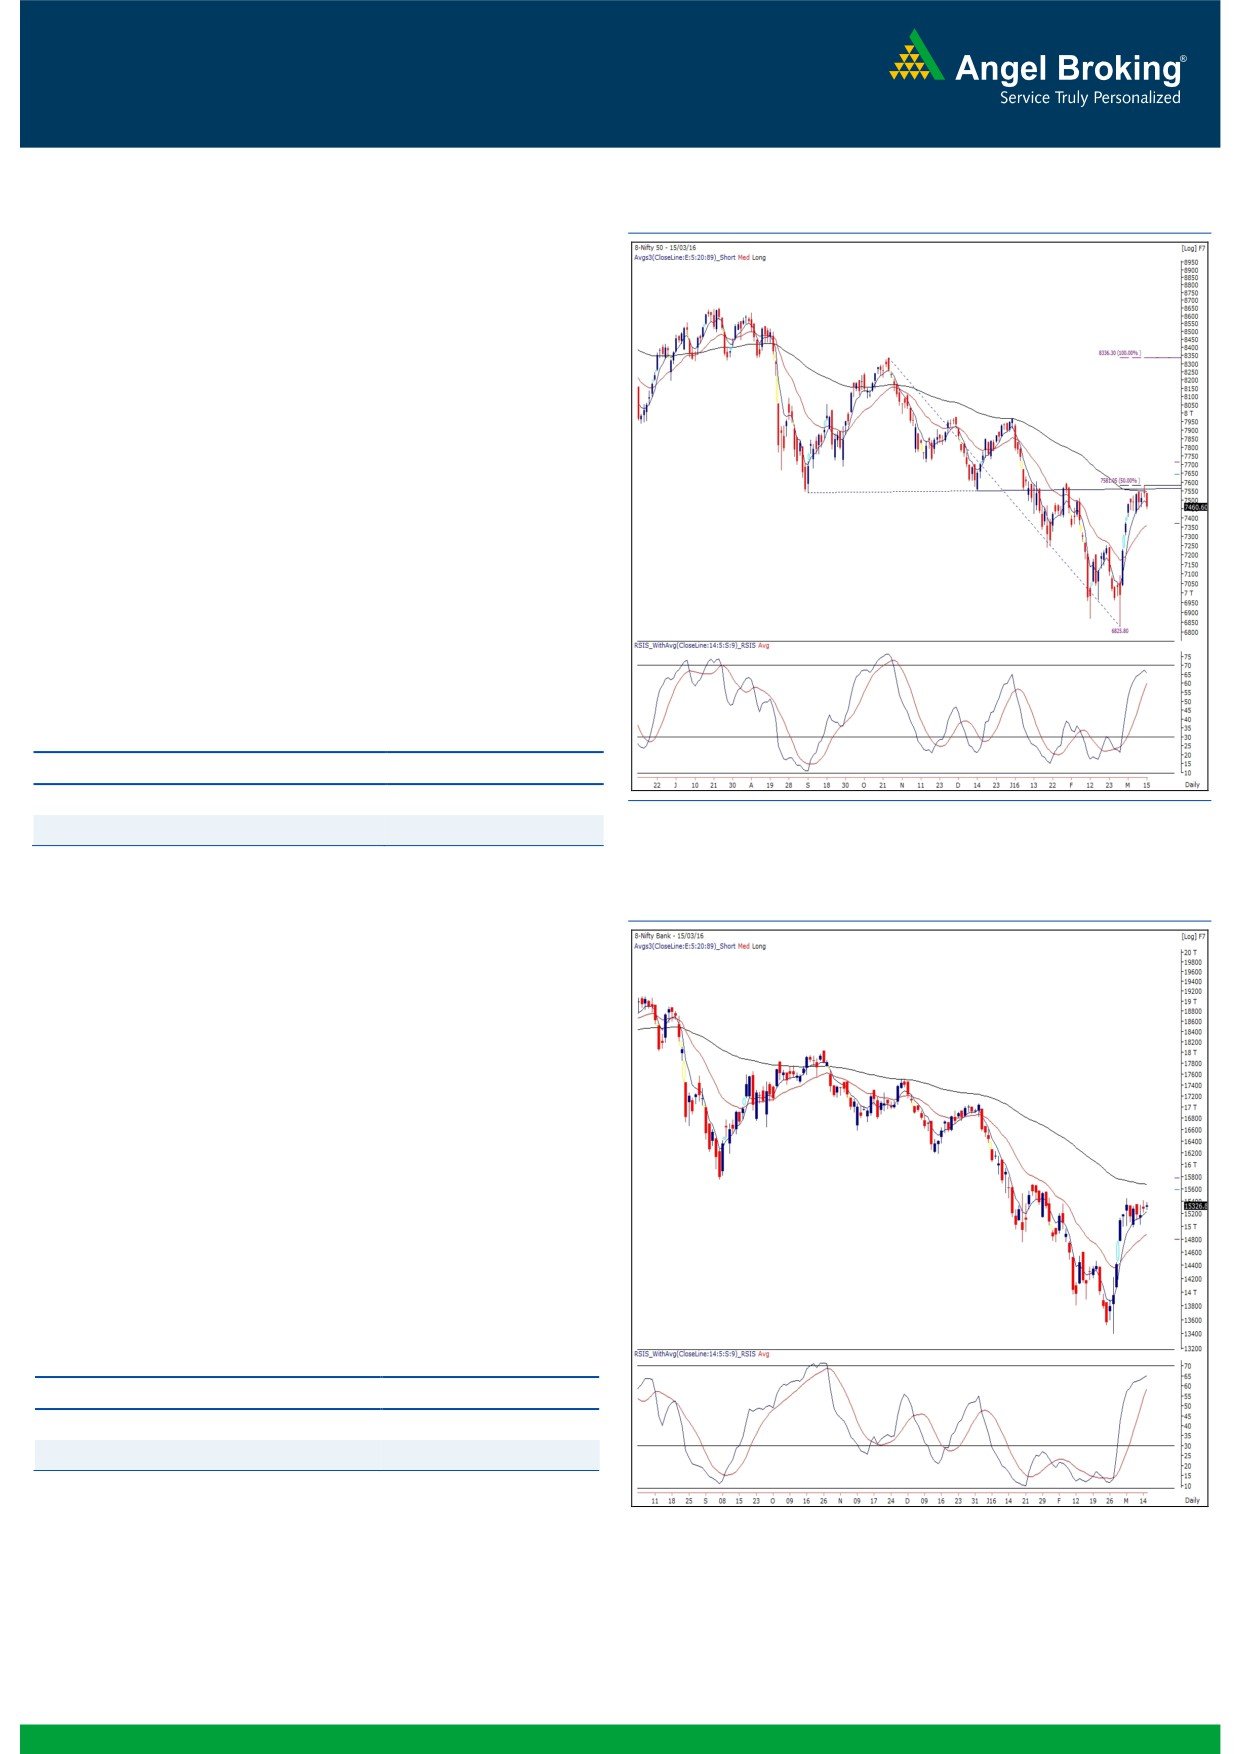
Exhibit 1: Nifty Daily Chart
Yesterday, the Nifty opened on a flat note and started
correcting from initial trades. Nifty continued to make ‘Lower
Lows’ throughout the session and eventually ended the session
with the loss of 1.04 percent over its previous close.
We had indicated in our previous report that a close below
7515 can be a short term reversal trigger and yesterday’s
candle reaffirms the same as we are now witnessing formation
of ‘Evening Doji Star’ pattern on daily chart. Though, we are
observing formation of bearish candlestick pattern around
resistance zone, we are not expecting major correction in Nifty
as couple of gap area around 7400 and 7300 levels are
going to act as a strong support for the index. Thus, traders
are advised to trade on stock specific ideas in near term.
Going forward, immediate resistance for the Nifty is placed at
7515 - 7585 levels; whereas, intraday support levels are seen
at 7424 - 7380 levels.
Key Levels
Support 1 - 7424
Resistance 1 - 7515
Support 2 - 7380
Resistance 2 -
7585
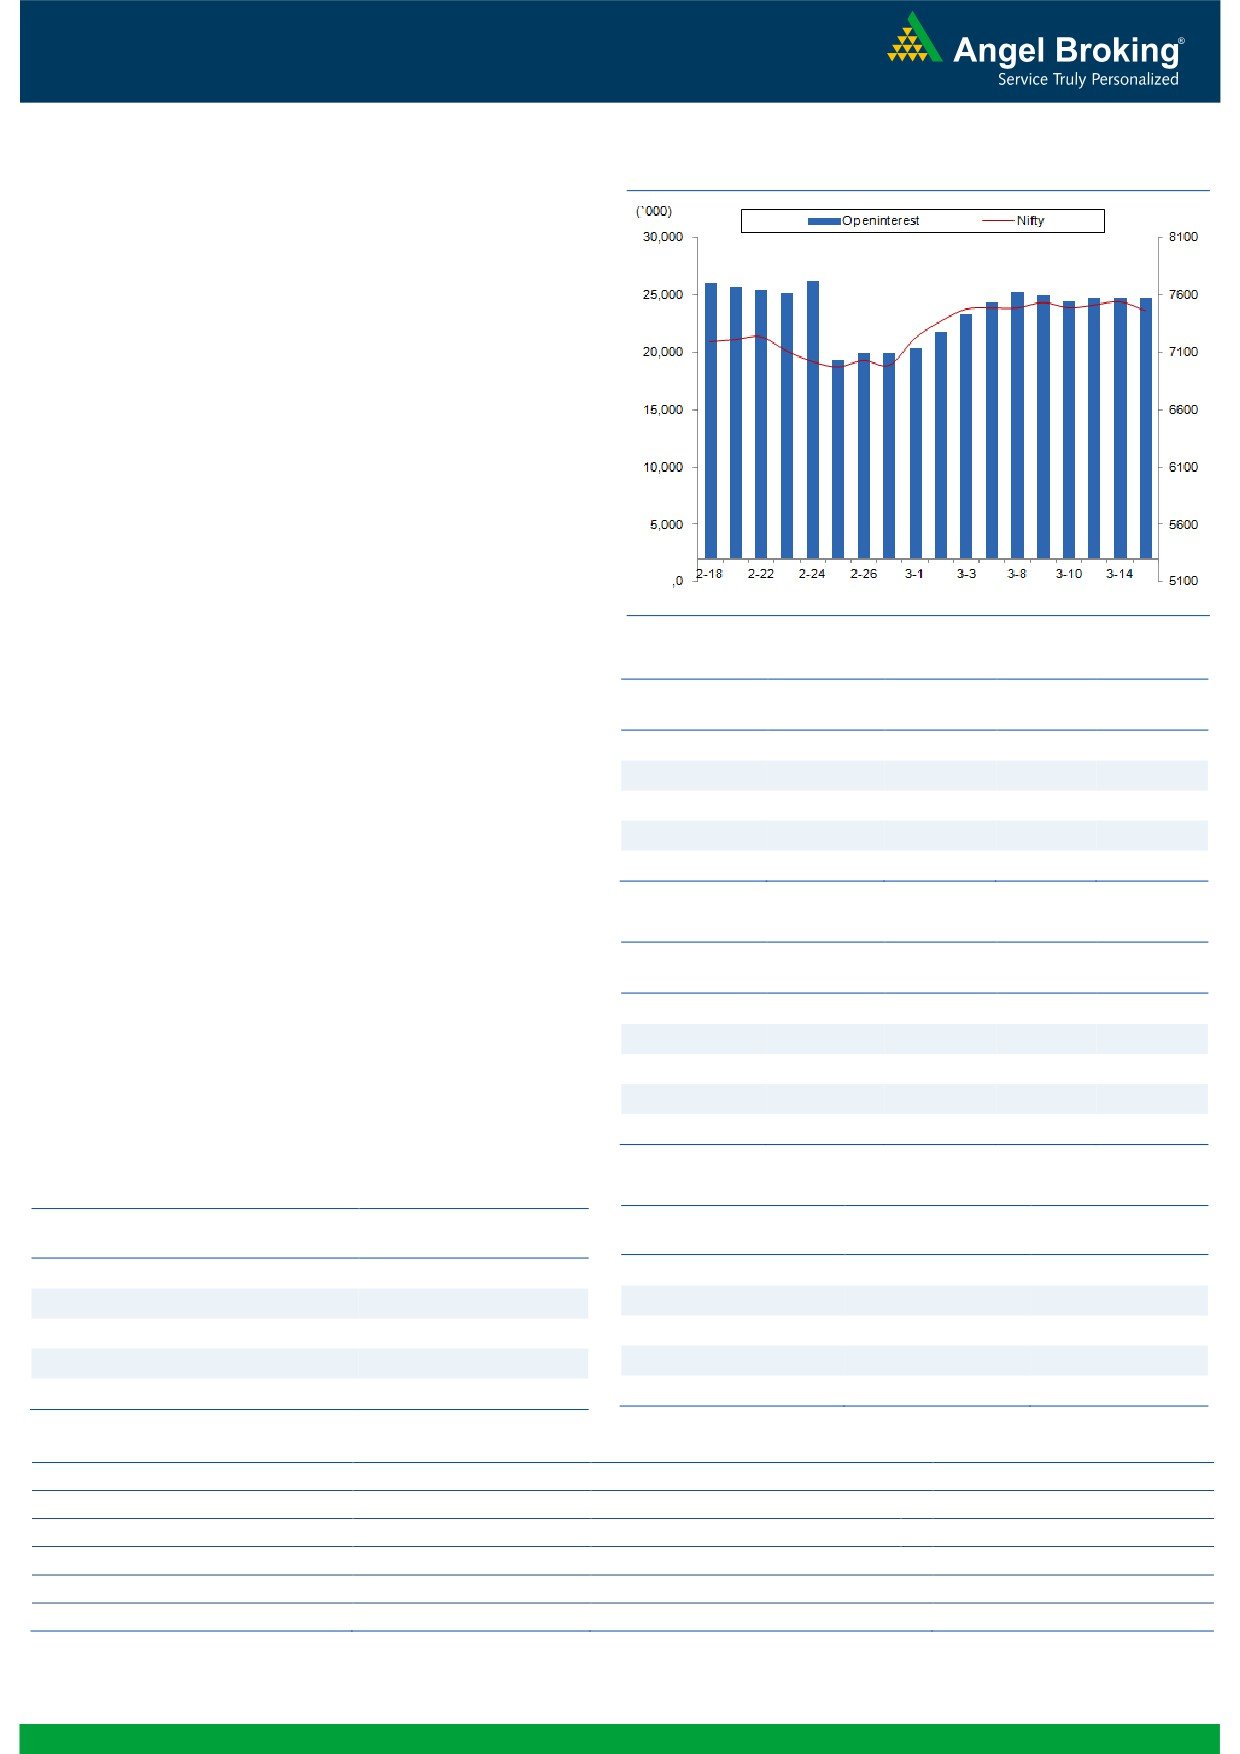
Exhibit 2: Nifty Bank Daily Chart
Nifty Bank Outlook - (15327)
In yesterday's trading session, the index traded in a narrow
range and ended the session with marginal gains of 0.32%.
The index continued its consolidation phase which has been
seen since last few trading sessions. Though, yesterday the
index outperformed the Nifty index which had shown
corrective action amidst negative breadth in broader market.
As of now, there is no directional movement in the Nifty Bank
index as the index has traded in range of 15000 - 15450
since last eight trading sessions. Only a move beyond this
range will lead to near term directional momentum. The
intraday support in the index are placed around 15140 and
15000 whereas resistances are seen around 15452 and
15700.
Key Levels
Support 1 - 15140
Resistance 1 - 15452
Support 2 - 15000
Resistance 2 - 15700
1
Technical & Derivatives Report
March 16, 2016
Comments
Nifty Vs OI
The Nifty futures open interest has increased by 0.03%
BankNifty futures open interest has decreased by 2.30%
as market closed at 7460.60 levels.
The Nifty March future closed at a premium of 24.80
points against a premium of 8.10 points. The April series
closed at a premium of 63.35 points.
The Implied Volatility of at the money options has
increased from 14.70% to 15.84%.
The total OI of the market is Rs. 2,28,077/- cr. and the
stock futures OI is Rs. 54,948/- cr.
Few of the liquid counters where we have seen high cost
of carry are JPASSOCIAT, JISLJALEQS, UNITECH,
GMRINFRA and IFCI.
Views
OI Gainers
FIIs activity in cash market segment remained subdued
OI
PRICE
SCRIP
OI
PRICE
yesterday. While in Index Futures, they were net buyers
CHG. (%)
CHG. (%)
ANDHRABANK
10512000
18.59
51.85
-0.67
of Rs. 554 crores with some fall in OI, suggesting short
CAIRN
11841000
9.40
146.25
-1.28
covering in last trading session.
APOLLOHOSP
1068000
8.10
1353.15
-3.99
In Index Options front, FIIs bought of Rs. 873 crores with
TATAELXSI
347700
7.81
1946.10
-0.84
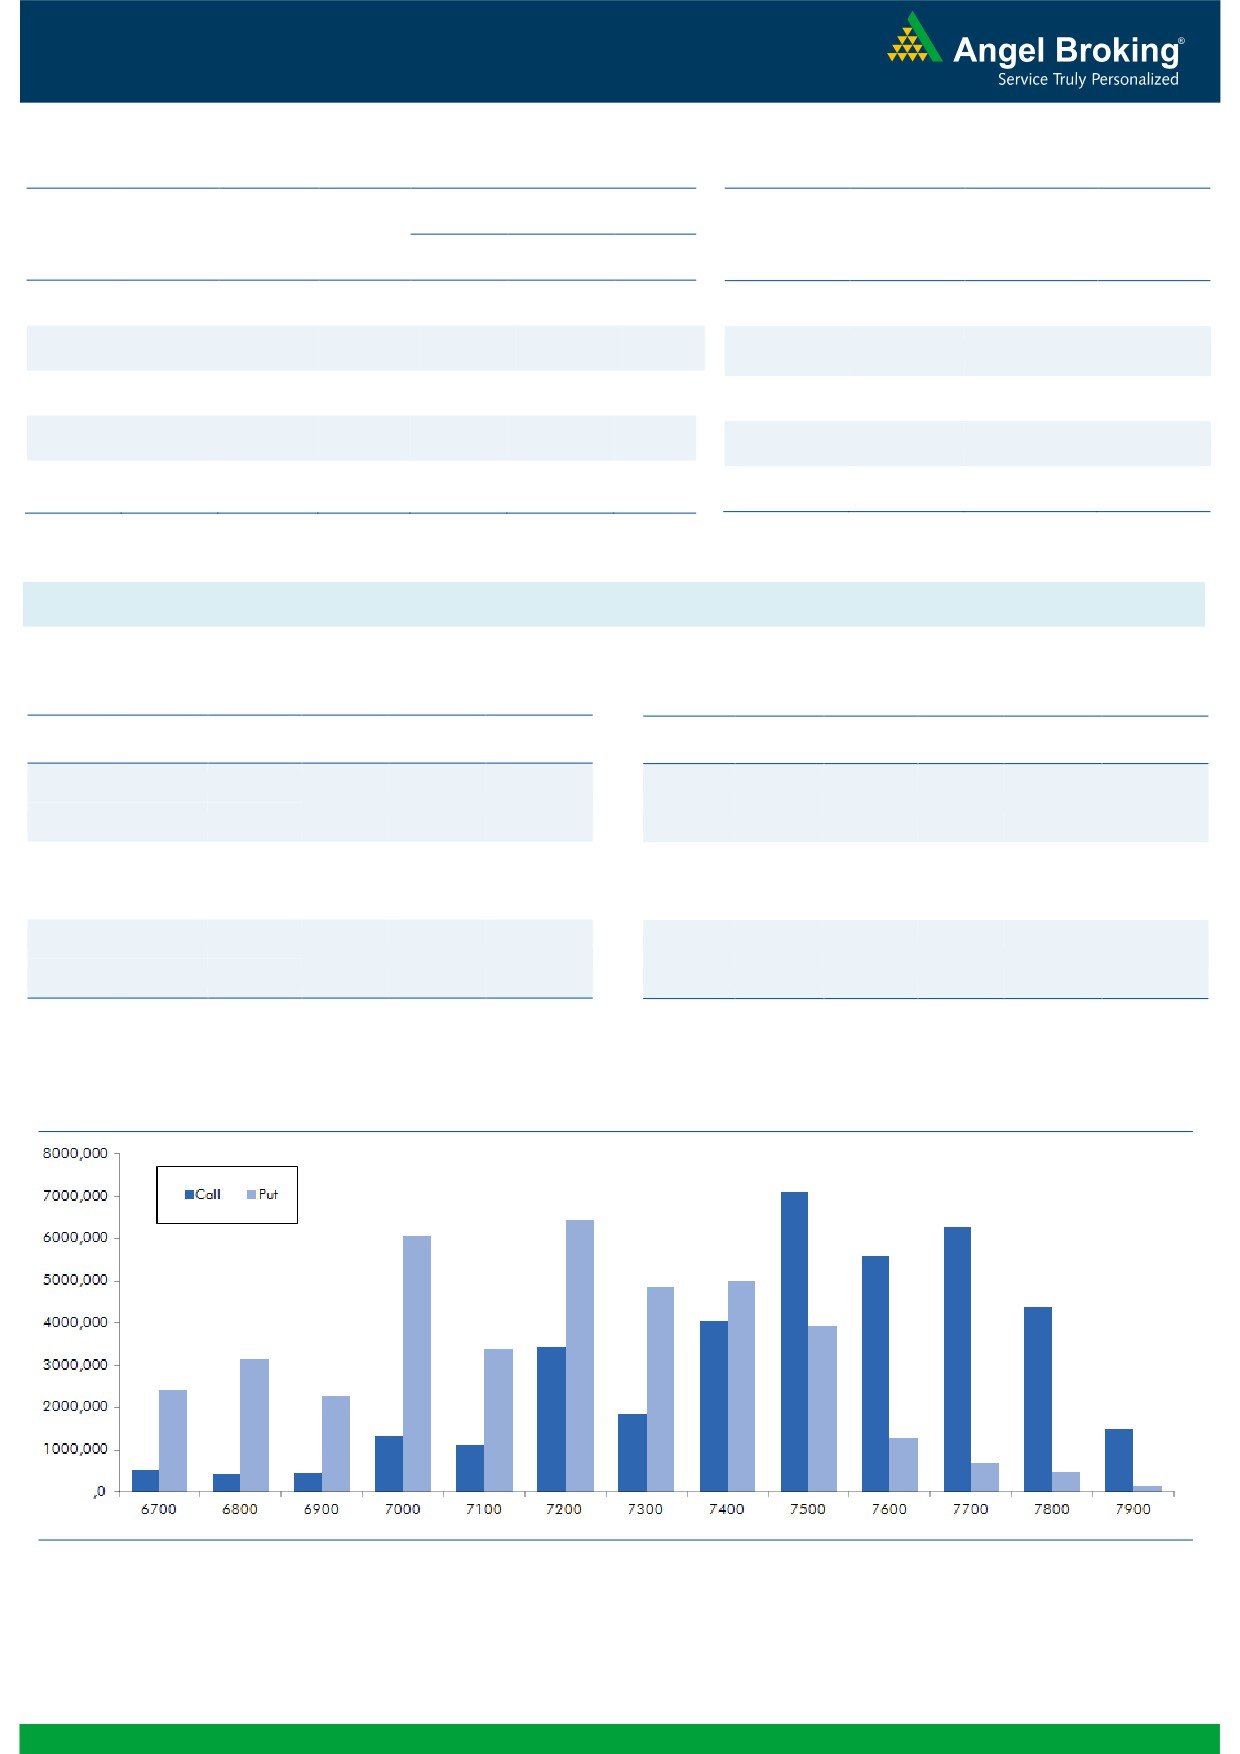
some rise in OI. We hardly saw any meaningful buildup
in both call and put options. 7500 and 7700 call optionsng.com
HEROMOTOCO
1136000
7.49
2788.60
-0.07
were comparatively active and they also added some
fresh OI. Maximum OI in current series is visible in 7500
OI Losers
call and 7200 put options. In this up move, we witnessed
OI
PRICE
SCRIP
OI
PRICE
good amount of buying, both in equity and Index Futures
CHG. (%)
CHG. (%)
CROMPGREAV
10026000
-61.34
43.90
-17.48
segment. Seeing the quantum of longs formed by bigger
ACC
1405875
-9.71
1247.20
0.48
hands, we believe Nifty may continue to show strength.
MCDOWELL-N
732250
-9.23
2475.65
2.24
Any dip in market can be a buying opportunity.
Large cap Stock Futures that added shorts in yesterday’s
NMDC
10800000
-6.78
94.40
-0.58
fall are CAIRN, LUPIN, ZEEL, BAJAJ-AUTO and IDEA.
CEATLTD
1170400
-5.64
1080.35
0.67
Historical Volatility
Put-Call Ratio
SCRIP
HV
SCRIP
PCR-OI
PCR-VOL
LUPIN
51.24
NIFTY
0.95
0.96
DIVISLAB
39.57
BANKNIFTY
1.08
0.83
HDFC
35.46
SBIN
0.79
0.41
APOLLOHOSP
37.69
ICICIBANK
0.91
0.79
MARICO
34.48
RELIANCE
0.51
0.52
Strategy Date
Symbol
Strategy
Status
February 29, 2016
RELIANCE
Ratio Bull Call Spread
Active
March 05, 2016
BHEL
Long Call Ladder
Active
March 12, 2016
NIFTY
Ratio Bull Call Spread
Not Activated
2
Technical & Derivatives Report
March 16, 2016
FII Statistics for 15-March 2016
Turnover on 15-March 2016
Open Interest
No. of
Turnover
Change
Detail
Buy
Sell
Net
Instrument
Value
Change
Contracts
( in Cr. )
(%)
Contracts
(in Cr.)
(%)
INDEX
INDEX
1892.96
1339.28
553.68
308544
16937.29
(1.48)
252046
13273.56
-3.53
FUTURES
FUTURES
INDEX
INDEX
22716.74
21843.26
873.48
1391184
76774.47
0.95
2617014
144774.57
-3.78
OPTIONS
OPTIONS
STOCK
2838.58
3522.18
(683.60)
1036854
46603.35
(0.18)
STOCK
FUTURES
448808
20615.94
5.68
FUTURES
STOCK
STOCK
1611.78
1616.60
(4.82)
79887
3648.18
3.62
OPTIONS
239670
10834.68
-22.29
OPTIONS
TOTAL
29060.07
28321.32
738.75
2816469
143963.29
0.33
TOTAL
3557538
189498.75
-4.13
Nifty Spot = 7460.60
Lot Size = 75
Bull-Call Spreads
Bear-Put Spreads
Action
Strike
Price
Risk
Reward
BEP
Action
Strike
Price
Risk
Reward
BEP
Buy
7500
90.45
Buy
7400
65.00
41.50
58.50
7541.50
25.35
74.65
7374.65
Sell
7600
48.95
Sell
7300
39.65
Buy
7500
90.45
Buy
7400
65.00
67.00
133.00
7567.00
40.70
159.30
7359.30
Sell
7700
23.45
Sell
7200
24.30
Buy
7600
48.95
Buy
7300
39.65
25.50
74.50
7625.50
15.35
84.65
7284.65
Sell
7700
23.45
Sell
7200
24.30
Note: Above mentioned Bullish or Bearish Spreads in Nifty (March Series) are given as an information and not as a recommendation.
Nifty Put-Call Analysis
3
Technical & Derivatives Report
March 16, 2016
Daily Pivot Levels for Nifty 50 Stocks
Scrips
S2
S1
PIVOT
R1
R2
ACC
1,225
1,233
1,239
1,246
1,252
ADANIPORTS
223
226
230
232
236
AMBUJACEM
201
203
205
207
208
ASIANPAINT
859
872
889
902
919
AXISBANK
413
416
419
422
425
BAJAJ-AUTO
2,232
2,255
2,292
2,315
2,351
BANKBARODA
139
141
143
145
146
BHARTIARTL
333
338
341
346
350
BHEL
104
105
106
107
108
BOSCHLTD
17,664
17,896
18,051
18,284
18,439
BPCL
798
804
812
819
826
CAIRN
144
147
150
152
155
CIPLA
512
518
529
535
546
COALINDIA
293
294
297
298
300
DRREDDY
3,034
3,084
3,158
3,208
3,282
GAIL
331
336
342
346
352
GRASIM
3,492
3,521
3,575
3,604
3,658
HCLTECH
800
806
816
822
833
HDFC
1,084
1,098
1,123
1,137
1,162
HDFCBANK
1,016
1,021
1,027
1,033
1,039
HEROMOTOCO
2,788
2,800
2,819
2,832
2,851
HINDALCO
82
83
85
85
87
HINDUNILVR
823
832
844
853
866
ICICIBANK
218
220
222
224
227
IDEA
97
98
100
101
103
INDUSINDBK
907
913
922
928
938
INFY
1,114
1,124
1,139
1,150
1,165
ITC
308
312
319
323
330
KOTAKBANK
627
633
638
644
649
LT
1,162
1,172
1,185
1,194
1,207
LUPIN
1,663
1,693
1,746
1,776
1,829
M&M
1,187
1,196
1,207
1,216
1,226
MARUTI
3,586
3,620
3,650
3,684
3,714
NTPC
125
126
127
128
129
ONGC
204
206
207
209
210
PNB
81
82
83
84
86
POWERGRID
137
138
139
140
141
RELIANCE
1,008
1,014
1,021
1,027
1,034
SBIN
180
183
184
187
189
VEDL
85
87
89
90
92
SUNPHARMA
828
835
848
856
869
TATAMOTORS
352
356
364
368
375
TATAPOWER
58
58
59
59
60
TATASTEEL
291
296
299
304
307
TCS
2,294
2,312
2,338
2,356
2,381
TECHM
449
454
465
471
481
ULTRACEMCO
2,971
2,980
2,994
3,004
3,018
WIPRO
520
527
535
541
549
YESBANK
788
800
808
820
828
ZEEL
373
380
391
398
409
4
Technical & Derivatives Report
March 16, 2016
Research Team Tel: 022 - 39357800
For Technical Queries
For Derivatives Queries
DISCLAIMER
Angel Broking Private Limited (hereinafter referred to as “Angel”) is a registered Member of National Stock Exchange of India Limited,
Bombay Stock Exchange Limited and MCX Stock Exchange Limited. It is also registered as a Depository Participant with CDSL and
Portfolio Manager with SEBI. It also has registration with AMFI as a Mutual Fund Distributor. Angel Broking Private Limited is a
registered entity with SEBI for Research Analyst in terms of SEBI (Research Analyst) Regulations, 2014 vide registration number
INH000000164. Angel or its associates has not been debarred/ suspended by SEBI or any other regulatory authority for accessing
/dealing in securities Market. Angel or its associates including its relatives/analyst do not hold any financial interest/beneficial
ownership of more than 1% in the company covered by Analyst. Angel or its associates/analyst has not received any compensation /
managed or co-managed public offering of securities of the company covered by Analyst during the past twelve months. Angel/analyst
has not served as an officer, director or employee of company covered by Analyst and has not been engaged in market making activity
of the company covered by Analyst.
This document is solely for the personal information of the recipient, and must not be singularly used as the basis of any investment
decision. Nothing in this document should be construed as investment or financial advice. Each recipient of this document should
make such investigations as they deem necessary to arrive at an independent evaluation of an investment in the securities of the
companies referred to in this document (including the merits and risks involved), and should consult their own advisors to determine
the merits and risks of such an investment.
Reports based on technical and derivative analysis center on studying charts of a stock's price movement, outstanding positions and
trading volume, as opposed to focusing on a company's fundamentals and, as such, may not match with a report on a company's
fundamentals.
The information in this document has been printed on the basis of publicly available information, internal data and other reliable
sources believed to be true, but we do not represent that it is accurate or complete and it should not be relied on as such, as this
document is for general guidance only. Angel Broking Pvt. Limited or any of its affiliates/ group companies shall not be in any way
responsible for any loss or damage that may arise to any person from any inadvertent error in the information contained in this report.
Angel Broking Pvt. Limited has not independently verified all the information contained within this document. Accordingly, we cannot
testify, nor make any representation or warranty, express or implied, to the accuracy, contents or data contained within this document.
While Angel Broking Pvt. Limited endeavors to update on a reasonable basis the information discussed in this material, there may be
regulatory, compliance, or other reasons that prevent us from doing so.
This document is being supplied to you solely for your information, and its contents, information or data may not be reproduced,
redistributed or passed on, directly or indirectly.
Neither Angel Broking Pvt. Limited, nor its directors, employees or affiliates shall be liable for any loss or damage that may arise from
or in connection with the use of this information.
Note: Please refer to the important ‘Stock Holding Disclosure' report on the Angel website (Research Section). Also, please refer to the
latest update on respective stocks for the disclosure status in respect of those stocks. Angel Broking Pvt. Limited and its affiliates may
have investment positions in the stocks recommended in this report.
5