Technical & Derivatives Report
February 16, 2016
Sensex (23554) / Nifty (7163)
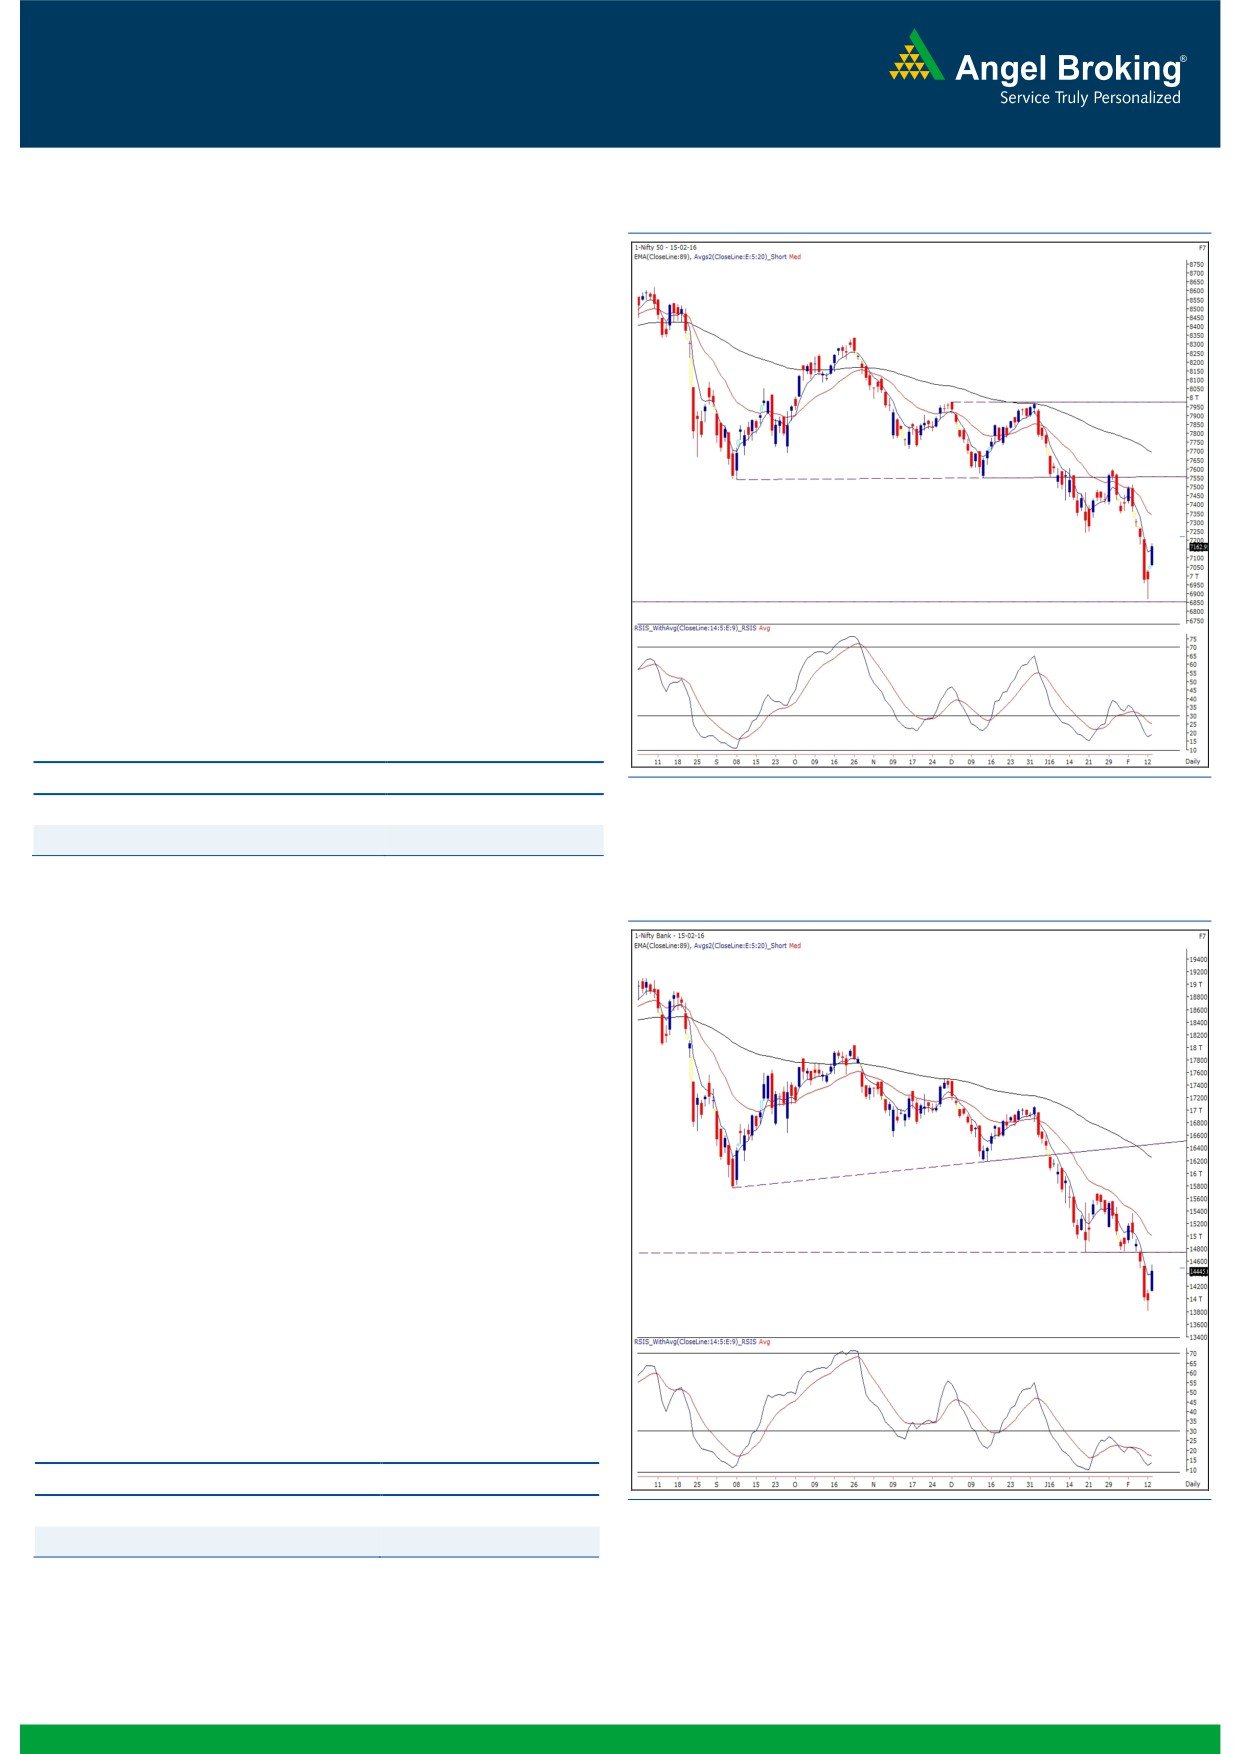
Exhibit 1: Nifty Daily Chart
The trading for the week kick started with a decent upside gap
citing to relief rally across the globe. In fact, the optimism
accelerated as the day progressed, which eventually resulted in to
a biggest single day rally of the calendar month 2016.
Friday’s ‘Bullish Hammer’ pattern on daily charts certainly proved
its significance as the Nifty rallied to first meet with our expected
level of 7090 and then 7150. A v-shaped recovery of 300 points
from Friday’s low of 6869 seems to have rejuvenated some of the
bulls after a relentless fall in the recent past. Considering the
broad based rally, we expect an extension of this up move
towards 7240 - 7280 levels. However, it would be a daunting
task for the bulls to break this hurdle. Thus, momentum traders
are advised to reassess their long positions once Nifty approaches
above mentioned resistance zone. On the flipside, the immediate
support now would be seen at 7056.80 to 7034.80, which is
yesterday’s gap area. It’s advisable to concentrate on stock
specific movements by following strict stop losses.
Key Levels
Support 1 - 7057
Resistance 1 - 7240
Support 2 - 7035
Resistance 2 -
7280
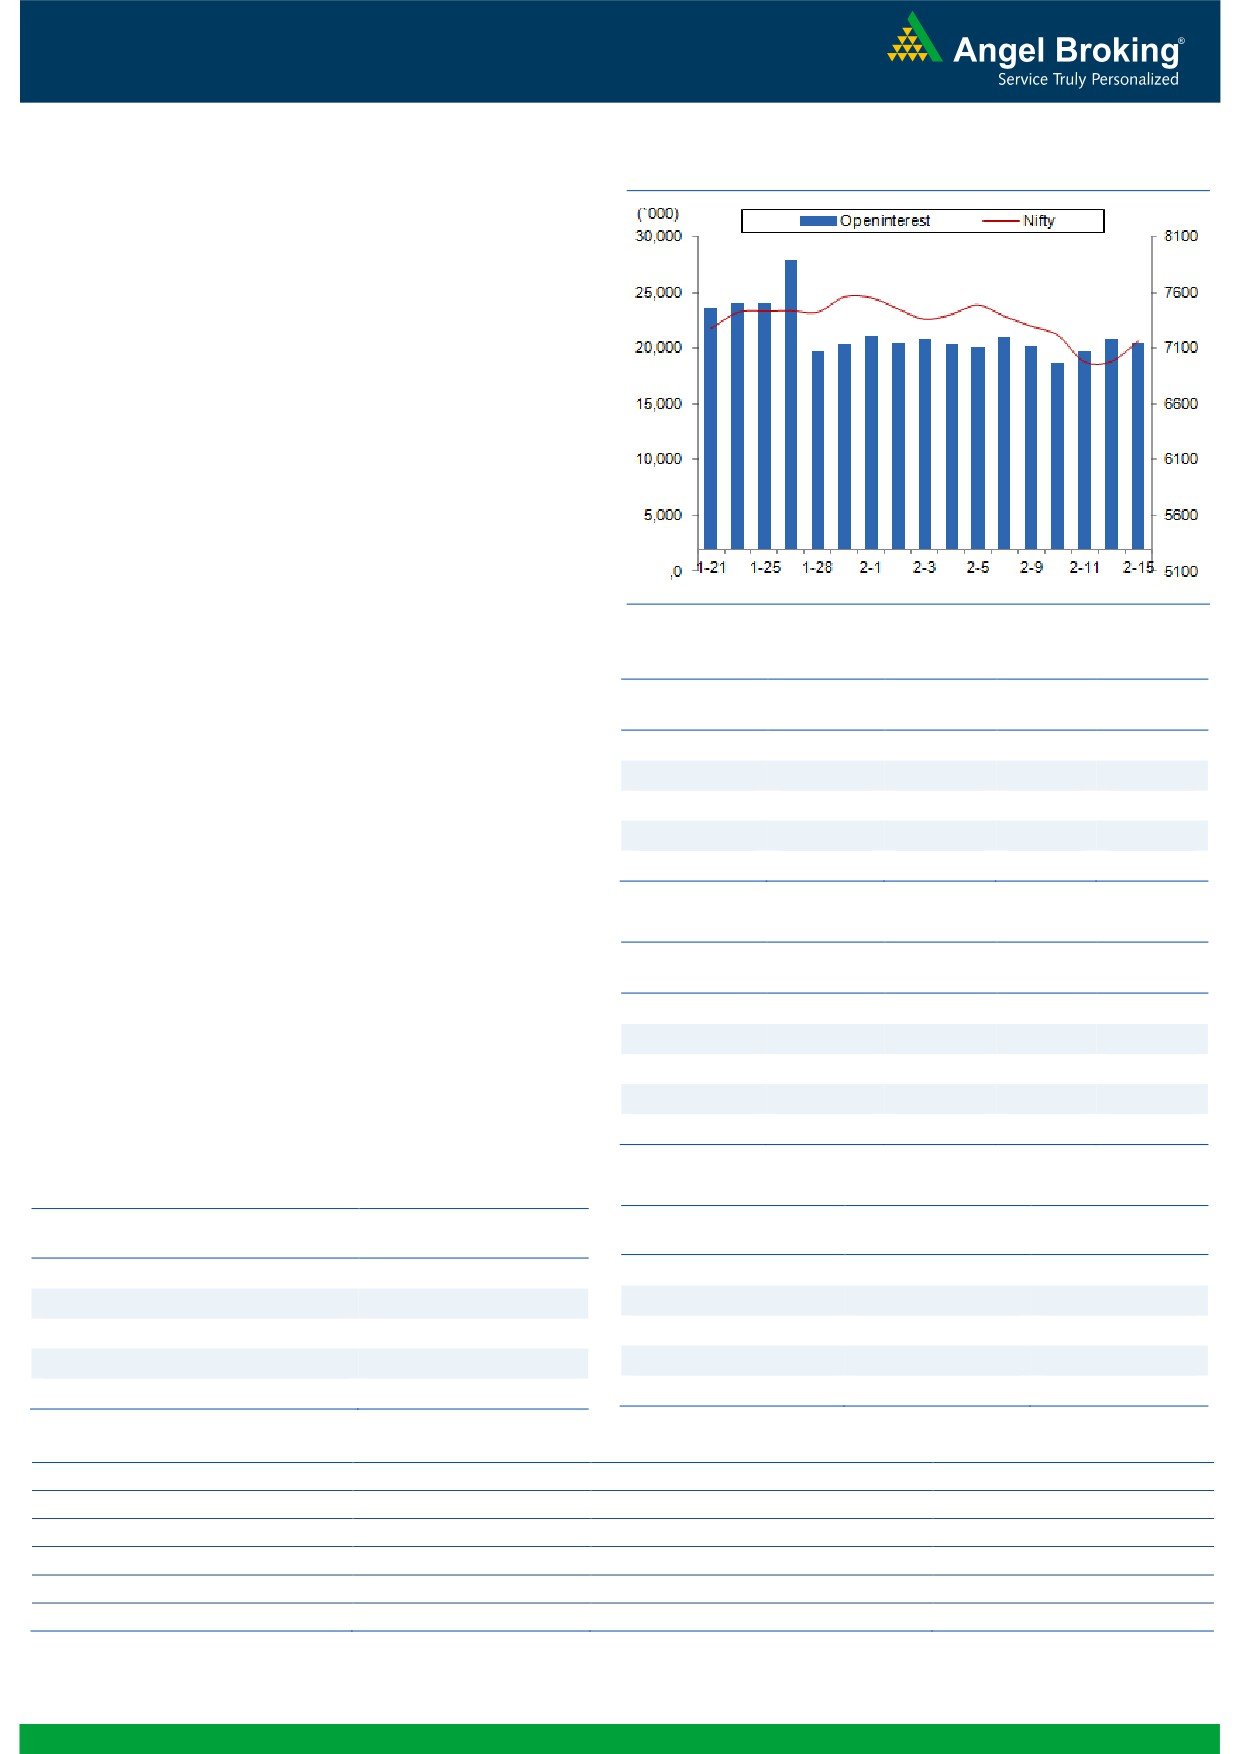
Exhibit 2: Bank Nifty Daily Chart
Bank Nifty Outlook - (14445)
The Nifty Bank index opened higher and started forming
higher tops higher bottom from the opening ticks itself. The
index rallied throughout the session which was led by 'Bank of
Baroda' which surged 22.56% in yesterday's trading session
post its results in the weekend. The positive opening in the
stock and the swift up move in the first hour itself led to
positive momentum in the PSU banking index which ended
yesterday's session with gains of 9.57%.
Going ahead, the Nifty Bank index could test and resist
around the January support range of 14750-14800 which
was broken last week. The support broken could now act as
resistance and thus traders should be observant on the
mentioned resistance. The immediate support for the index is
placed around 14175 and 14120 and any correction upto the
mentioned support could see some buying interest coming for
an up move upto the above mentioned resistance zone.
Key Levels
Support 1 - 14175
Resistance 1 - 14750
Support 2 - 14120
Resistance 2 - 14800
1
Technical & Derivatives Report
February 16, 2016
Comments
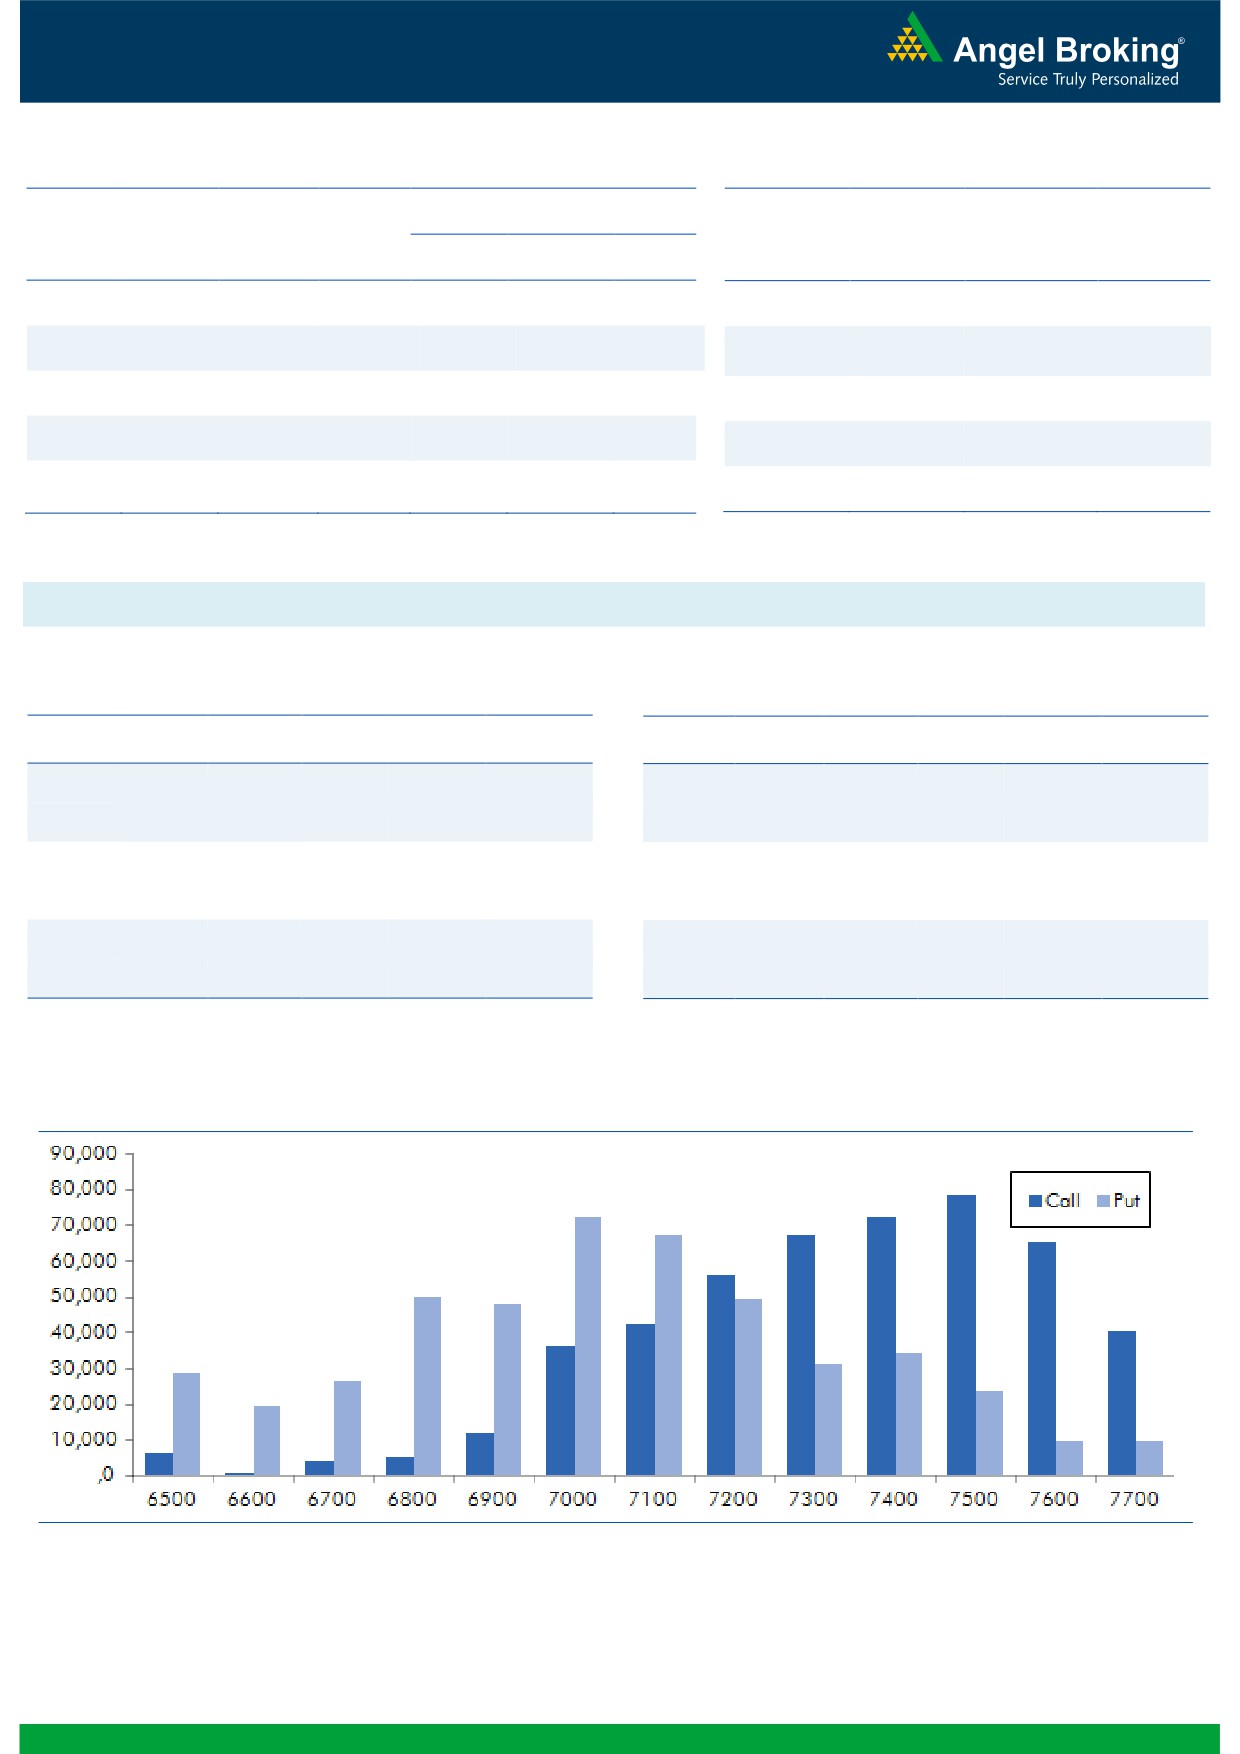
Nifty Vs OI
The Nifty futures open interest has decreased by 1.15%
BankNifty futures open interest has decreased by 11.46%
as market closed at 7162.95 levels.
The Nifty February future closed at a discount of 1.50
points against a premium of 9.05 points. The March
series closed at a premium of 16.20 points.
The Implied Volatility of at the money options has
decreased from 20.97% to 17.60%.
The total OI of the market is Rs. 2,35,101/- cr. and the
stock futures OI is Rs. 56,213/- cr.
Few of the liquid counters where we have seen high cost
of carry are JPASSOCIAT, TATAPOWER, ADANIPOWER,
ADANIENT and DHFL.
Views
FIIs sold significantly in cash market segment to the tune
OI Gainers
of Rs. 1311 crores. While in Index Futures, they continue
OI
PRICE
SCRIP
OI
PRICE
buying of Rs. 915 crores with some rise in open interest
CHG. (%)
CHG. (%)
indicating fresh long formation and short covering in last
TATAPOWER
30760000
31.01
59.55
5.64
trading session.
BANKBARODA
53599000
17.01
139.35
23.28
In Index Options front, they bought of Rs. 442 crores with
WOCKPHARMA
3085500
12.93
758.00
-0.53
decent rise in OI. In call options, we hardly saw any
JINDALSTEL
48531000
11.82
63.15
14.45
strikes adding meaningful OI. Good amount of
TATASTEEL
29650000
10.82
246.70
13.21
unwinding was witness in 7000 call option. While in put
options, 7000 and 7100 strikes added good amount of
OI Losers
OI, followed by unwinding in 7400 strike. Maximum
OI
PRICE
SCRIP
OI
PRICE
build-up is visible in 7500 call and 7000 put options.
CHG. (%)
CHG. (%)
Nifty bounced back more than 2.5% yesterday, FIIs
ACC
3712125
-9.91
1256.55
2.81
continue to form longs in Index Futures. We believe Nifty
DLF
41425000
-9.16
89.65
11.40
may continue to show strength, one should trade with a
NCC
9056000
-8.12
64.35
7.90
positive bias.
AMARAJABAT
622200
-8.07
875.70
6.24
NMDC
12980000
-7.75
89.75
15.21
Historical Volatility
Put-Call Ratio
SCRIP
HV
SCRIP
PCR-OI
PCR-VOL
BANKBARODA
111.19
NIFTY
0.81
0.75
NMDC
85.01
BANKNIFTY
0.68
0.63
UCOBANK
116.10
SBIN
0.57
0.44
IOC
47.45
ICICIBANK
0.48
0.35
LT
54.66
RELIANCE
0.43
0.34
Strategy Date
Symbol
Strategy
Status
February 01, 2016
BHEL
Bull Call Spread
Active
February 08, 2016
NIFTY
Short Strangle
Active
February 15, 2016
AXISBANK
Bull Call Spread
Active
2
Technical & Derivatives Report
February 16, 2016
FII Statistics for 15-February 2016
Turnover on 15-February 2016
Open Interest
No. of
Turnover
Change
Detail
Buy
Sell
Net
Instrument
Value
Change
Contracts
( in Cr. )
(%)
Contracts
(in Cr.)
(%)
INDEX
INDEX
3374.74
2459.48
915.26
258273
13266.09
1.71
351401
17487.84
-25.80
FUTURES
FUTURES
INDEX
INDEX
32195.91
31753.33
442.57
1452986
76804.42
3.64
4059054
214023.97
-25.47
OPTIONS
OPTIONS
STOCK
5874.31
4634.62
1239.69
1179141
50305.18
0.32
STOCK
FUTURES
701053
29164.40
-11.20
FUTURES
STOCK
STOCK
3159.65
3167.14
(7.49)
76099
3219.72
1.70
OPTIONS
445926
18829.56
-15.70
OPTIONS
TOTAL
44604.61
42014.57
2590.04
2966499
143595.40
2.08
TOTAL
5557434
279505.76
-23.61
Nifty Spot = 7162.95
Lot Size = 75
Bull-Call Spreads
Bear-Put Spreads
Action
Strike
Price
Risk
Reward
BEP
Action
Strike
Price
Risk
Reward
BEP
Buy
7200
66.15
Buy
7200
107.80
35.05
64.95
7235.05
43.85
56.15
7156.15
Sell
7300
31.10
Sell
7100
63.95
Buy
7200
66.15
Buy
7200
107.80
53.20
146.80
7253.20
71.80
128.20
7128.20
Sell
7400
12.95
Sell
7000
36.00
Buy
7300
31.10
Buy
7100
63.95
18.15
81.85
7318.15
27.95
72.05
7072.05
Sell
7400
12.95
Sell
7000
36.00
Note: Above mentioned Bullish or Bearish Spreads in Nifty (Feb. Series) are given as an information and not as a recommendation.
Nifty Put-Call Analysis
3
Technical & Derivatives Report
February 16, 2016
Daily Pivot Levels for Nifty 50 Stocks
Scrips
S2
S1
PIVOT
R1
R2
ACC
1,211
1,234
1,251
1,274
1,292
ADANIPORTS
180
185
190
195
200
AMBUJACEM
194
196
198
200
202
ASIANPAINT
842
850
861
870
881
AXISBANK
387
402
411
427
435
BAJAJ-AUTO
2,273
2,307
2,340
2,375
2,407
BANKBARODA
110
125
133
148
157
BHARTIARTL
308
314
322
327
335
BHEL
99
103
106
111
114
BOSCHLTD
15,543
15,995
16,398
16,850
17,252
BPCL
756
768
788
800
820
CAIRN
117
121
124
128
131
CIPLA
523
531
537
545
550
COALINDIA
296
310
320
335
345
DRREDDY
2,772
2,816
2,856
2,900
2,940
GAIL
322
328
332
338
342
GRASIM
3,331
3,402
3,456
3,527
3,581
HCLTECH
801
814
823
836
845
HDFC
1,060
1,070
1,086
1,096
1,112
HDFCBANK
961
967
978
984
995
HEROMOTOCO
2,455
2,481
2,510
2,537
2,566
HINDALCO
60
63
66
70
72
HINDUNILVR
784
794
808
818
832
ICICIBANK
188
196
202
209
215
IDEA
105
107
110
112
115
INDUSINDBK
810
817
824
831
839
INFY
1,079
1,086
1,093
1,099
1,106
ITC
295
299
303
307
310
KOTAKBANK
614
619
628
634
642
LT
1,033
1,091
1,123
1,181
1,213
LUPIN
1,742
1,770
1,804
1,832
1,865
M&M
1,137
1,182
1,206
1,251
1,276
MARUTI
3,560
3,635
3,680
3,756
3,801
NTPC
121
123
125
127
129
ONGC
192
196
199
203
205
PNB
73
75
77
79
81
POWERGRID
137
138
139
140
142
RELIANCE
905
926
939
959
972
SBIN
153
161
165
173
177
VEDL
63
69
72
78
82
SUNPHARMA
832
841
854
863
876
TATAMOTORS
289
303
312
326
335
TATAPOWER
56
58
59
61
62
TATASTEEL
213
230
239
256
265
TCS
2,205
2,237
2,272
2,304
2,339
TECHM
422
426
433
437
444
ULTRACEMCO
2,724
2,763
2,814
2,853
2,904
WIPRO
514
520
524
530
533
YESBANK
723
738
750
765
777
ZEEL
368
376
381
389
393
4
Technical & Derivatives Report
February 16, 2016
Research Team Tel: 022 - 39357800
For Technical Queries
For Derivatives Queries
DISCLAIMER
Angel Broking Private Limited (hereinafter referred to as “Angel”) is a registered Member of National Stock Exchange of India Limited,
Bombay Stock Exchange Limited and MCX Stock Exchange Limited. It is also registered as a Depository Participant with CDSL and
Portfolio Manager with SEBI. It also has registration with AMFI as a Mutual Fund Distributor. Angel Broking Private Limited is a
registered entity with SEBI for Research Analyst in terms of SEBI (Research Analyst) Regulations, 2014 vide registration number
INH000000164. Angel or its associates has not been debarred/ suspended by SEBI or any other regulatory authority for accessing
/dealing in securities Market. Angel or its associates including its relatives/analyst do not hold any financial interest/beneficial
ownership of more than 1% in the company covered by Analyst. Angel or its associates/analyst has not received any compensation /
managed or co-managed public offering of securities of the company covered by Analyst during the past twelve months. Angel/analyst
has not served as an officer, director or employee of company covered by Analyst and has not been engaged in market making activity
of the company covered by Analyst.
This document is solely for the personal information of the recipient, and must not be singularly used as the basis of any investment
decision. Nothing in this document should be construed as investment or financial advice. Each recipient of this document should
make such investigations as they deem necessary to arrive at an independent evaluation of an investment in the securities of the
companies referred to in this document (including the merits and risks involved), and should consult their own advisors to determine
the merits and risks of such an investment.
Reports based on technical and derivative analysis center on studying charts of a stock's price movement, outstanding positions and
trading volume, as opposed to focusing on a company's fundamentals and, as such, may not match with a report on a company's
fundamentals.
The information in this document has been printed on the basis of publicly available information, internal data and other reliable
sources believed to be true, but we do not represent that it is accurate or complete and it should not be relied on as such, as this
document is for general guidance only. Angel Broking Pvt. Limited or any of its affiliates/ group companies shall not be in any way
responsible for any loss or damage that may arise to any person from any inadvertent error in the information contained in this report.
Angel Broking Pvt. Limited has not independently verified all the information contained within this document. Accordingly, we cannot
testify, nor make any representation or warranty, express or implied, to the accuracy, contents or data contained within this document.
While Angel Broking Pvt. Limited endeavors to update on a reasonable basis the information discussed in this material, there may be
regulatory, compliance, or other reasons that prevent us from doing so.
This document is being supplied to you solely for your information, and its contents, information or data may not be reproduced,
redistributed or passed on, directly or indirectly.
Neither Angel Broking Pvt. Limited, nor its directors, employees or affiliates shall be liable for any loss or damage that may arise from
or in connection with the use of this information.
Note: Please refer to the important ‘Stock Holding Disclosure' report on the Angel website (Research Section). Also, please refer to the
latest update on respective stocks for the disclosure status in respect of those stocks. Angel Broking Pvt. Limited and its affiliates may
have investment positions in the stocks recommended in this report.
5