Technical & Derivatives Report
December 15, 2016
Sensex (26603) / Nifty (8182)
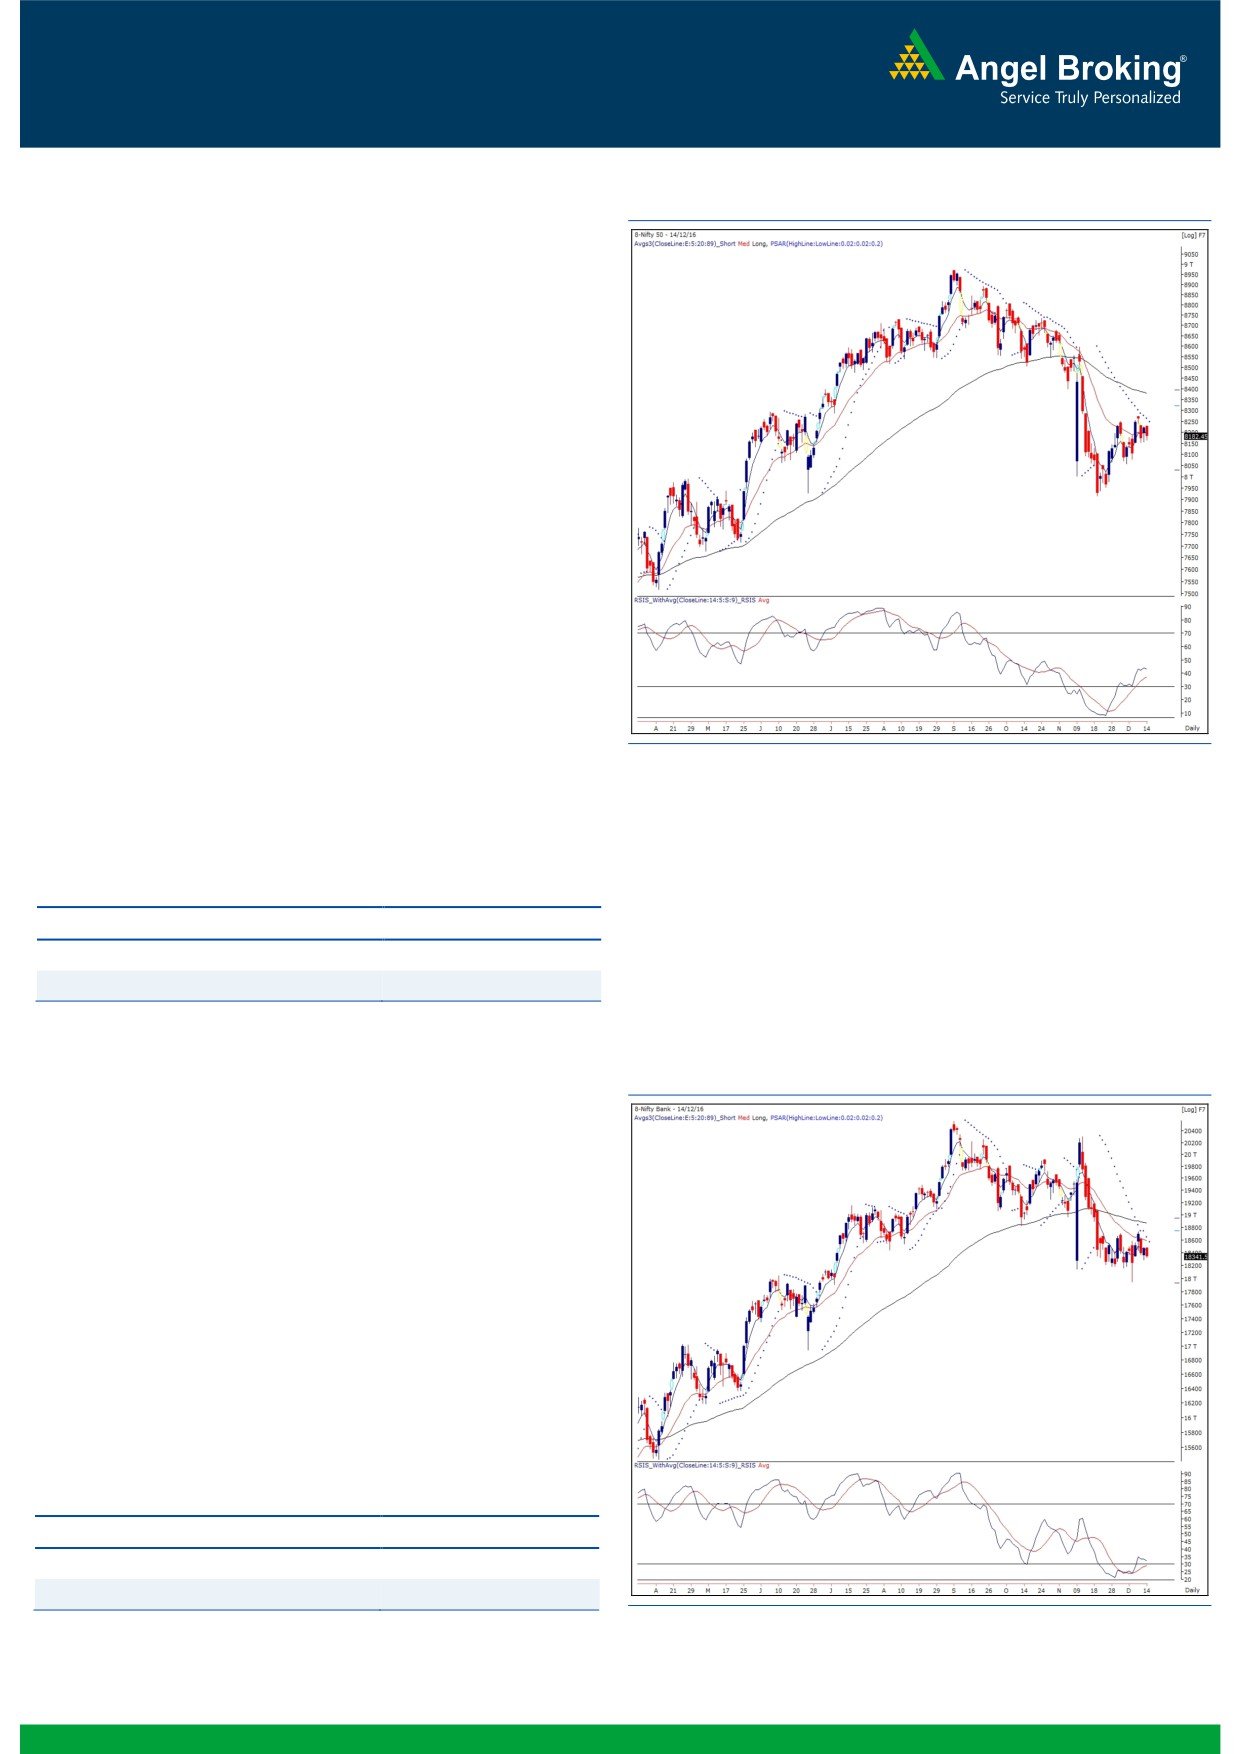
Exhibit 1: Nifty Daily Chart
Yesterday, the benchmark index opened on a flat note as
indicated by the SGX Nifty. Subsequently, we witnessed a
complete tug-of-war between market participants throughout the
session. However, due to tail end weakness, the Nifty eventually
closed with nearly half a percent cut.
It was day of consolidation within a narrow range of merely 60
points in Nifty. Such choppy and directionless session was quite
evident ahead of the Fed policy. We have observed that traders
generally choose to stay on the sidelines and await the outcome
to form a directional view. Going forward, we would first observe
market’s reaction to this event in the initial trade. However,
keeping this event aside, we are still optimistic on the market as
the ‘Higher Top Higher Bottom’ formation on daily chart is still
intact. For the coming session, first key support is seen at 8154. In
case of breaking this level, we would see some weakness in the
market, which would drag the index towards 8100 - 8056 levels.
However, in case of a positive reaction, the Nifty is likely to move
towards our 8229 - 8275 levels. With a positional view, our
targets of 8320 - 8380 are still intact. Due to the global event,
we may see higher volatility in the market and thus, traders are
advised to keep a note of all the above mentioned points.
Key Levels
Support 1 - 8154
Resistance 1 - 8229
Support 2 - 8100
Resistance 2 - 8275
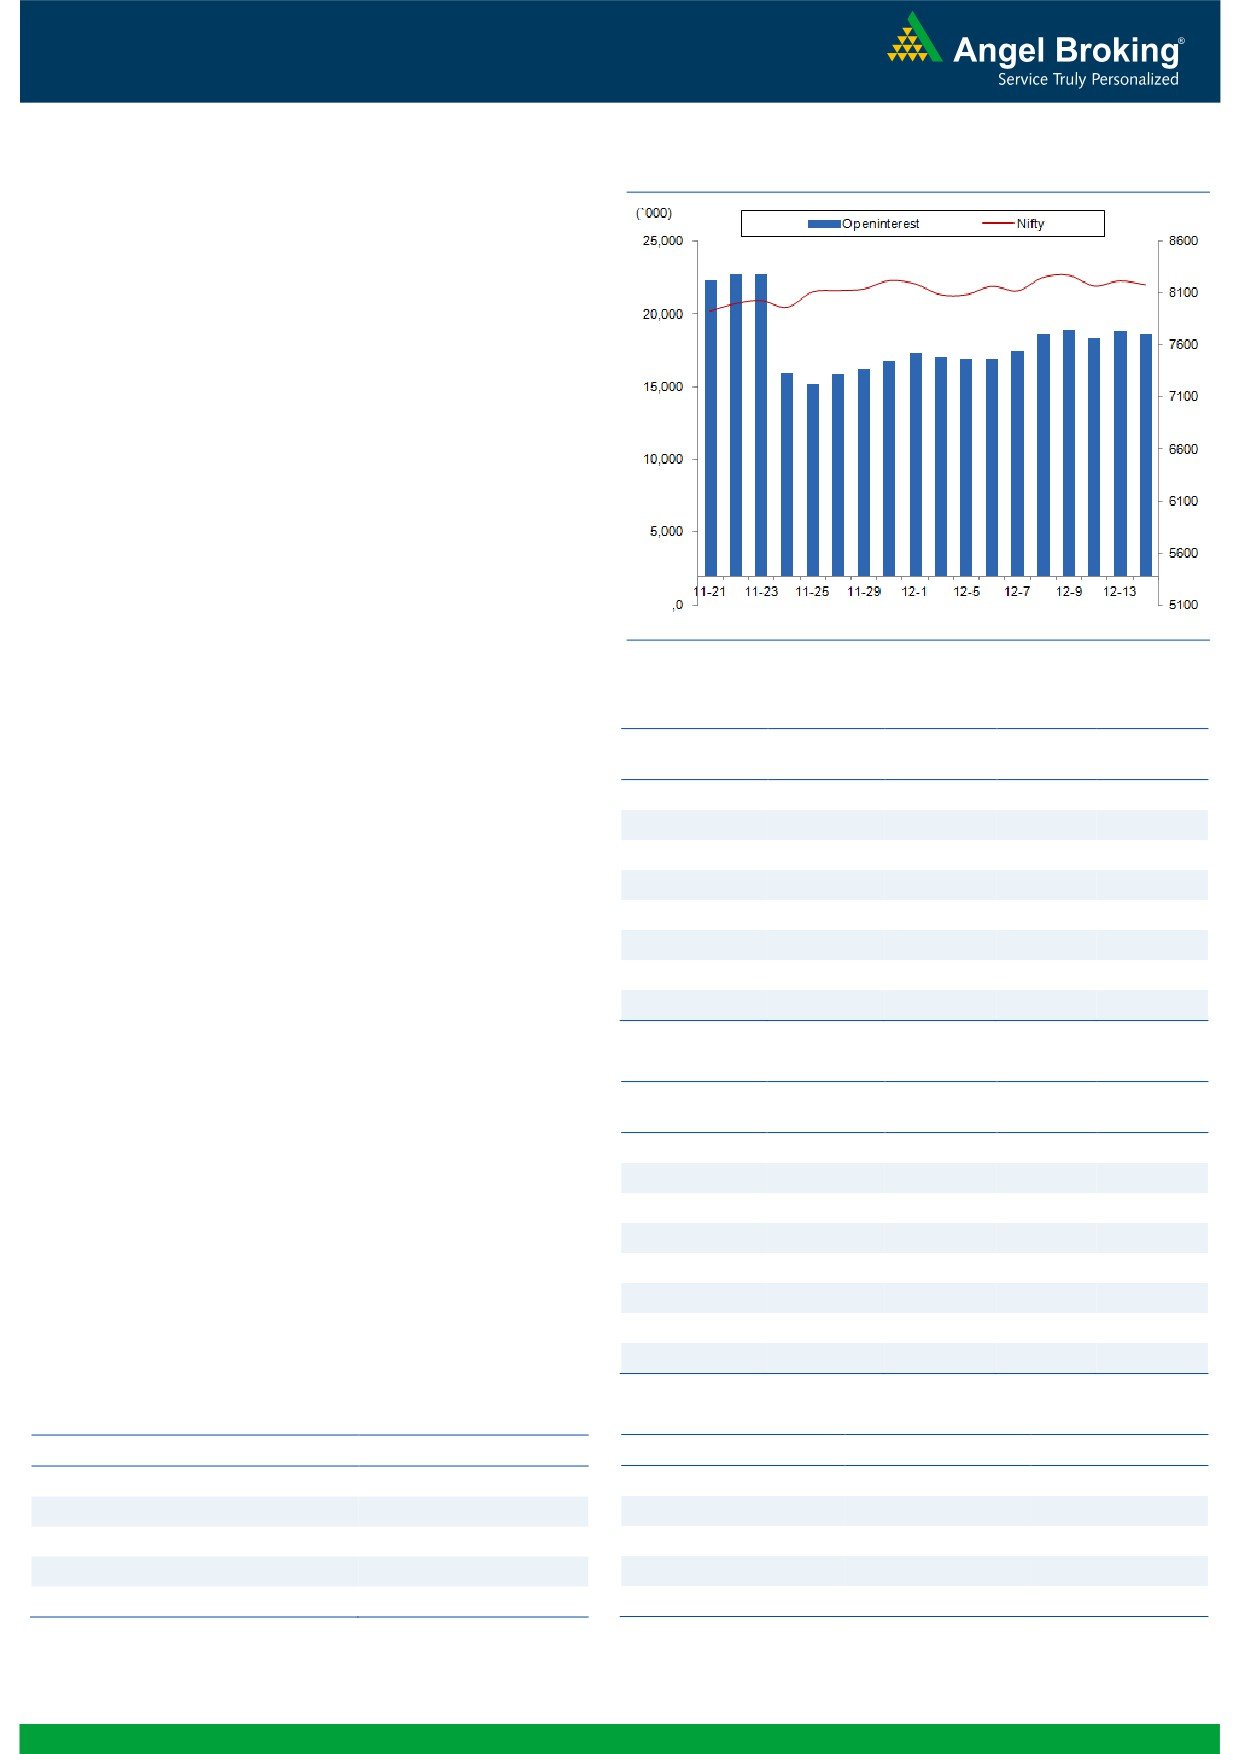
Nifty Bank Outlook - (18342)
Exhibit 2: Nifty Bank Daily Chart
The Nifty Bank index ended another session in a narrow range
yesterday and posted loss of 0.67 percent over its previous
session's close.
The Nifty Bank index continued its range bound move yesterday
and thus there is no sign of trended move yet. Although the
outcome of the FOMC could lead to higher volatility in line with
other global markets, it would be prudent to keep wait and watch
approach and let the index show definite signs of trended move.
Hence, we continue to advise traders to focus on stock specific
moves and trade with proper risk management. The intraday
supports for the Nifty Bank index are placed around 18250 and
18120 whereas resistances are seen around 18490 and 18725.
Key Levels
Support 1 - 18250
Resistance 1 - 18490
Support 2 - 18120
Resistance 2 - 18725
1
Technical & Derivatives Report
December 15, 2016
Comments
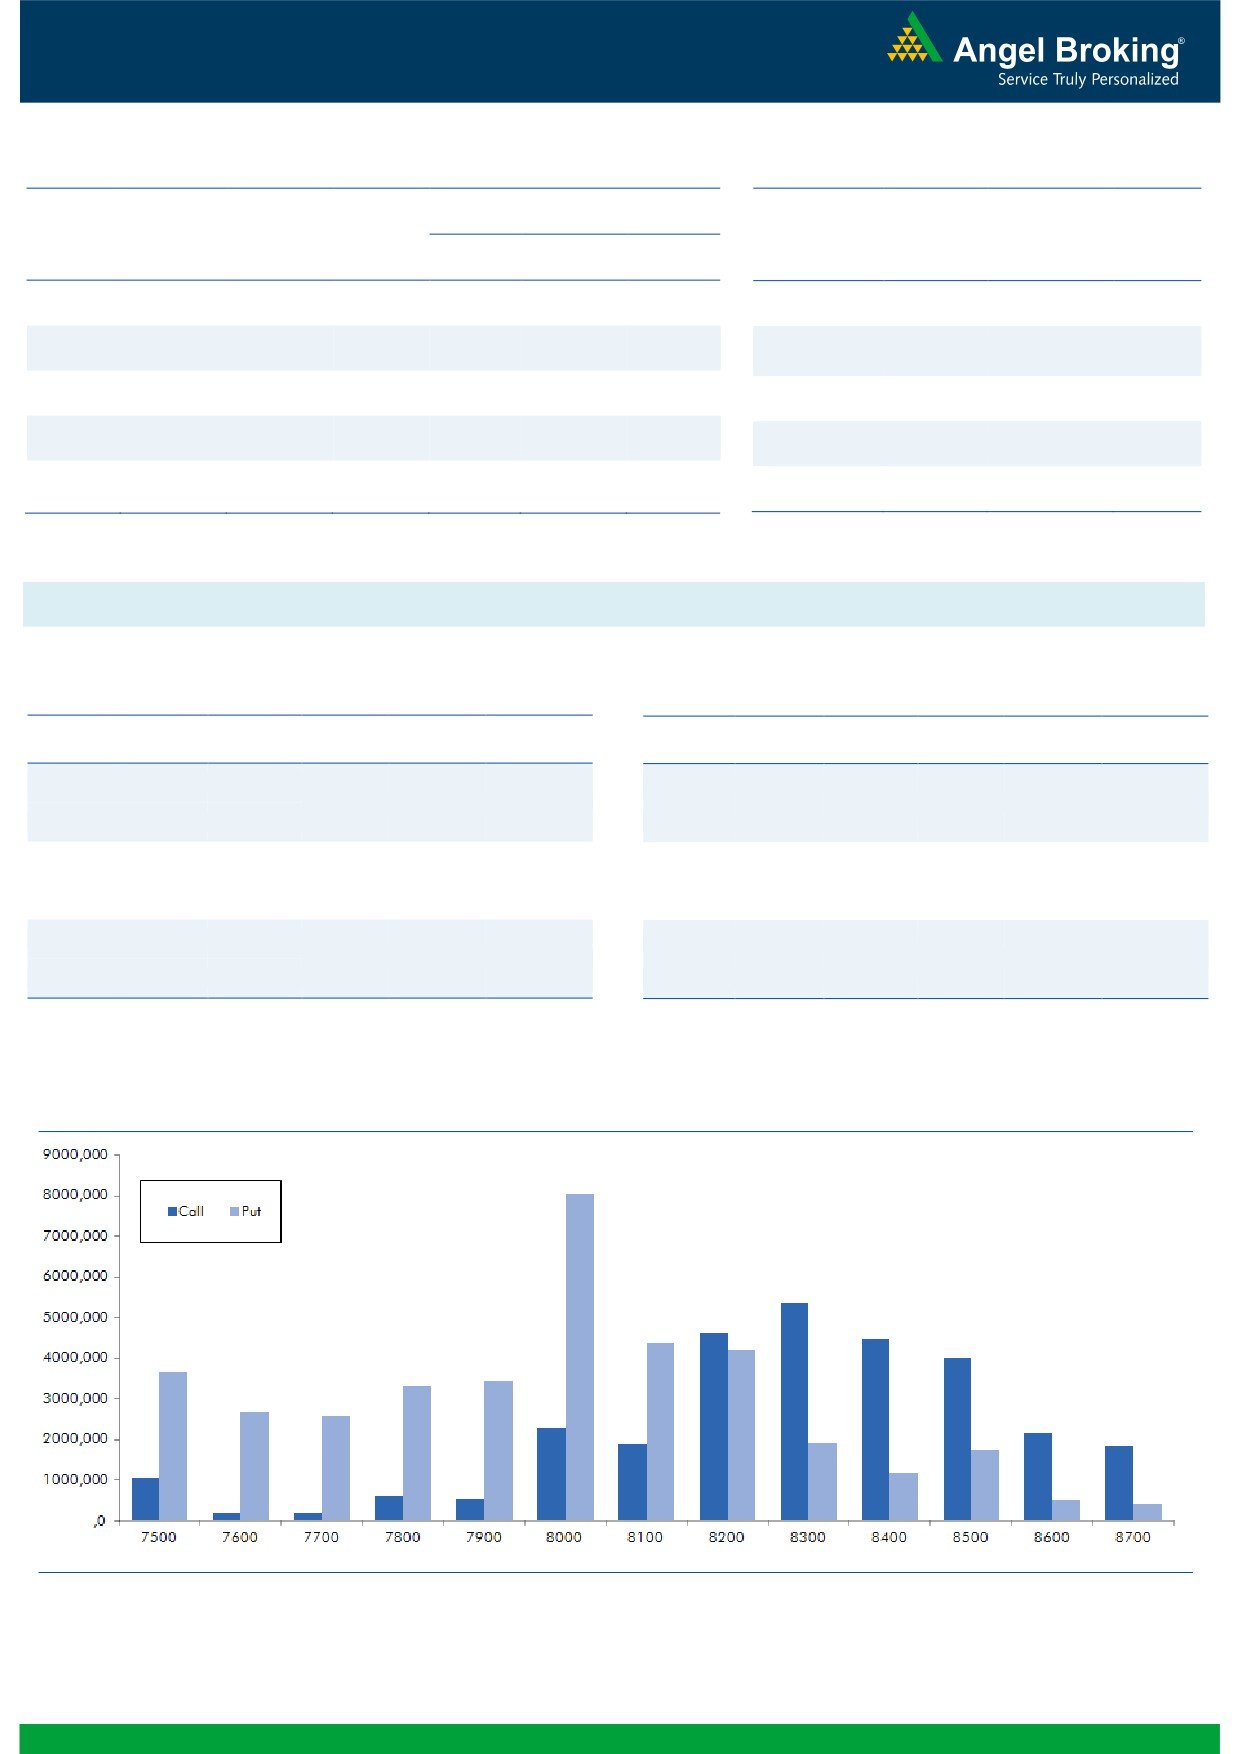
Nifty Vs OI
The Nifty futures open interest has decreased by 1.36%
BankNifty futures open interest has increased by 1.86%
as market closed at 8182.45 levels.
The Nifty December future closed with a premium of
15.20 against the premium of 5.65 points in last trading
session. The January series closed at a premium of
49.15 points.
The Implied Volatility of at the money options has
increased from 14.08% to 15.26%. At the same time, the
PCR-OI of Nifty has decreased from 1.09 to 1.08 levels.
The total OI of the market is Rs. 2,55,612/- cr. and the
stock futures OI is Rs. 68,927/- cr.
Few of the liquid counters where we have seen high cost
of carry are ADANIPOWER, SOUTHBANK, PTC,
HINDPETRO and FEDERALBNK.
OI Gainers
Views
OI
PRICE
SCRIP
OI
PRICE
CHG. (%)
CHG. (%)
Yesterday, FIIs were net seller in both cash market and
ONGC
28070000
25.19
305.55
-1.99
index futures segment. They sold equities worth Rs. 632
IBULHSGFIN
13163200
19.25
649.05
-3.31
crores. While in index futures, the overall activity from
KSCL
2667000
18.38
393.20
-8.63
FIIs desk was subdued.
www.angelbroking.com
ORIENTBANK
14292000
14.19
115.70
-3.34
In Index options segment, FIIs were net seller worth
GODREJIND
1617000
13.00
413.55
0.46
Rs. 2005 crores with marginal change in open interest.
UPL
5481600
7.89
653.60
-3.98
In call options, 8200-8300 strikes added some fresh
ARVIND
6376000
7.88
336.90
-2.91
positions. While, in put options, we witnessed build-up in
SOUTHBANK
40710000
7.87
21.35
-2.73
8100 and 7800 strikes. Highest OI in current series is
placed at 8300 call and 8000 put option.
Yesterday, FIIs have shorted both call and puts ahead of
OI Losers
the outcome of Fed meet. However, their long positions
OI
PRICE
SCRIP
OI
PRICE
CHG. (%)
CHG. (%)
in index futures formed in last week are still intact. Since,
AXISBANK
30700800
-9.18
467.10
3.07
strong support for the index is placed at 8100-8150,
ENGINERSIN
5894000
-8.43
306.45
-2.12
intraday dips should be used as buying opportunity.
MINDTREE
2726400
-7.39
502.25
1.52
Thus, traders are advised to trade with positive bias.
KTKBANK
16564250
-6.53
110.50
-1.95
TATAELXSI
1196500
-5.90
1458.65
-2.07
NTPC
14624000
-5.63
164.00
-0.43
OIL
1264800
-5.46
446.35
0.54
APOLLOTYRE
7857000
-5.42
197.75
0.43
Historical Volatility
Put-Call Ratio
SCRIP
HV
SCRIP
PCR-OI
PCR-VOL
KSCL
55.29
NIFTY
1.08
1.06
COALINDIA
33.37
BANKNIFTY
1.03
0.94
BEL
38.53
SBIN
0.62
0.58
HCLTECH
28.22
SUNPHARMA
0.51
0.52
UPL
47.11
INFY
0.65
0.60
2
Technical & Derivatives Report
December 15, 2016
FII Statistics for December 14, 2016
Turnover on December 14, 2016
Open Interest
No. of
Turnover
Change
Detail
Buy
Sell
Net
Instrument
Value
Change
Contracts
( in Cr. )
(%)
Contracts
(in Cr.)
(%)
INDEX
INDEX
1172.42
1252.19
(79.77)
214088
13546.23
0.33
169112
11127.12
1.58
FUTURES
FUTURES
INDEX
INDEX
25893.28
27898.35
(2005.07)
1064049
66356.09
0.77
2761016
186890.72
21.16
OPTIONS
OPTIONS
STOCK
5746.97
5634.80
112.17
896761
54697.98
1.28
STOCK
FUTURES
408543
26350.39
1.06
FUTURES
STOCK
STOCK
2585.75
2644.71
(58.96)
82161
5317.97
2.20
OPTIONS
251879
16509.85
2.75
OPTIONS
TOTAL
35398.42
37430.05
(2031.63)
2257059
139918.26
0.98
TOTAL
3590550
240878.08
16.17
Nifty Spot = 8182.45
Lot Size = 75
Bull-Call Spreads
Bear-Put Spreads
Action
Strike
Price
Risk
Reward
BEP
Action
Strike
Price
Risk
Reward
BEP
Buy
8200
97.65
Buy
8200
103.55
46.10
53.90
8246.10
34.85
65.15
8165.15
Sell
8300
51.55
Sell
8100
68.70
Buy
8200
97.65
Buy
8200
103.55
74.70
125.30
8274.70
57.30
142.70
8142.70
Sell
8400
22.95
Sell
8000
46.25
Buy
8300
51.55
Buy
8100
68.70
28.60
71.40
8328.60
22.45
77.55
8077.55
Sell
8400
22.95
Sell
8000
46.25
Note: Above mentioned Bullish or Bearish Spreads in Nifty (December Series) are given as an information and not as a recommendation.
Nifty Put-Call Analysis
3
Technical & Derivatives Report
December 15, 2016
Daily Pivot Levels for Nifty Constituents
Scrips
S2
S1
PIVOT
R1
R2
ACC
1,289
1,301
1,322
1,334
1,355
ADANIPORTS
279
281
285
287
291
AMBUJACEM
203
204
206
207
208
ASIANPAINT
900
907
915
922
930
AUROPHARMA
681
692
707
718
733
AXISBANK
448
458
464
473
479
BAJAJ-AUTO
2,612
2,630
2,650
2,668
2,688
BANKBARODA
156
157
159
160
162
BHEL
124
124
126
126
127
BPCL
609
615
624
630
639
BHARTIARTL
316
319
325
328
333
INFRATEL
351
354
358
361
365
BOSCH
19,823
20,094
20,572
20,844
21,321
CIPLA
555
562
571
577
586
COALINDIA
286
289
294
297
302
DRREDDY
3,124
3,136
3,152
3,163
3,179
EICHERMOT
21,159
21,480
22,032
22,353
22,905
GAIL
414
416
421
424
428
GRASIM
837
844
853
860
869
HCLTECH
786
803
814
831
842
HDFCBANK
1,164
1,170
1,179
1,185
1,194
HDFC
1,246
1,256
1,268
1,278
1,290
HEROMOTOCO
3,085
3,122
3,174
3,211
3,262
HINDALCO
173
175
176
178
180
HINDUNILVR
810
816
824
830
839
ICICIBANK
257
259
262
264
266
IDEA
75
76
77
78
79
INDUSINDBK
1,056
1,064
1,076
1,084
1,097
INFY
975
988
996
1,008
1,017
ITC
229
231
234
236
238
KOTAKBANK
720
724
728
732
736
LT
1,342
1,351
1,366
1,376
1,391
LUPIN
1,469
1,478
1,491
1,500
1,513
M&M
1,147
1,161
1,172
1,186
1,197
MARUTI
5,077
5,109
5,162
5,194
5,247
NTPC
161
162
164
166
168
ONGC
300
302
307
310
314
POWERGRID
179
180
183
184
187
RELIANCE
1,028
1,044
1,054
1,070
1,080
SBIN
260
261
264
265
268
SUNPHARMA
664
671
682
689
700
TCS
2,171
2,190
2,207
2,225
2,243
TATAMTRDVR
294
299
303
308
311
TATAMOTORS
456
464
471
479
485
TATAPOWER
77
78
78
79
80
TATASTEEL
411
414
420
424
430
TECHM
465
471
479
485
493
ULTRACEMCO
3,254
3,284
3,333
3,363
3,411
WIPRO
461
464
466
469
471
YESBANK
1,183
1,190
1,200
1,207
1,217
ZEEL
433
438
442
447
451
4
Technical & Derivatives Report
December 15, 2016
Research Team Tel: 022 - 39357800
For Technical Queries
For Derivatives Queries
DISCLAIMER
Angel Broking Private Limited (hereinafter referred to as “Angel”) is a registered Member of National Stock Exchange of India Limited,
Bombay Stock Exchange Limited and Metropolitan Stock Exchange Limited. It is also registered as a Depository Participant with CDSL
and Portfolio Manager with SEBI. It also has registration with AMFI as a Mutual Fund Distributor. Angel Broking Private Limited is a
registered entity with SEBI for Research Analyst in terms of SEBI (Research Analyst) Regulations, 2014 vide registration number
INH000000164. Angel or its associates has not been debarred/ suspended by SEBI or any other regulatory authority for accessing
/dealing in securities Market. Angel or its associates/analyst has not received any compensation / managed or co-managed public
offering of securities of the company covered by Analyst during the past twelve months.
This document is solely for the personal information of the recipient, and must not be singularly used as the basis of any investment
decision. Nothing in this document should be construed as investment or financial advice. Each recipient of this document should
make such investigations as they deem necessary to arrive at an independent evaluation of an investment in the securities of the
companies referred to in this document (including the merits and risks involved), and should consult their own advisors to determine
the merits and risks of such an investment.
Reports based on technical and derivative analysis center on studying charts of a stock's price movement, outstanding positions and
trading volume, as opposed to focusing on a company's fundamentals and, as such, may not match with a report on a company's
fundamentals. Investors are advised to refer the Fundamental and Technical Research Reports available on our website to evaluate the
contrary view, if any.
The information in this document has been printed on the basis of publicly available information, internal data and other reliable
sources believed to be true, but we do not represent that it is accurate or complete and it should not be relied on as such, as this
document is for general guidance only. Angel Broking Pvt. Limited or any of its affiliates/ group companies shall not be in any way
responsible for any loss or damage that may arise to any person from any inadvertent error in the information contained in this report.
Angel Broking Pvt. Limited has not independently verified all the information contained within this document. Accordingly, we cannot
testify, nor make any representation or warranty, express or implied, to the accuracy, contents or data contained within this document.
While Angel Broking Pvt. Limited endeavors to update on a reasonable basis the information discussed in this material, there may be
regulatory, compliance, or other reasons that prevent us from doing so.
This document is being supplied to you solely for your information, and its contents, information or data may not be reproduced,
redistributed or passed on, directly or indirectly.
Neither Angel Broking Pvt. Limited, nor its directors, employees or affiliates shall be liable for any loss or damage that may arise from
or in connection with the use of this information.
5