Technical & Derivatives Report
November 15, 2016
Sensex (26819) / Nifty (8296)
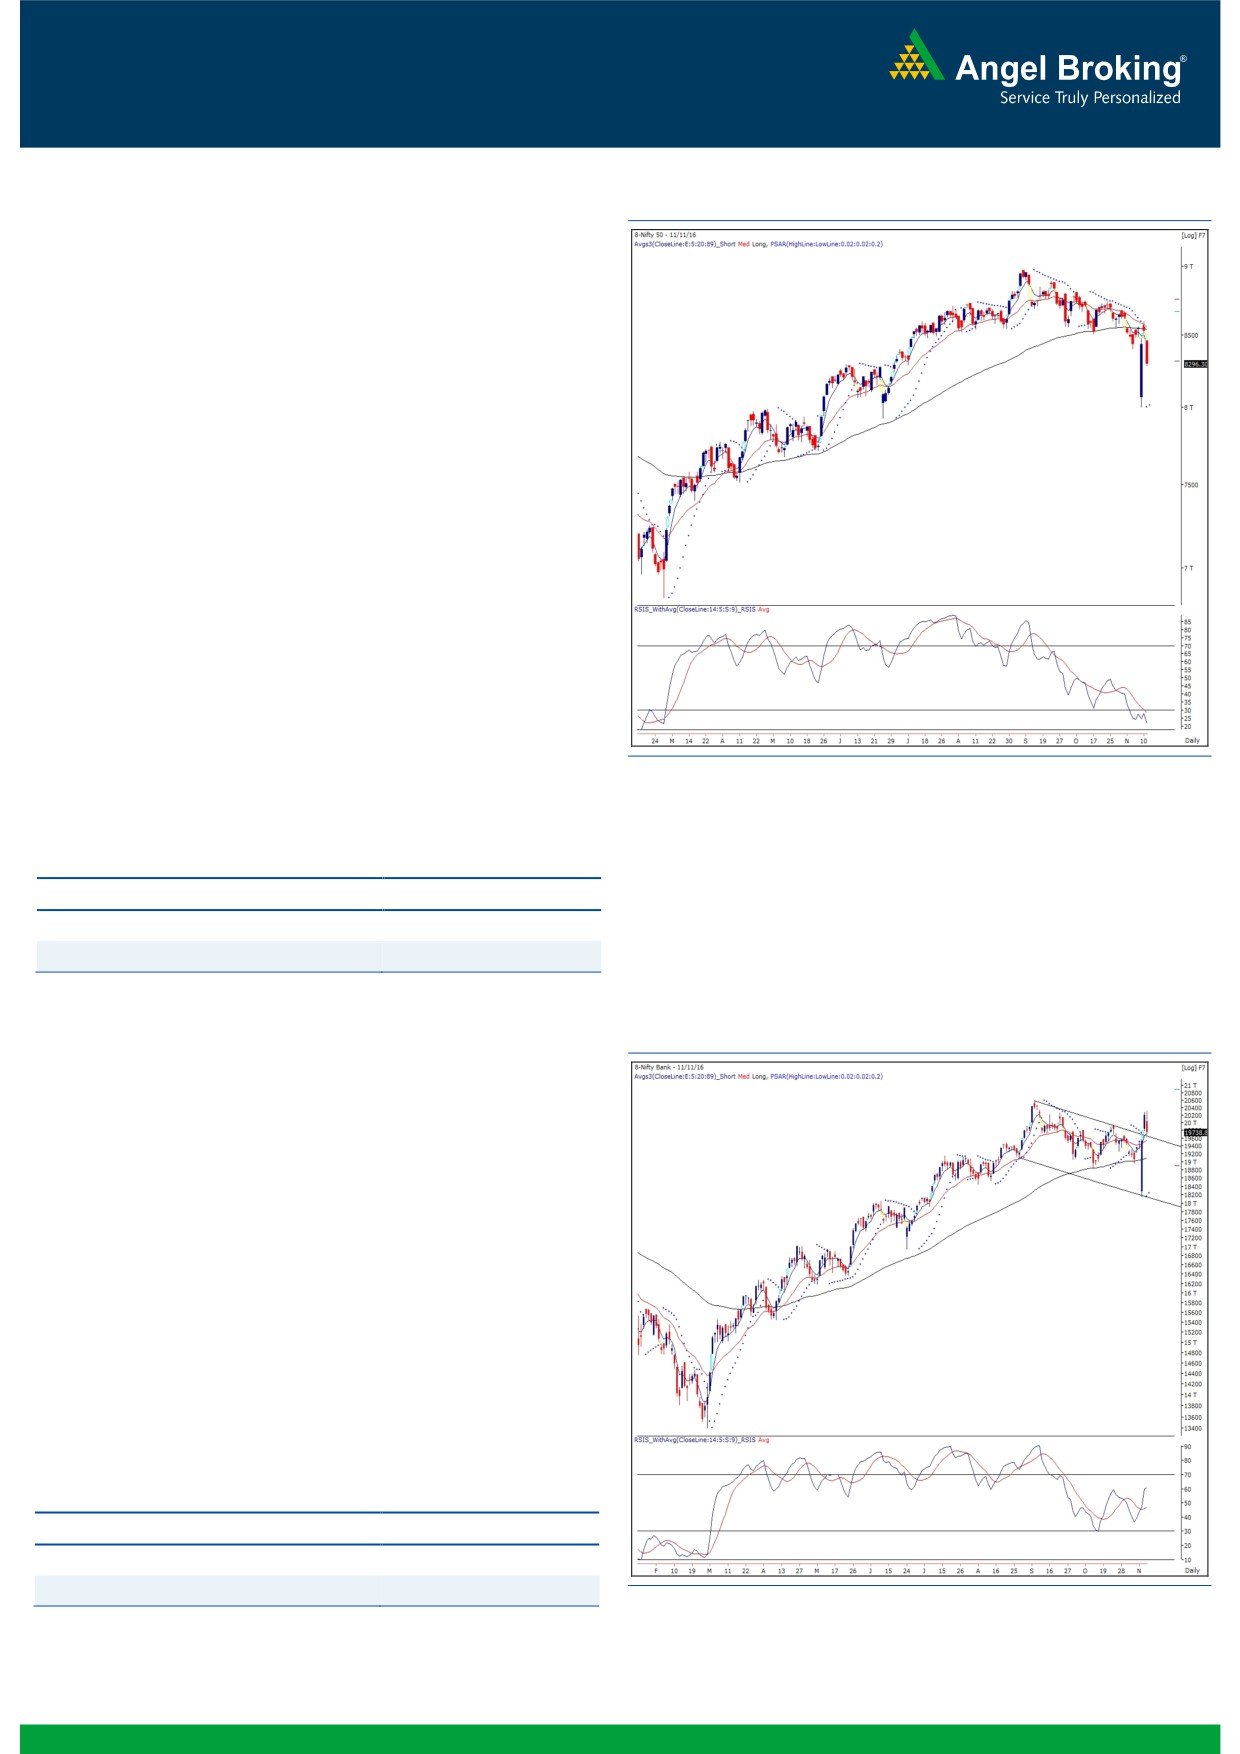
Exhibit 1: Nifty Daily Chart
The Nifty opened with the downside gap on Friday and continued
to move throughout the session to post a close with loss of 2.69
percent over its previous close.
The previous week has been full of events on domestic as well as
global front. Considering this price development, we are of the
opinion that the price-correction for a time being is done and the
market is now required to undergo some time-correction before
confirming the next direction. This time the range could be much
wider as 8460 - 8600 would seen as major hurdles and on the
downside, 8230 - 8130 would be considered as immediate
support levels. Going ahead, it would be a nightmare for traders
to trade within this broad range. Thus, one needs to be very
selective and it’s advisable to keep strict stop losses for existing
positions as individual stocks may continue to witness a strong
selling pressure. Technically speaking, the falling ‘RSI-
Smoothened’ oscillator which had indicated immediate correction
in the market is still not so encouraging. Thus, we believe traders
shouldn’t be participating aggressively on the long side, until we
get any reversal sign or an important resistance of 8600 remains
unbroken.
Key Levels
Support 1 - 8230
Resistance 1 - 8380
Support 2 - 8130
Resistance 2 - 8460
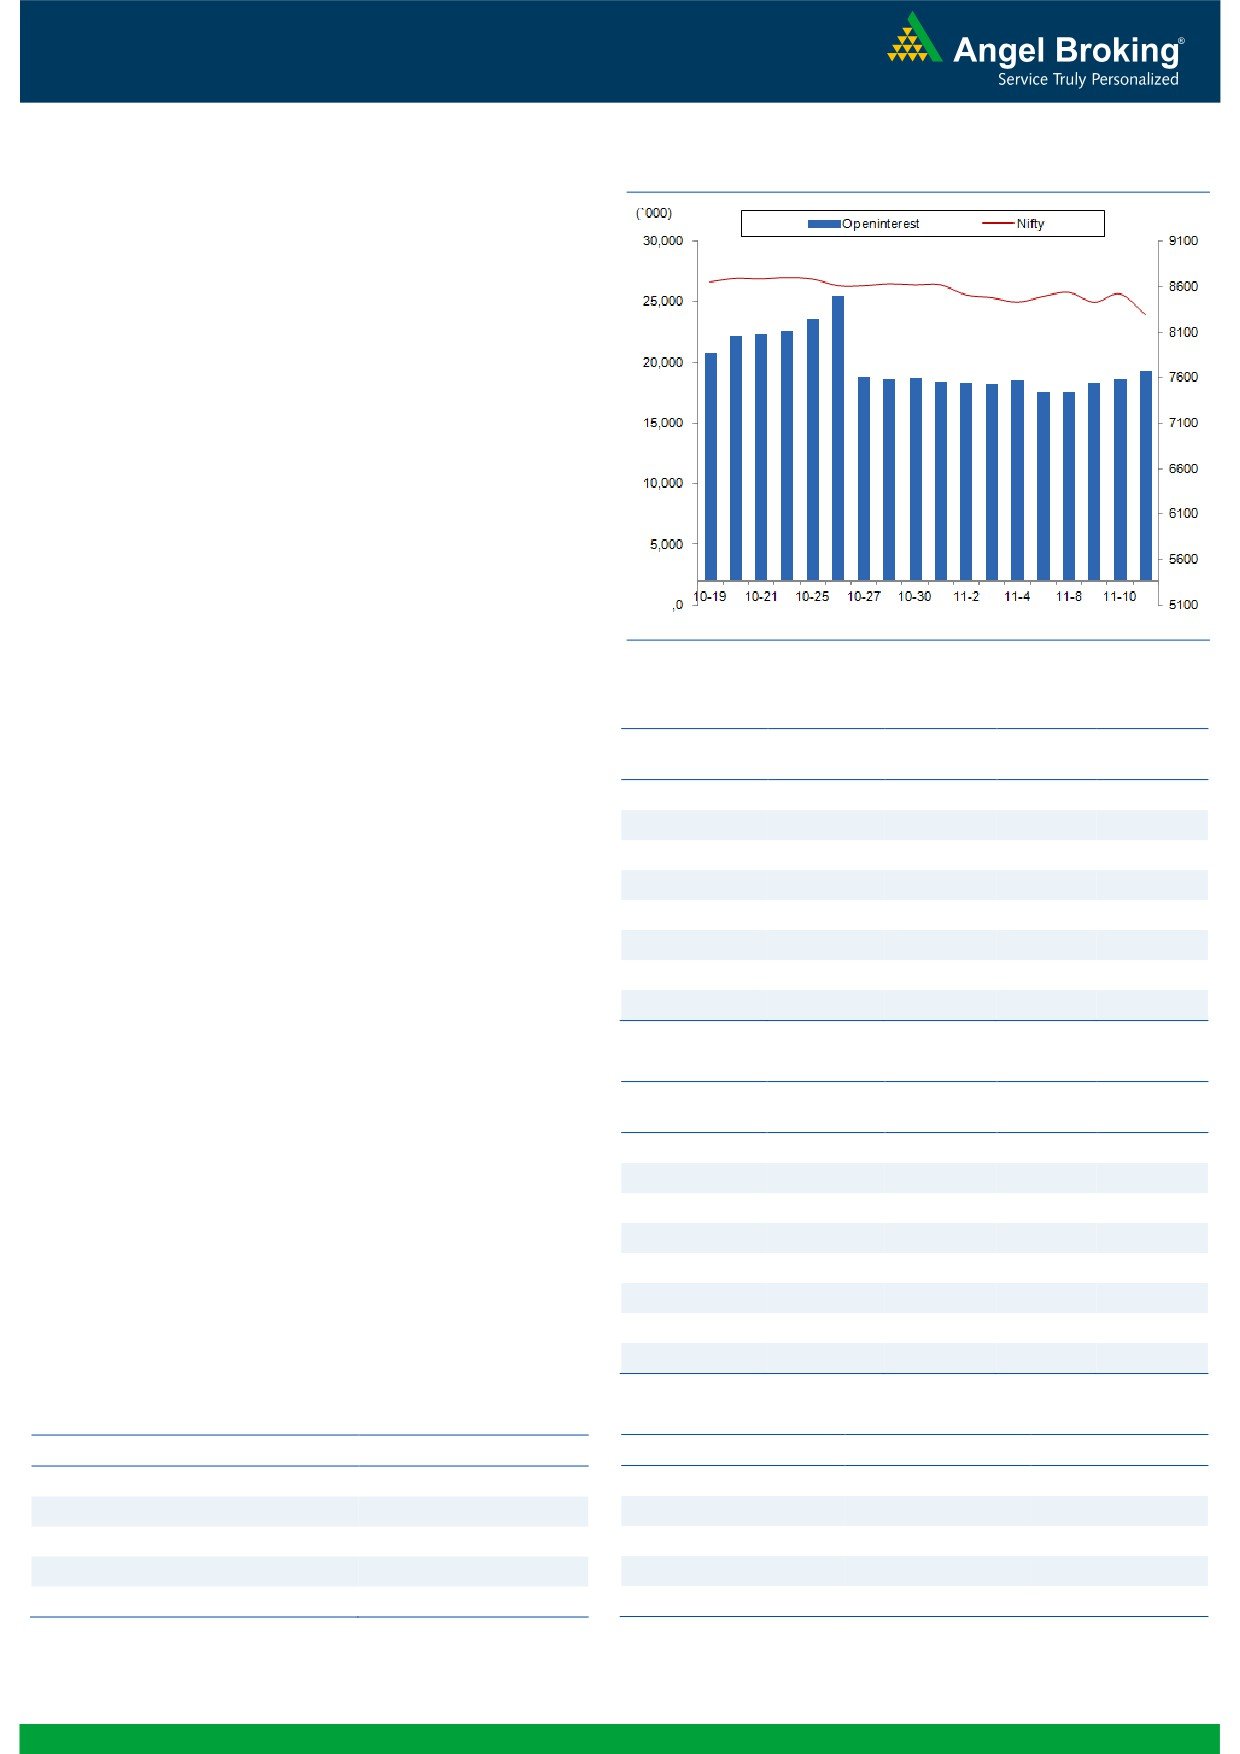
Exhibit 2: Nifty Bank Daily Chart
Nifty Bank Outlook - (19739)
The Nifty Bank index opened lower on Friday and corrected along
with the broader market. Though the Nifty index lost 1.63 %
during last week, the Nifty Bank index showed sheer
outperformance by gaining 3.57% during the week.
As we had highlighted in our Friday's report, the volatility in the
indices is expected to remain higher in near term. However, the
Nifty Bank index has given a breakout above the rising trendline
resistance during the week and thus, the broader outlook for the
index is now positive. It is although, difficult for intraday traders to
trade with the ongoing volatility, positional traders should use
dips as buying opportunities. The intraday supports for the Nifty
Bank index are placed around 19587 and 19480 whereas
resistances are seen around 19930 and 20200.
Key Levels
Support 1 - 19587
Resistance 1 - 19930
Support 2 - 19480
Resistance 2 - 20200
1
Technical & Derivatives Report
November 15, 2016
Comments
Nifty Vs OI
The Nifty futures open interest has increased by 3.57%
BankNifty futures open interest has increased by 0.80%
as market closed at 8296.30 levels.
The Nifty November future closed with a premium of
31.65 against the premium of 27.60 points in last
trading session. The December series closed at a
premium of 84.85 points.
The Implied Volatility of at the money options has
increased from 14.21% to 19.01%. At the same time, the
PCR-OI of Nifty has decreased from at 0.98 to 0.84
levels.
The total OI of the market is Rs. 2,73,545/- cr. and the
stock futures OI is Rs. 73,616/- cr.
Few of the liquid counters where we have seen high cost
of carry are BHEL, M&MFIN, BANKBARODA,
TORNTPOWER and FEDERALBNK.
Views
OI Gainers
On Friday, FIIs were net sellers in both in cash market
OI
PRICE
SCRIP
OI
PRICE
CHG. (%)
CHG. (%)
segment and in Index Futures. They sold equities of Rs.
ICIL
4230000
403.57
148.80
-7.00
1493 crores. While, in index futures, they were net sellers
ICICIBANK
56755000
13.65
277.65
-5.50
to the tune of Rs. 1020 crores with good amount of fall
CROMPGREAV
9456000
13.06
78.80
-4.14
in open interest, indicating long unwinding.aingFriday’sng.com
TVSMOTOR
6010000
12.04
359.80
-5.37
trading session.
PIDILITIND
2282000
11.97
662.20
-0.94
On Index Options front, FIIs sold significantly of worth Rs.
AMARAJABAT
648000
10.54
964.30
-4.73
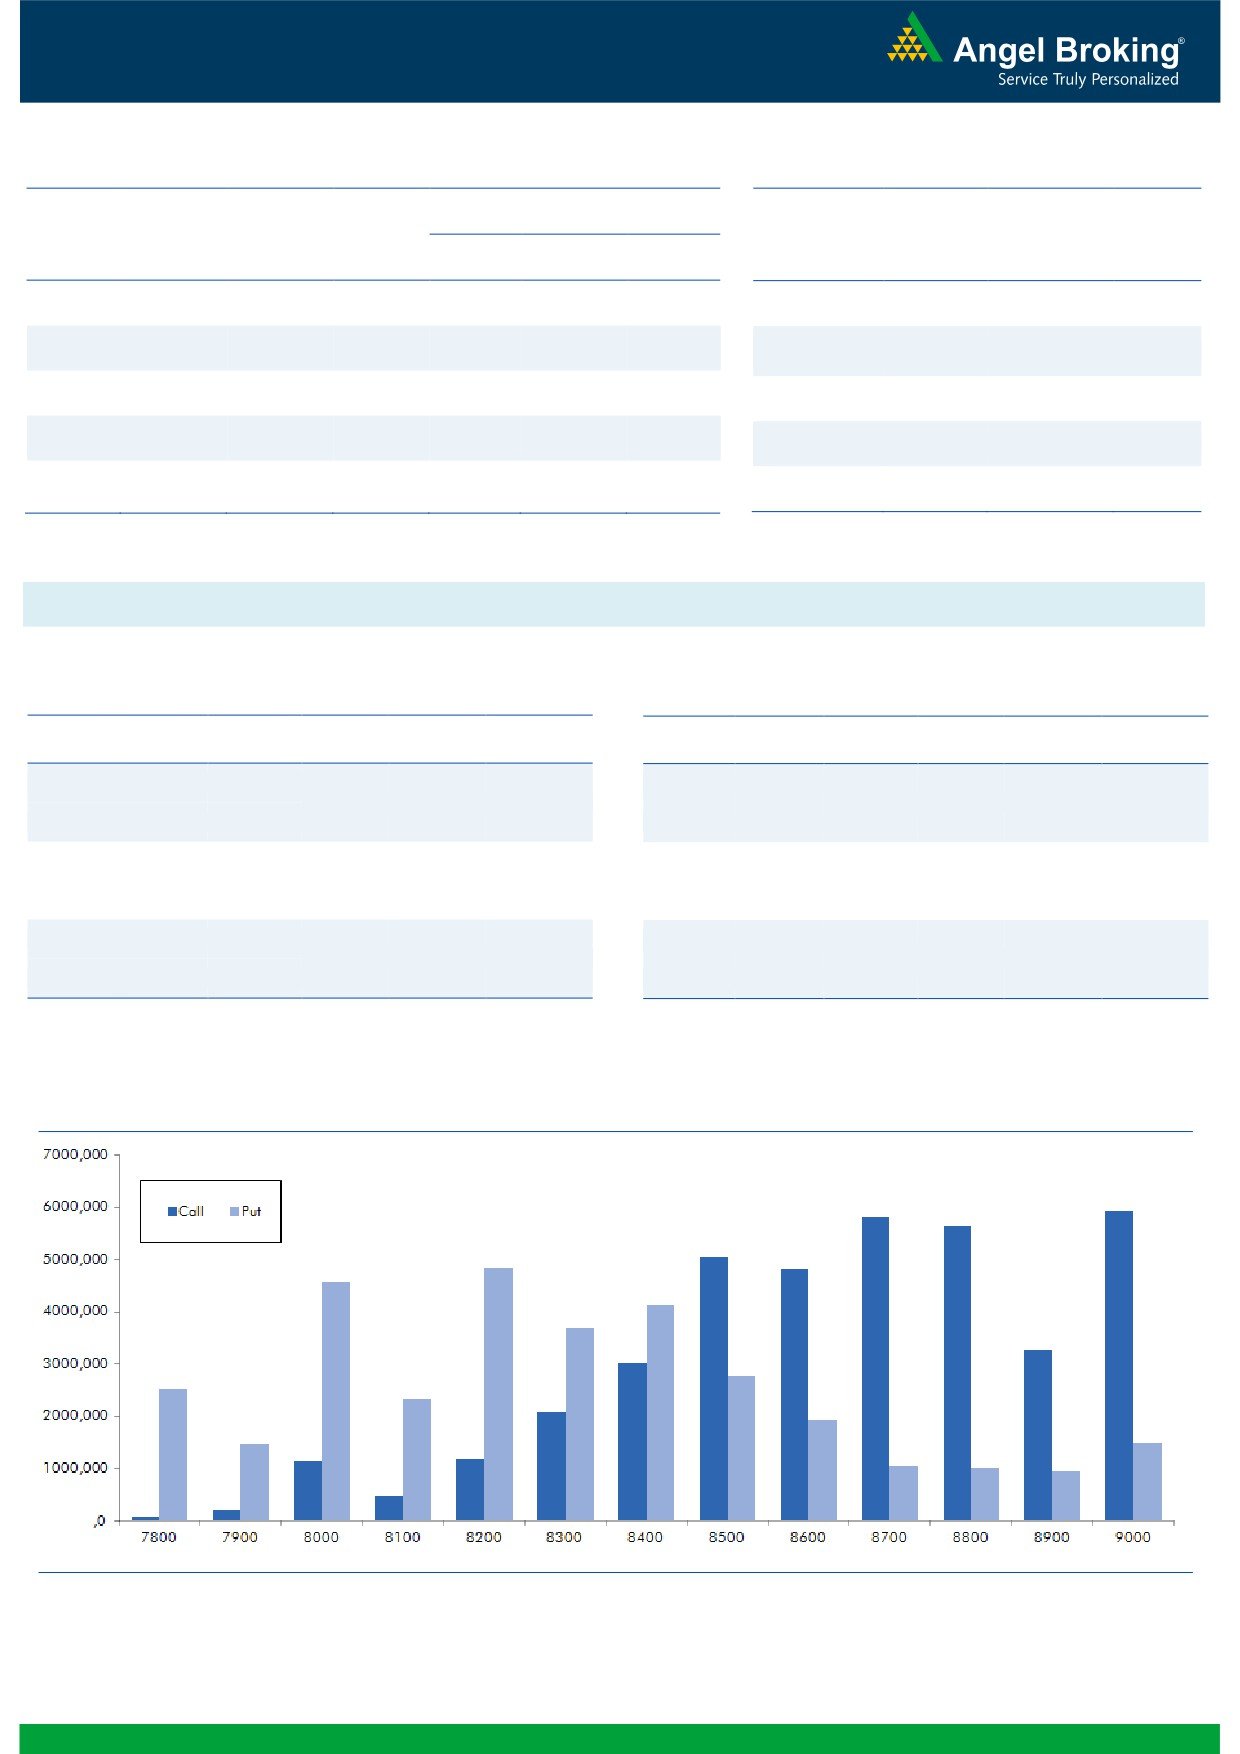
2375 crores with rise in OI. In call options, 8400-8800
INDUSINDBK
3857400
10.46
1197.25
-1.82
strikes prices added huge positions and we believe these
ASIANPAINT
6367800
10.37
966.20
-4.82
are shorts positions formed by FIIs. On the other hand in
put options, we hardly saw any meaningful open interest
addition. While, good amount of unwinding was visible
OI Losers
in
8500 and
8600 put options. Maximum OI in
OI
PRICE
SCRIP
OI
PRICE
CHG. (%)
CHG. (%)
November series is placed at 9000 call and 8200 put
LICHSGFIN
9153100
-10.75
521.45
-5.53
options.
TATASTEEL
20178000
-8.21
428.50
-2.29
FIIs continue to unwind their longs in a big way. They
OIL
921400
-7.98
406.90
-1.17
also bought good amount of put options along with sell
ONGC
18460000
-7.26
273.65
-0.92
positions in call options. Thus, looking at the overall data
BANKINDIA
23796000
-6.37
122.25
-1.85
we believe we may see further pain in Nifty. Hence, we
TATACHEM
6390000
-6.13
483.90
-4.37
suggest traders to avoid any aggressive long positions in
Index.
VOLTAS
3628000
-5.77
333.75
-4.75
NCC
21632000
-5.12
79.35
-2.40
Historical Volatility
Put-Call Ratio
SCRIP
HV
SCRIP
PCR-OI
PCR-VOL
MARICO
45.26
NIFTY
0.84
0.84
M&MFIN
65.32
BANKNIFTY
0.75
0.89
BATAINDIA
40.00
RELIANCE
0.44
0.55
DABUR
36.30
ICICIBANK
0.45
0.64
M&M
41.46
SBIN
0.56
0.69
2
Technical & Derivatives Report
November 15, 2016
FII Statistics for November 11, 2016
Turnover on November 11, 2016
Open Interest
No. of
Turnover
Change
Detail
Buy
Sell
Net
Instrument
Value
Change
Contracts
( in Cr. )
(%)
Contracts
(in Cr.)
(%)
INDEX
INDEX
3734.21
4754.46
(1020.25)
179842
11884.12
(7.16)
382205
26075.48
6.06
FUTURES
FUTURES
INDEX
INDEX
82925.89
85301.19
(2375.30)
1234065
79297.64
10.68
5293743
360567.07
-43.51
OPTIONS
OPTIONS
STOCK
9349.76
11057.43
(1707.67)
890838
55239.76
0.98
STOCK
FUTURES
704444
48457.53
-4.97
FUTURES
STOCK
STOCK
10031.43
10173.18
(141.75)
115040
7595.36
7.27
OPTIONS
587750
42453.84
0.32
OPTIONS
TOTAL
106041.28
111286.26
(5244.98)
2419785
154016.89
5.30
TOTAL
6968142
477553.92
-36.84
Nifty Spot = 8296.30
Lot Size = 75
Bull-Call Spreads
Bear-Put Spreads
Action
Strike
Price
Risk
Reward
BEP
Action
Strike
Price
Risk
Reward
BEP
Buy
8400
75.25
Buy
8300
98.30
33.85
66.15
8433.85
33.05
66.95
8266.95
Sell
8500
41.40
Sell
8200
65.25
Buy
8400
75.25
Buy
8300
98.30
54.30
145.70
8454.30
54.70
145.30
8245.30
Sell
8600
20.95
Sell
8100
43.60
Buy
8500
41.40
Buy
8200
65.25
20.45
79.55
8520.45
21.65
78.35
8178.35
Sell
8600
20.95
Sell
8100
43.60
Note: Above mentioned Bullish or Bearish Spreads in Nifty (November Series) are given as an information and not as a recommendation.
Nifty Put-Call Analysis
3
Technical & Derivatives Report
November 15, 2016
Daily Pivot Levels for Nifty Constituents
Scrips
S2
S1
PIVOT
R1
R2
ACC
1,356
1,378
1,414
1,436
1,471
ADANIPORTS
261
269
281
289
301
AMBUJACEM
212
216
223
226
233
ASIANPAINT
928
945
975
992
1,022
AUROPHARMA
750
761
778
789
806
AXISBANK
484
492
502
509
520
BAJAJ-AUTO
2,548
2,598
2,683
2,733
2,818
BANKBARODA
152
156
163
167
174
BHEL
130
133
138
141
146
BPCL
636
643
652
658
667
BHARTIARTL
293
297
303
307
312
INFRATEL
349
357
369
378
390
BOSCH
19,211
19,617
20,309
20,714
21,406
CIPLA
534
541
552
560
571
COALINDIA
315
320
326
330
336
DRREDDY
3,189
3,223
3,262
3,295
3,335
EICHERMOT
20,728
21,207
22,052
22,530
23,375
GAIL
418
428
438
448
458
GRASIM
872
885
905
918
937
HCLTECH
733
748
771
786
809
HDFCBANK
1,258
1,267
1,274
1,283
1,291
HDFC
1,233
1,251
1,281
1,299
1,329
HEROMOTOCO
2,857
2,916
3,023
3,082
3,189
HINDALCO
167
170
174
177
181
HINDUNILVR
788
795
805
812
822
ICICIBANK
262
269
282
289
301
IDEA
68
69
71
72
74
INDUSINDBK
1,162
1,177
1,203
1,218
1,244
INFY
902
912
928
938
955
ITC
236
240
244
248
252
KOTAKBANK
798
807
816
825
834
LT
1,372
1,380
1,395
1,403
1,418
LUPIN
1,425
1,442
1,469
1,486
1,514
M&M
1,178
1,209
1,263
1,294
1,348
MARUTI
4,987
5,061
5,177
5,250
5,367
NTPC
149
150
152
154
155
ONGC
265
269
274
278
283
POWERGRID
177
180
184
187
191
RELIANCE
982
992
1,005
1,014
1,027
SBIN
259
266
277
284
296
SUNPHARMA
664
676
692
704
720
TCS
2,051
2,076
2,111
2,137
2,172
TATAMTRDVR
320
324
332
337
344
TATAMOTORS
489
498
514
523
539
TATAPOWER
70
71
73
74
76
TATASTEEL
413
420
431
437
448
TECHM
420
425
432
437
444
ULTRACEMCO
3,492
3,563
3,682
3,753
3,872
WIPRO
430
436
440
446
450
YESBANK
1,161
1,188
1,237
1,264
1,313
ZEEL
466
474
488
496
509
4
Technical & Derivatives Report
November 15, 2016
Research Team Tel: 022 - 39357800
For Technical Queries
For Derivatives Queries
DISCLAIMER
Angel Broking Private Limited (hereinafter referred to as “Angel”) is a registered Member of National Stock Exchange of India Limited,
Bombay Stock Exchange Limited and Metropolitan Stock Exchange Limited. It is also registered as a Depository Participant with CDSL
and Portfolio Manager with SEBI. It also has registration with AMFI as a Mutual Fund Distributor. Angel Broking Private Limited is a
registered entity with SEBI for Research Analyst in terms of SEBI (Research Analyst) Regulations, 2014 vide registration number
INH000000164. Angel or its associates has not been debarred/ suspended by SEBI or any other regulatory authority for accessing
/dealing in securities Market. Angel or its associates/analyst has not received any compensation / managed or co-managed public
offering of securities of the company covered by Analyst during the past twelve months.
This document is solely for the personal information of the recipient, and must not be singularly used as the basis of any investment
decision. Nothing in this document should be construed as investment or financial advice. Each recipient of this document should
make such investigations as they deem necessary to arrive at an independent evaluation of an investment in the securities of the
companies referred to in this document (including the merits and risks involved), and should consult their own advisors to determine
the merits and risks of such an investment.
Reports based on technical and derivative analysis center on studying charts of a stock's price movement, outstanding positions and
trading volume, as opposed to focusing on a company's fundamentals and, as such, may not match with a report on a company's
fundamentals. Investors are advised to refer the Fundamental and Technical Research Reports available on our website to evaluate the
contrary view, if any.
The information in this document has been printed on the basis of publicly available information, internal data and other reliable
sources believed to be true, but we do not represent that it is accurate or complete and it should not be relied on as such, as this
document is for general guidance only. Angel Broking Pvt. Limited or any of its affiliates/ group companies shall not be in any way
responsible for any loss or damage that may arise to any person from any inadvertent error in the information contained in this report.
Angel Broking Pvt. Limited has not independently verified all the information contained within this document. Accordingly, we cannot
testify, nor make any representation or warranty, express or implied, to the accuracy, contents or data contained within this document.
While Angel Broking Pvt. Limited endeavors to update on a reasonable basis the information discussed in this material, there may be
regulatory, compliance, or other reasons that prevent us from doing so.
This document is being supplied to you solely for your information, and its contents, information or data may not be reproduced,
redistributed or passed on, directly or indirectly.
Neither Angel Broking Pvt. Limited, nor its directors, employees or affiliates shall be liable for any loss or damage that may arise from
or in connection with the use of this information.
5