October 15, 2015
Sensex (26780) / Nifty (8108)
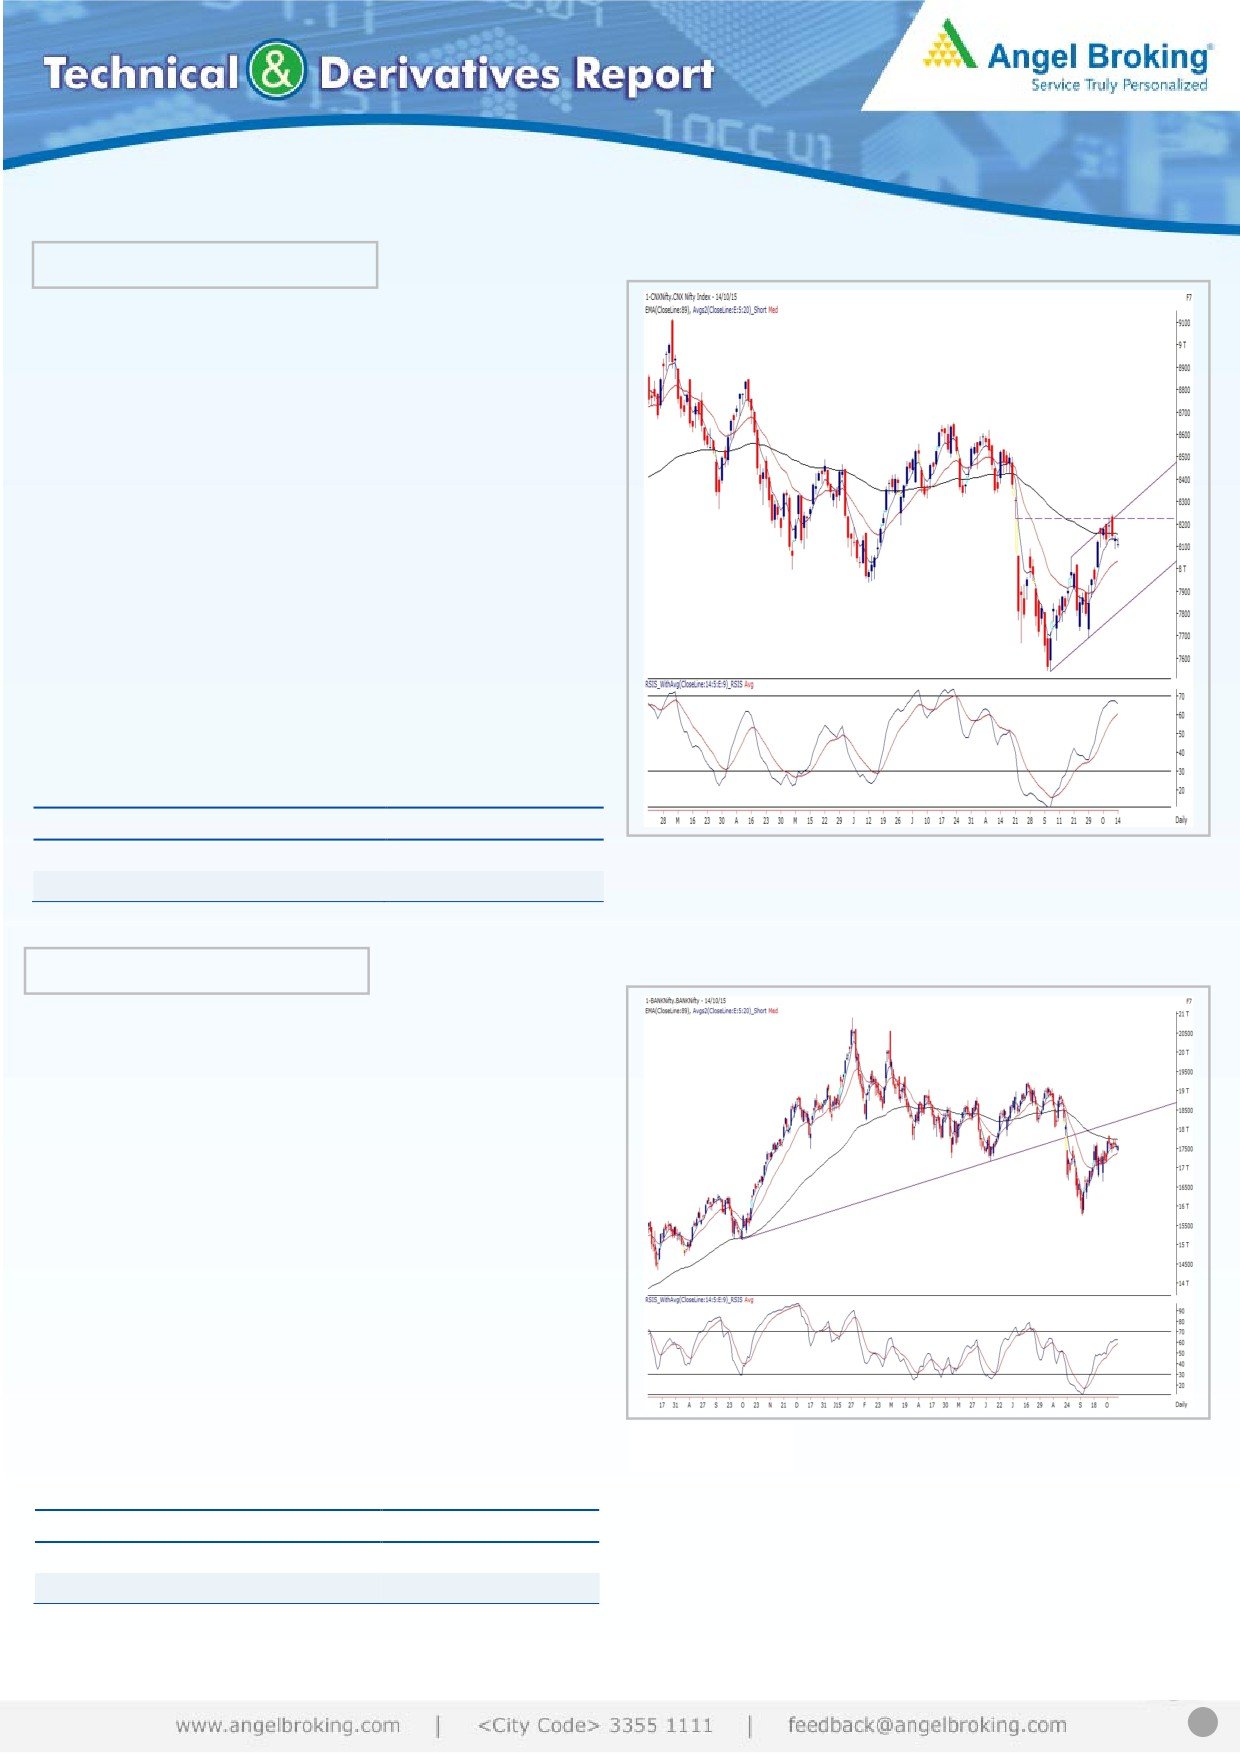
Exhibit 1: Nifty Daily Chart
Yesterday too, our benchmark index opened slightly lower
despite negative cues from other Asian bourses. The soft
opening was mainly led by another IT giant, TCS, as the company
posted lower-than-expected 2QFY2016 numbers post the market
hours on Tuesday.
Yesterday’s price action was a replica of Tuesday’s session, in
fact; the price range was much narrower as the Nifty traded
within merely 43 points. Thus, the intraday movement was very
lethargic. Unlike Tuesday, the Nifty did not recover much and
eventually closed almost at the lowest of the day. The chart
structure remains unchanged and thus, we continue to expect
the Nifty to remain within a small range of 8250 to 8050 whilst
the 8250 mark is likely to act as a major hurdle for the bulls. It’s
advisable to stay light on positions and focus more on stock
specific moves.
Key Levels
Support 1 - 8095
Resistance 1 - 8142
Source: Falcon
Support 2 - 8050
Resistance 2 - 8250
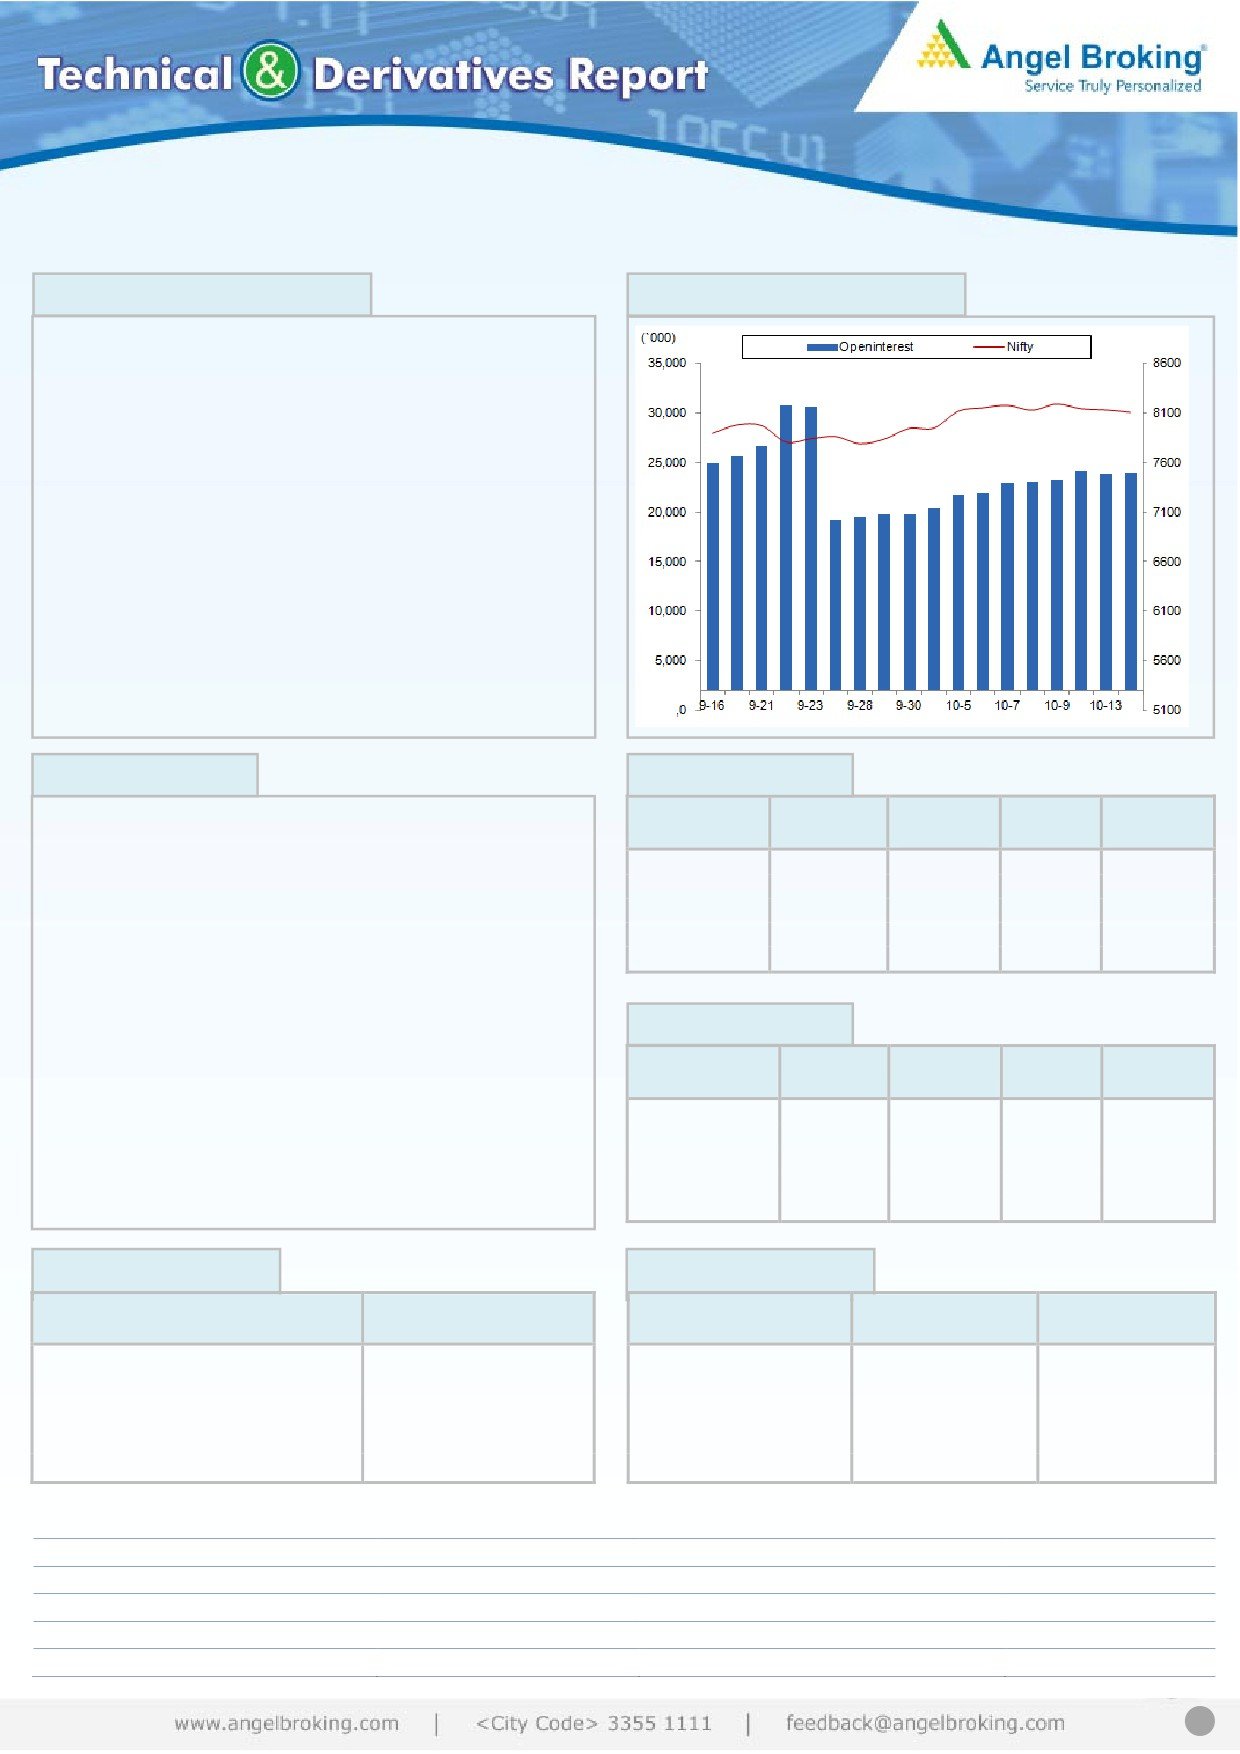
Bank Nifty Outlook - (17555)
Exhibit 2: Bank Nifty Daily Chart
Yesterday, the Bank Nifty opened with a downside gap of nearly
100 points in-line with broader indices. The index then gave a
smart recovery from its initial lows within the first hour of the
trading. This was followed by a lackluster movement to
eventually end the session with the negligible loss.
Yesterday, the Bank Nifty took a support around the ’89 EMA’ in
the hourly chart and then consolidated above it. However, the
index once again failed to move above the resistance of the
neckline of the ‘Inverted Head & Shoulder’, which coincides with
the ’89 EMA’ in the daily chart. Since last few sessions, the
banking index is trading in a range of 17350 to 17850 and a
sustainable move beyond this zone will dictate the further move
in the index. Going forward, the intraday support for the Bank
Nifty is placed at 17400 - 17350 levels; whereas, 17650 and
Source: Falcon
17750 will now act as an intraday resistance zone for the index.
Key Levels
Support 1 - 17400
Resistance 1 - 17650
Support 2 - 17350
Resistance 2 - 17750
1
October 15, 2015
Comments
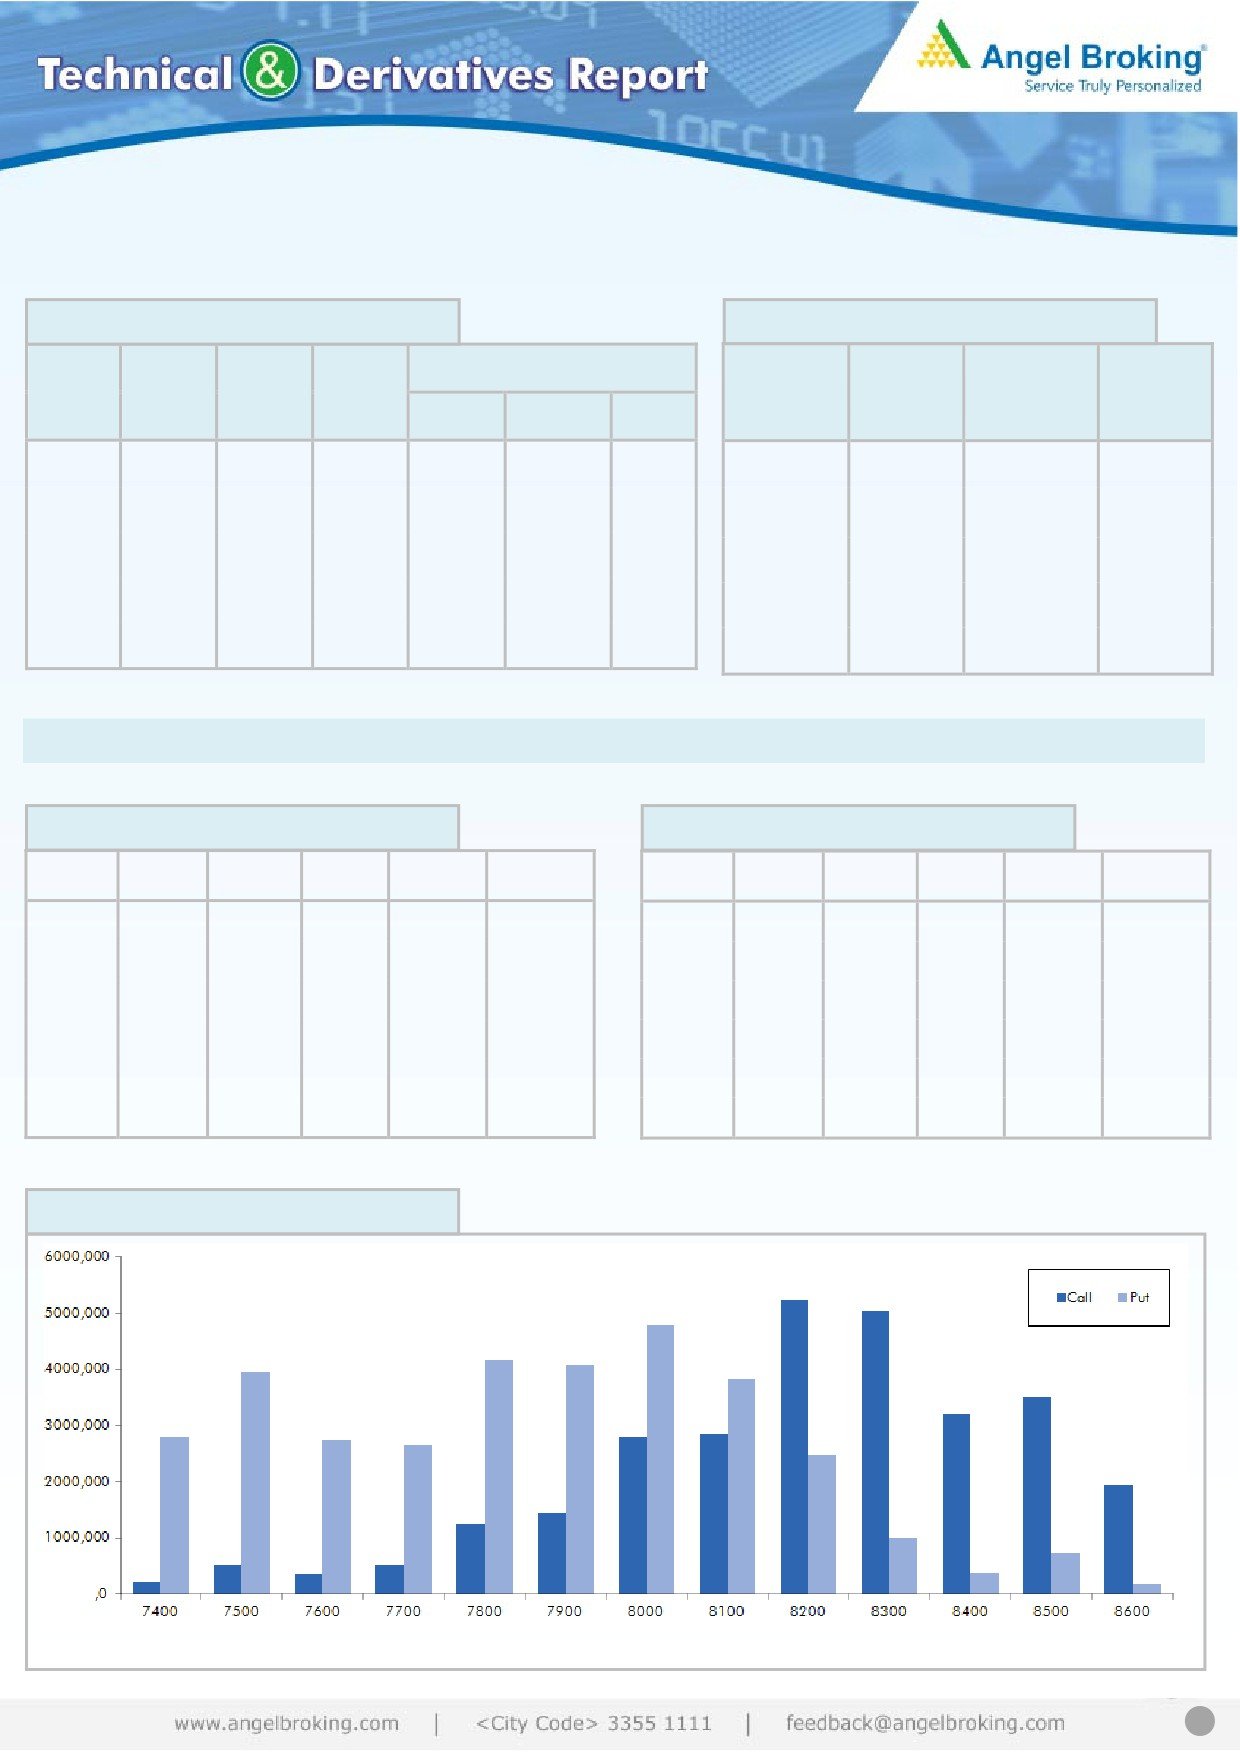
Nifty Vs OI
The Nifty futures open interest has increased by 0.43%
BankNifty futures open interest has increased by 0.75%
as market closed at 8107.90 levels.
The Nifty October future closed at a premium of 13.50
points against a premium of 7.10 points. The November
series closed at a premium of 53.50 points.
The Implied Volatility of at the money options has
decreased from 15.79% to 15.39%.
The total OI of the market is Rs. 2,22,436/- cr. and the
stock futures OI is Rs. 59,780/- cr.
Few of the liquid counters where we have seen high
cost of carry are GMRINFRA, JPASSOCIAT, UNITECH,
TATAPOWER and JISLJALEQS.
Views
OI Gainers
OI
PRICE
Yesterday, FIIs were net buyers in cash market segment
SCRIP
OI
PRICE
CHG. (%)
CHG. (%)
to the tune of Rs. 121 crores. While in Index Futures
ZEEL
9606400
33.21
387.30
-3.54
they were net sellers of Rs. 872 crores with fall in OI,
BEML
195000
17.82
1245.80
1.67
indicating unwinding of longs in last trading session.
TV18BRDCST
14960000
16.40
33.60
-3.45
HINDUNILVR
5217050
12.69
792.40
-2.05
In Index Options front, FIIs sold of Rs. 919 crores with
INDIACEM
23786000
9.77
81.45
3.23
fall in OI. We hardly saw any strikes adding reasonable
build-up in Nifty options yesterday. 7800 put option
added some build-up. While huge unwinding was
OI Losers
visible in 8100 put options. Maximum OI is seen in 8200
OI
PRICE
SCRIP
OI
PRICE
call and
8000 put options. FIIs were continuously
CHG. (%)
CHG. (%)
NCC
4480000
-20.23
80.95
-0.67
forming longs in Index Futures but we didn’t see buying
ACC
1015750
-14.67
1379.50
1.59
interest in heavy weight large cap counters. We would
ENGINERSIN
1217800
-7.38
208.80
2.43
suggest being light in Nifty and trading stock specific.
SYNDIBANK
8112000
-6.18
92.45
1.54
HDIL
13894000
-4.73
76.50
-0.52
Historical Volatility
Put-Call Ratio
SCRIP
HV
SCRIP
PCR-OI
PCR-VOL
TCS
30.14
NIFTY
1.00
0.98
ZEEL
36.26
BANKNIFTY
0.95
0.69
BHARATFORG
50.46
INFY
0.31
0.34
HINDUNILVR
25.25
SBIN
0.46
0.45
AUROPHARMA
41.29
TATAMOTORS
0.99
0.77
Strategy Date
Symbol
Strategy
Status
September 28, 2015
NIFTY
Long Strangle
Active
October 05, 2015
SBIN
Ratio Bear Put Spread
Active
October 12, 2015
LT
Long Put Ladder
Active
2
October 15, 2015
FII Statistics for 14-October 2015
Turnover on 14-October 2015
Open Interest
No. of
Turnover
Change
Detail
Buy
Sell
Net
Instrument
Contracts
( in Cr. )
(%)
Contracts
Value
Change
INDEX
INDEX
1885.01
2757.64
(872.64)
970490
23255.54
(2.36)
461001
12673.25
-17.18
FUTURES
FUTURES
INDEX
INDEX
6037.04
6956.90
(919.87)
2227933
70029.09
(1.42)
4242236
95191.63
-29.81
OPTIONS
OPTIONS
STOCK
STOCK
2179.16
2867.54
(688.38)
1801612
47455.38
0.31
FUTURES
744279
20180.27
3.30
FUTURES
STOCK
1693.16
1718.22
(25.05)
132504
3566.89
3.17
STOCK
502979
14088.3
4.94
OPTIONS
OPTIONS
TOTAL
11794.36
14300.31
(2505.95)
5132539
144306.90
(0.88)
TOTAL
5950495
142133.45
-22.70
Nifty Spot = 8107.90
Lot Size = 25
Bull-Call Spreads
Bear-Put Spreads
Action
Strike
Price
Risk
Reward
BEP
Action
Strike
Price
Risk
Reward
BEP
Buy
Buy
8200
60.80
8100
92.50
32.70
67.30
8232.70
32.60
67.40
8067.40
Sell
Sell
8300
28.10
8000
59.90
Buy
Buy
8200
60.80
8100
92.50
49.30
150.70
8249.30
54.50
145.50
8045.50
Sell
Sell
8400
11.50
7900
38.00
Buy
Buy
8300
28.10
8000
59.90
16.60
83.40
8316.60
21.90
78.10
7978.10
Sell
Sell
8400
11.50
7900
38.00
Note: Above mentioned Bullish or Bearish Spreads in Nifty (Oct. Series) are given as an information and not as a recommendation.
Nifty Put-Call Analysis
3
October 15, 2015
Daily Pivot Levels for Nifty 50 Stocks
Scrips
S2
S1
PIVOT
R1
R2
ACC
1,343
1,359
1,369
1,386
1,395
AMBUJACEM
208
209
210
211
212
ASIANPAINT
854
858
864
868
873
AXISBANK
485
490
493
499
502
BAJAJ-AUTO
2,402
2,420
2,450
2,468
2,497
BANKBARODA
171
172
174
176
178
BHARTIARTL
338
342
346
350
354
BHEL
201
203
206
208
212
BOSCHLTD
20,842
21,014
21,172
21,344
21,502
BPCL
854
858
865
869
875
CAIRN
153
156
161
164
170
CIPLA
653
666
673
686
693
COALINDIA
330
333
336
338
342
DRREDDY
4,132
4,165
4,212
4,245
4,292
GAIL
309
313
317
321
325
GRASIM
3,602
3,619
3,639
3,656
3,676
HCLTECH
819
826
833
840
846
HDFC
1,265
1,280
1,288
1,303
1,312
HDFCBANK
1,060
1,072
1,079
1,092
1,099
HEROMOTOCO
2,458
2,479
2,514
2,535
2,570
HINDALCO
83
86
88
91
94
HINDUNILVR
772
784
800
812
828
ICICIBANK
280
282
283
285
287
IDEA
148
149
152
153
155
INDUSINDBK
937
943
953
959
969
INFY
1,072
1,085
1,100
1,113
1,128
ITC
341
343
344
346
347
KOTAKBANK
644
648
655
660
667
LT
1,524
1,532
1,543
1,551
1,562
LUPIN
2,005
2,036
2,057
2,088
2,109
M&M
1,267
1,277
1,284
1,294
1,301
MARUTI
4,209
4,229
4,262
4,283
4,316
NMDC
96
97
99
100
102
NTPC
123
125
126
128
129
ONGC
247
251
257
261
267
PNB
133
134
136
137
139
POWERGRID
132
132
133
134
134
RELIANCE
890
896
901
907
912
SBIN
241
243
245
246
248
VEDL
103
105
109
111
115
SUNPHARMA
874
879
886
891
899
TATAMOTORS
345
349
355
358
364
TATAPOWER
69
69
70
70
71
TATASTEEL
239
244
248
253
258
TCS
2,436
2,460
2,504
2,528
2,572
TECHM
533
541
553
560
572
ULTRACEMCO
2,867
2,887
2,911
2,931
2,955
WIPRO
573
578
586
591
600
YESBANK
725
732
737
744
750
ZEEL
369
378
389
398
410
4
October 15, 2015
Research Team Tel: 022 - 39357800
For Technical Queries
For Derivatives Queries
DISCLAIMER
Angel Broking Private Limited (hereinafter referred to as “Angel”) is a registered Member of National Stock Exchange of India Limited,
Bombay Stock Exchange Limited and MCX Stock Exchange Limited. It is also registered as a Depository Participant with CDSL and
Portfolio Manager with SEBI. It also has registration with AMFI as a Mutual Fund Distributor. Angel Broking Private Limited is a
registered entity with SEBI for Research Analyst in terms of SEBI (Research Analyst) Regulations, 2014 vide registration number
INH000000164. Angel or its associates has not been debarred/ suspended by SEBI or any other regulatory authority for accessing
/dealing in securities Market. Angel or its associates including its relatives/analyst do not hold any financial interest/beneficial
ownership of more than 1% in the company covered by Analyst. Angel or its associates/analyst has not received any compensation /
managed or co-managed public offering of securities of the company covered by Analyst during the past twelve months.
Angel/analyst has not served as an officer, director or employee of company covered by Analyst and has not been engaged in market
making activity of the company covered by Analyst.
This document is solely for the personal information of the recipient, and must not be singularly used as the basis of any investment
decision. Nothing in this document should be construed as investment or financial advice. Each recipient of this document should
make such investigations as they deem necessary to arrive at an independent evaluation of an investment in the securities of the
companies referred to in this document (including the merits and risks involved), and should consult their own advisors to determine
the merits and risks of such an investment.
Reports based on technical and derivative analysis center on studying charts of a stock's price movement, outstanding positions and
trading volume, as opposed to focusing on a company's fundamentals and, as such, may not match with a report on a company's
fundamentals.
The information in this document has been printed on the basis of publicly available information, internal data and other reliable
sources believed to be true, but we do not represent that it is accurate or complete and it should not be relied on as such, as this
document is for general guidance only. Angel Broking Pvt. Limited or any of its affiliates/ group companies shall not be in any way
responsible for any loss or damage that may arise to any person from any inadvertent error in the information contained in this
report. Angel Broking Pvt. Limited has not independently verified all the information contained within this document. Accordingly, we
cannot testify, nor make any representation or warranty, express or implied, to the accuracy, contents or data contained within this
document. While Angel Broking Pvt. Limited endeavors to update on a reasonable basis the information discussed in this material,
there may be regulatory, compliance, or other reasons that prevent us from doing so.
This document is being supplied to you solely for your information, and its contents, information or data may not be reproduced,
redistributed or passed on, directly or indirectly.
Neither Angel Broking Pvt. Limited, nor its directors, employees or affiliates shall be liable for any loss or damage that may arise from
or in connection with the use of this information.
Note: Please refer to the important ‘Stock Holding Disclosure' report on the Angel website (Research Section). Also, please
refer to the latest update on respective stocks for the disclosure status in respect of those stocks. Angel Broking Pvt. Limited
5