Technical & Derivatives Report
September 15, 2016
Sensex (28372) / Nifty (8727)
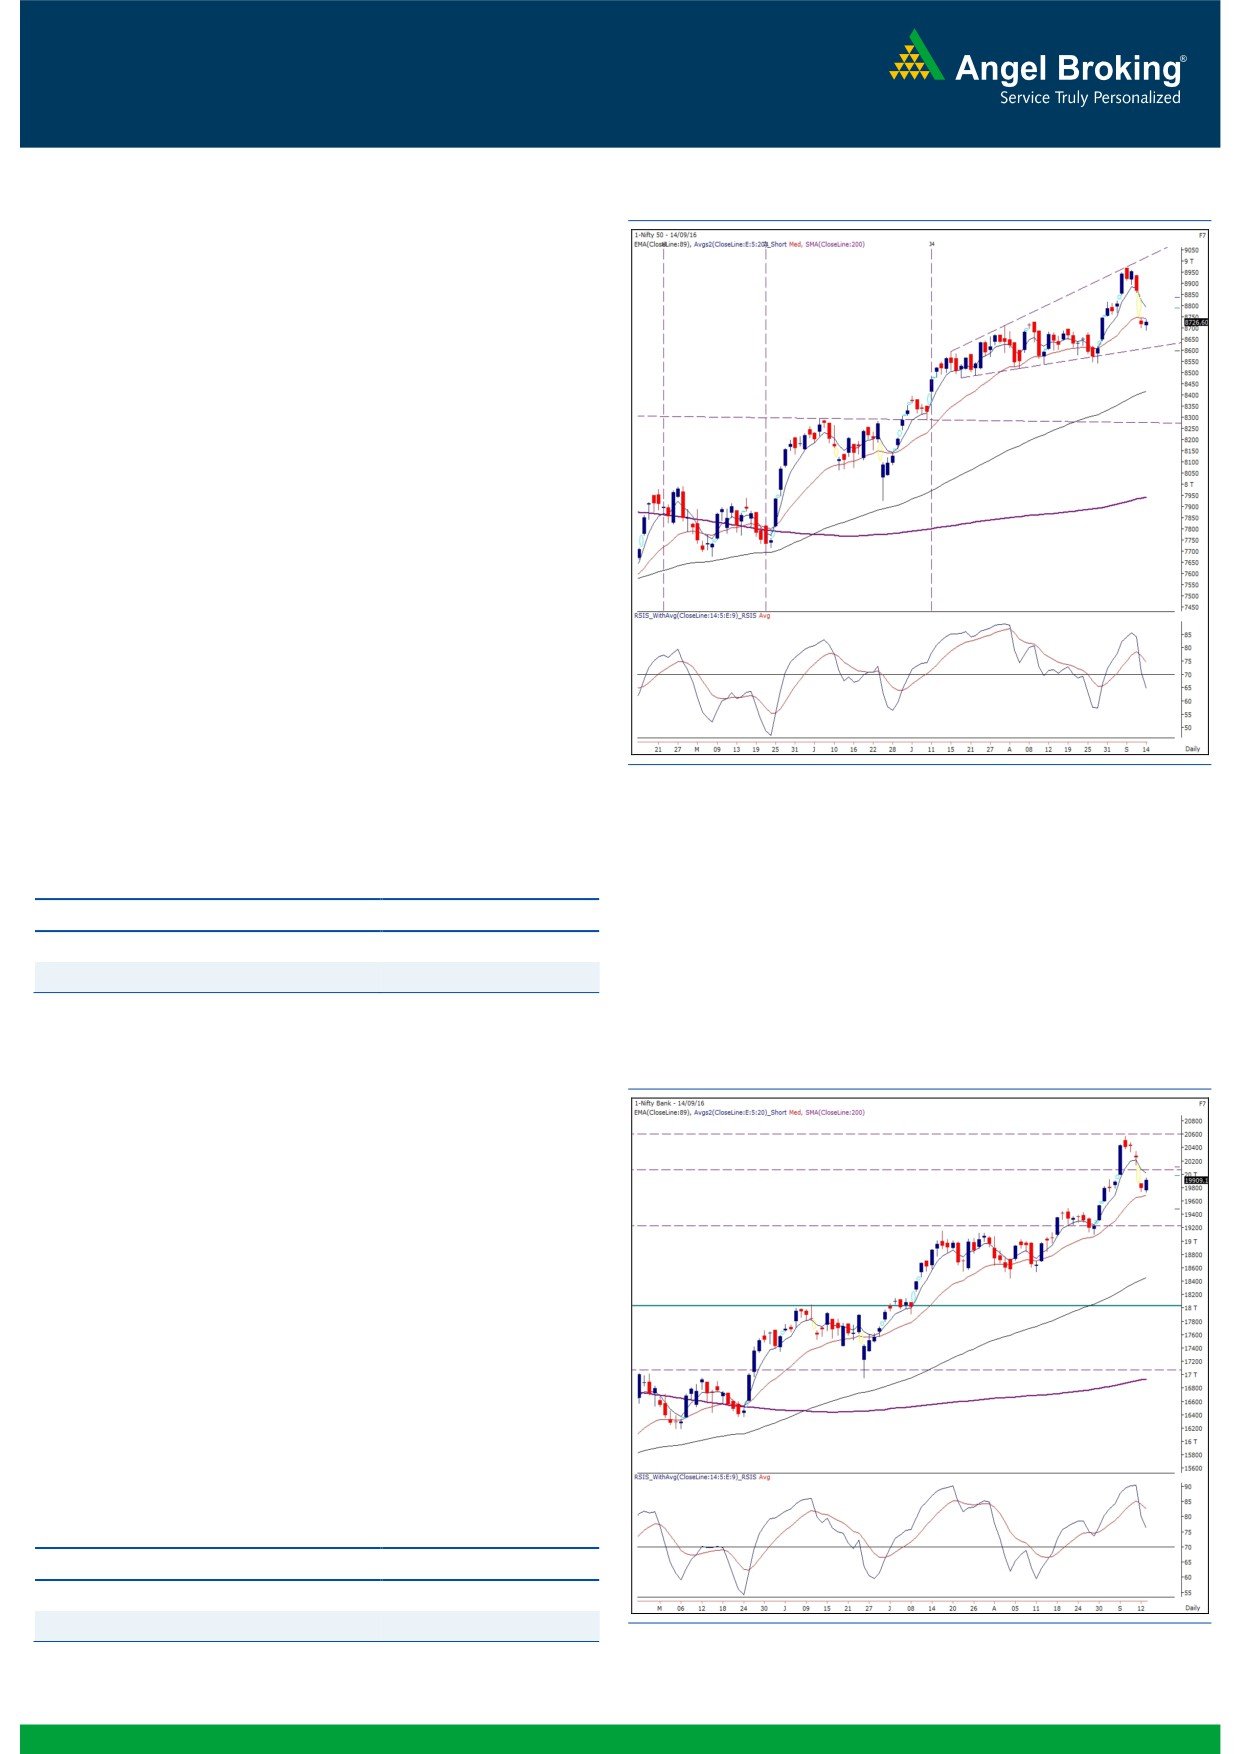
Exhibit 1: Nifty Daily Chart
Yesterday, our markets opened on a flat note mirroring mixed
cues from the global bourses. Subsequently, we saw a gentle
selling pressure in the initial hour to sneak below the 8700 mark
by a small margin. Due to modest recovery in the latter half, the
Nifty eventually ended the session with negligible gains.
Similar to Monday’s session, we witnessed a lethargic intraday
movement within a very narrow range throughout the day.
Technically speaking, after a huge downside gap on the opening
day of the week, our benchmark index seems to be in a
consolidation mode around the ‘200-SMA’ on hourly chart. On
previous occasions in the recent past, this technical tool played a
sheet anchor role; but, now we are a bit skeptical on it. Going
ahead, considering the extreme oversold position of ‘RSI-
Smoothened’ on hourly chart, we may see a small bounce back
towards 8760 - 8780; but, we would advise traders not to
participate aggressively in it. We expect any attempt of a bounce
back towards mentioned levels to get sold into. The selling
pressure may get aggravated once the Nifty starts sustaining
below yesterday’s low of 8688.90. In this case, we may see the
index sliding towards the next support zone 8642 - 8612 levels.
The index may continue to trade in a range; but the bias would
be on the negative side.
Key Levels
Support 1 - 8642
Resistance 1 - 8760
Support 2 - 8612
Resistance 2 - 8780
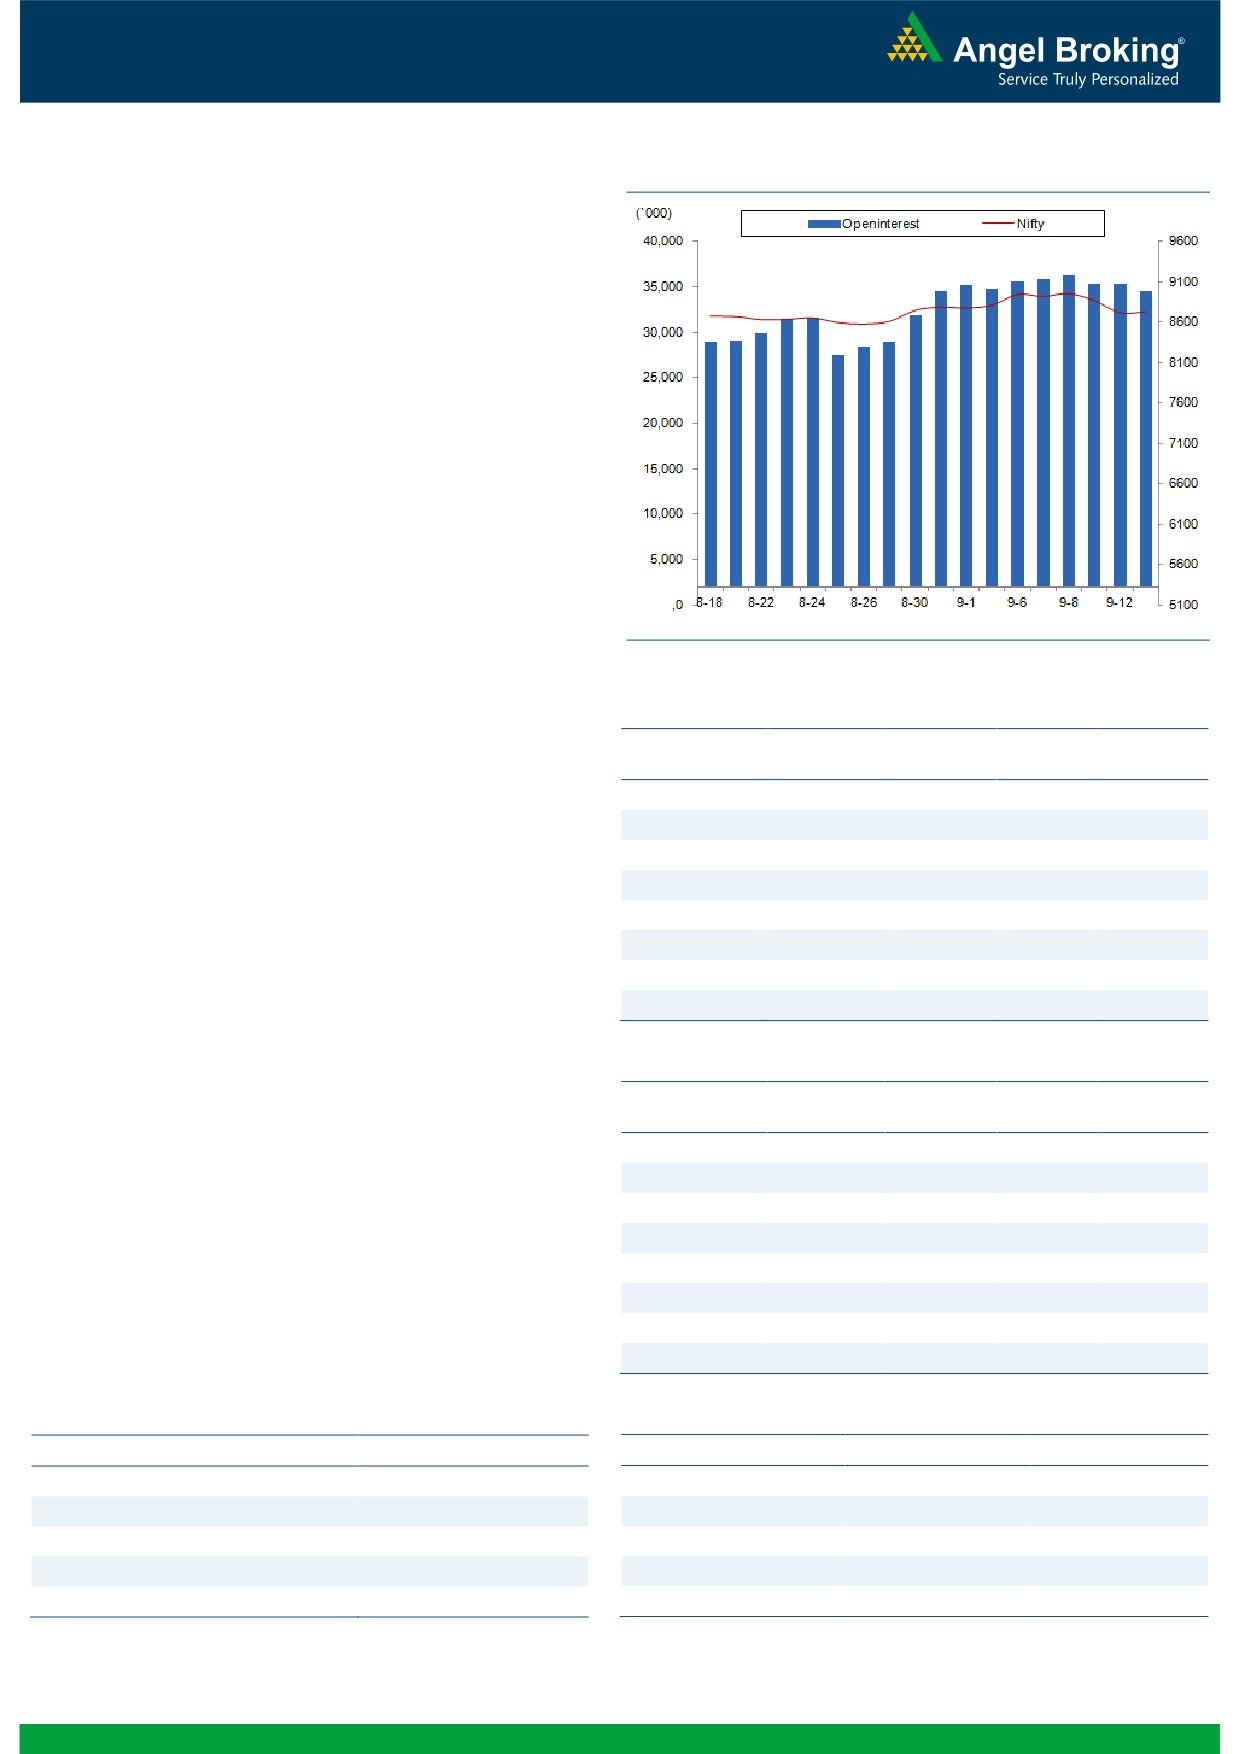
Exhibit 2: Nifty Bank Daily Chart
Nifty Bank Outlook - (19909)
The Nifty Bank index pulled higher yesterday post opening and
ended the session with gains of 0.60 percent over its previous
session's close.
Yesterday's session witnessed more of stock specific action rather
than any significant movement in the index. As we had also
mentioned yesterday, the next couple of sessions will be crucial to
determine the short term trend of the index. Monday's gap area of
19861-20139 is a resistance zone now and the index needs to
cross the higher end of the gap to negate the bearish implication
of Monday's gap down opening. Untill then, traders are advised
to stay light on positions and remain cautious on further market
moves. The intraday support for the index is placed in range of
19735-19670 whereas resistance is seen in range of 19990-
20139.
Key Levels
Support 1 - 19735
Resistance 1 - 19990
Support 2 - 19670
Resistance 2 - 20139
1
Technical & Derivatives Report
September 15, 2016
Comments
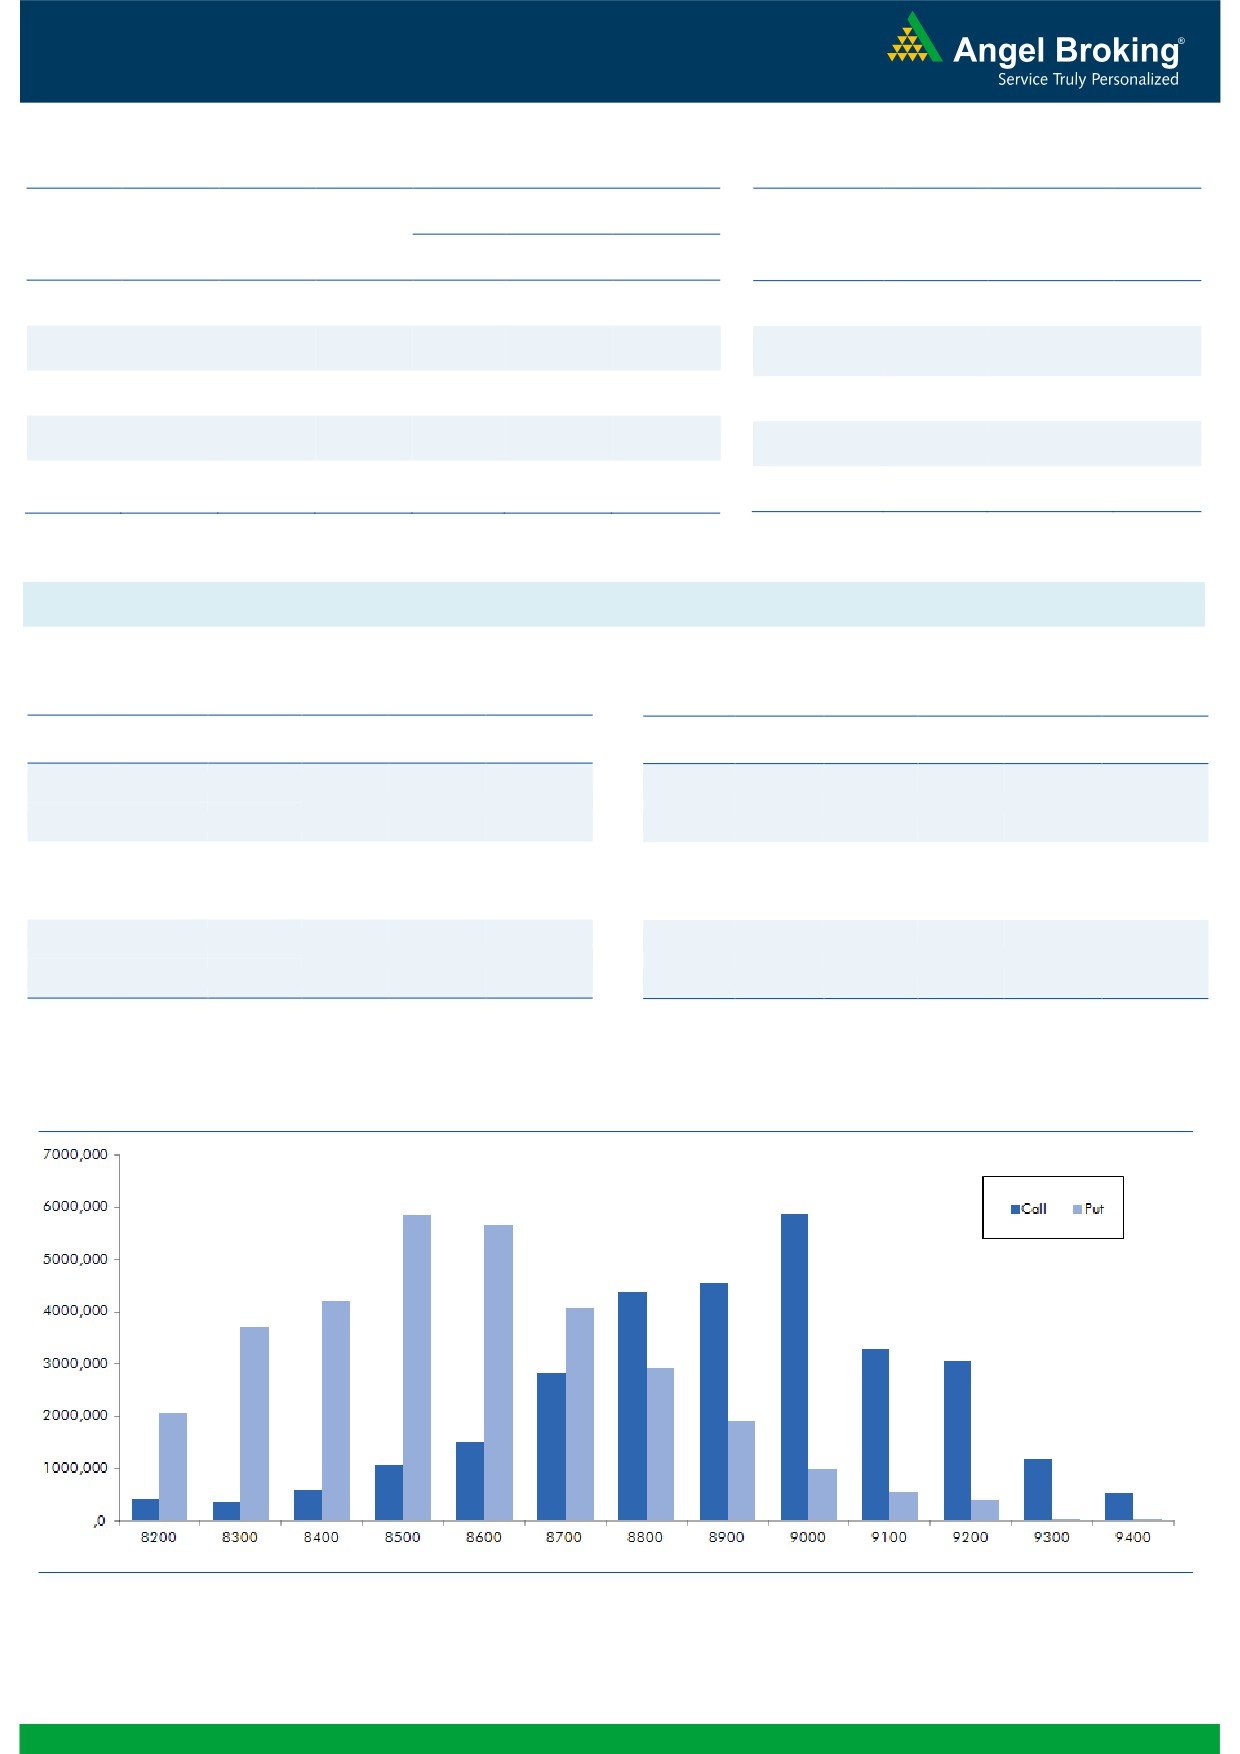
Nifty Vs OI
The Nifty futures open interest has decreased by 0.34%
BankNifty futures open interest has decreased by 0.75%
as market closed at 8726.60 levels.
The Nifty September future closed with a premium of
41.95 points against a premium of 26.35 points in
previous session. The October series closed at a
premium of 79.95 points.
The Implied Volatility of at the money options has
decreased from 14.32% to 13.93%. At the same time,
the PCR-OI of Nifty has decreased from 1.10 to 1.09.
The total OI of the market is Rs. 3,02,607/- cr. and the
stock futures OI is Rs. 84,017/- cr.
Few of the liquid counters where we have seen high cost
of carry are JPASSOCIAT, ADANIPOWER, IFCI,
GMRINFRA and HDFCBANK.
Views
FIIs continue selling in both cash market segment and
OI Gainers
Index Futures. They sold equities to the tune of Rs. 477
OI
PRICE
SCRIP
OI
PRICE
crores. While, they were net sellers in index future of Rs.
CHG. (%)
CHG. (%)
PCJEWELLER
769500
47.84
517.60
8.08
551 crores with some rise in OI, indicating blend of fresh
APOLLOTYRE
12594000
19.40
214.55
4.84
short formations and some long unwinding in last
trading session.
CASTROLIND
6594000
18.97
444.95
-4.31
www.angelbroking.com
On Index Options front, FIIs bought of Rs. 346 crores
UPL
6056400
12.86
700.00
7.81
with rise in OI. Yesterday, both in call and put options,
KSCL
3760500
11.97
354.90
4.86
we hardly saw any meaningful OI addition. 8800 call
TATAMOTORS
31096500
10.23
563.40
1.31
and 8300 & 8500 put options were comparatively active
BATAINDIA
3130600
9.93
525.00
-0.45
and added some build-up. Highest OI in September
TORNTPHARM
360400
9.34
1637.40
-1.28
series is placed at 9000 call and of put option has shifted
to 8500 strike.
OI Losers
We witness FIIs selling in both equity cash and Index
OI
PRICE
SCRIP
OI
PRICE
Futures from past few sessions. While, they also booked
CHG. (%)
CHG. (%)
losses in their puts that they sold earlier. Seeing the
YESBANK
13740300
-6.39
1256.60
3.85
above data, we believe Nifty may continue to remain
IOC
10122000
-6.33
567.15
2.40
under pressure. Thus, traders should square-off their
HDIL
31984000
-6.26
91.30
1.16
longs and look for shorting near 8750-8800 levels.
DLF
44810000
-5.93
145.00
-0.45
Large cap counters that added long positions yesterday
HINDZINC
5232000
-5.16
221.20
3.83
are TATAMOTORS, ULTRACEMCO, AMBUJACEM and
JISLJALEQS
42273000
-4.82
94.65
9.04
MARUTI. While, counters like HCLTECH, BOSCHLTD,
HINDPETRO
30034200
-4.30
401.20
0.26
KOTAKBANK and M&M added short positions.
DISHTV
32298000
-4.25
96.05
4.57
Historical Volatility
Put-Call Ratio
SCRIP
HV
SCRIP
PCR-OI
PCR-VOL
UPL
45.13
NIFTY
1.09
1.06
PCJEWELLER
51.87
BANKNIFTY
0.97
0.87
RELCAPITAL
60.66
RELIANCE
0.52
0.60
JISLJALEQS
69.36
YESBANK
0.49
0.46
CENTURYTEX
51.88
SBIN
0.59
0.45
2
Technical & Derivatives Report
September 15, 2016
FII Statistics for 14, September 2016
Turnover on 14, September 2016
Open Interest
No. of
Turnover
Change
Detail
Buy
Sell
Net
Instrument
Value
Contracts
( in Cr. )
(%)
Contracts
Change (%)
(in Cr.)
INDEX
INDEX
1542.22
2093.39
(551.17)
464154
31120.17
1.07
191684
13556.97
-32.90
FUTURES
FUTURES
INDEX
INDEX
40272.33
39926.13
346.20
1239232
83356.85
2.27
3739179
275757.43
-6.50
OPTIONS
OPTIONS
STOCK
6208.24
6977.26
(769.02)
912703
60778.42
1.48
STOCK
FUTURES
562933
40849.34
-2.90
FUTURES
STOCK
STOCK
5201.25
5233.03
(31.78)
111812
7759.60
1.79
OPTIONS
347686
26112.70
-16.67
OPTIONS
TOTAL
53224.03
54229.80
(1005.78)
2727901
183015.04
1.78
TOTAL
4841482
356276.44
-8.30
Nifty Spot = 8726.60
Lot Size = 75
Bull-Call Spreads
Bear-Put Spreads
Action
Strike
Price
Risk
Reward
BEP
Action
Strike
Price
Risk
Reward
BEP
Buy
8800
77.55
Buy
8700
70.45
38.50
61.50
8838.50
26.45
73.55
8673.55
Sell
8900
39.05
Sell
8600
44.00
Buy
8800
77.55
Buy
8700
70.45
60.55
139.45
8860.55
42.65
157.35
8657.35
Sell
9000
17.00
Sell
8500
27.80
Buy
8900
39.05
Buy
8600
44.00
22.05
77.95
8922.05
16.20
83.80
8583.80
Sell
9000
17.00
Sell
8500
27.80
Note: Above mentioned Bullish or Bearish Spreads in Nifty (September Series) are given as an information and not as a recommendation.
Nifty Put-Call Analysis
3
Technical & Derivatives Report
September 15, 2016
Daily Pivot Levels for Nifty Constituents
Scrips
S2
S1
PIVOT
R1
R2
ACC
1,566
1,593
1,610
1,637
1,654
ADANIPORTS
252
258
263
270
274
AMBUJACEM
257
261
263
267
269
ASIANPAINT
1,135
1,149
1,164
1,178
1,193
AUROPHARMA
770
777
783
790
797
AXISBANK
585
593
599
607
613
BAJAJ-AUTO
2,914
2,943
2,969
2,997
3,023
BANKBARODA
159
164
166
171
173
BHEL
142
144
147
149
152
BPCL
561
568
573
580
586
BHARTIARTL
314
317
320
323
326
INFRATEL
335
339
344
347
352
BOSCH
22,541
22,781
23,190
23,430
23,839
CIPLA
563
570
577
584
591
COALINDIA
318
321
324
327
331
DRREDDY
3,119
3,139
3,154
3,174
3,189
EICHERMOT
22,057
22,327
22,621
22,891
23,185
GAIL
381
384
387
389
392
GRASIM
4,587
4,652
4,695
4,760
4,803
HCLTECH
762
769
782
789
802
HDFCBANK
1,259
1,264
1,271
1,276
1,282
HDFC
1,370
1,381
1,390
1,401
1,409
HEROMOTOCO
3,492
3,541
3,575
3,625
3,659
HINDALCO
137
140
142
145
147
HINDUNILVR
893
901
913
920
932
ICICIBANK
263
267
271
275
278
IDEA
82
83
84
84
85
INDUSINDBK
1,172
1,181
1,191
1,200
1,210
INFY
1,031
1,038
1,048
1,055
1,065
ITC
248
250
252
253
255
KOTAKBANK
793
800
810
816
826
LT
1,445
1,460
1,471
1,486
1,497
LUPIN
1,508
1,520
1,535
1,547
1,561
M&M
1,390
1,401
1,417
1,427
1,443
MARUTI
5,305
5,334
5,360
5,389
5,414
NTPC
150
153
155
158
159
ONGC
241
245
249
252
256
POWERGRID
177
178
180
181
182
RELIANCE
1,030
1,037
1,048
1,056
1,066
SBIN
251
254
256
259
261
SUNPHARMA
762
771
783
793
805
TCS
2,271
2,300
2,339
2,367
2,406
TATAMTRDVR
340
349
356
365
371
TATAMOTORS
535
548
557
569
578
TATAPOWER
72
74
75
77
78
TATASTEEL
357
365
372
380
387
TECHM
459
463
468
472
477
ULTRACEMCO
3,783
3,864
3,914
3,995
4,046
WIPRO
471
474
480
483
489
YESBANK
1,184
1,219
1,238
1,273
1,292
ZEEL
502
510
516
524
529
4
Technical & Derivatives Report
September 15, 2016
Research Team Tel: 022 - 39357800
For Technical Queries
For Derivatives Queries
DISCLAIMER
Angel Broking Private Limited (hereinafter referred to as “Angel”) is a registered Member of National Stock Exchange of India Limited,
Bombay Stock Exchange Limited and Metropolitan Stock Exchange Limited. It is also registered as a Depository Participant with CDSL
and Portfolio Manager with SEBI. It also has registration with AMFI as a Mutual Fund Distributor. Angel Broking Private Limited is a
registered entity with SEBI for Research Analyst in terms of SEBI (Research Analyst) Regulations, 2014 vide registration number
INH000000164. Angel or its associates has not been debarred/ suspended by SEBI or any other regulatory authority for accessing
/dealing in securities Market. Angel or its associates/analyst has not received any compensation / managed or co-managed public
offering of securities of the company covered by Analyst during the past twelve months.
This document is solely for the personal information of the recipient, and must not be singularly used as the basis of any investment
decision. Nothing in this document should be construed as investment or financial advice. Each recipient of this document should
make such investigations as they deem necessary to arrive at an independent evaluation of an investment in the securities of the
companies referred to in this document (including the merits and risks involved), and should consult their own advisors to determine
the merits and risks of such an investment.
Reports based on technical and derivative analysis center on studying charts of a stock's price movement, outstanding positions and
trading volume, as opposed to focusing on a company's fundamentals and, as such, may not match with a report on a company's
fundamentals. Investors are advised to refer the Fundamental and Technical Research Reports available on our website to evaluate the
contrary view, if any.
The information in this document has been printed on the basis of publicly available information, internal data and other reliable
sources believed to be true, but we do not represent that it is accurate or complete and it should not be relied on as such, as this
document is for general guidance only. Angel Broking Pvt. Limited or any of its affiliates/ group companies shall not be in any way
responsible for any loss or damage that may arise to any person from any inadvertent error in the information contained in this report.
Angel Broking Pvt. Limited has not independently verified all the information contained within this document. Accordingly, we cannot
testify, nor make any representation or warranty, express or implied, to the accuracy, contents or data contained within this document.
While Angel Broking Pvt. Limited endeavors to update on a reasonable basis the information discussed in this material, there may be
regulatory, compliance, or other reasons that prevent us from doing so.
This document is being supplied to you solely for your information, and its contents, information or data may not be reproduced,
redistributed or passed on, directly or indirectly.
Neither Angel Broking Pvt. Limited, nor its directors, employees or affiliates shall be liable for any loss or damage that may arise from
or in connection with the use of this information.
5