Technical & Derivatives Report
June 15, 2016
Sensex (26396) / Nifty (8109)
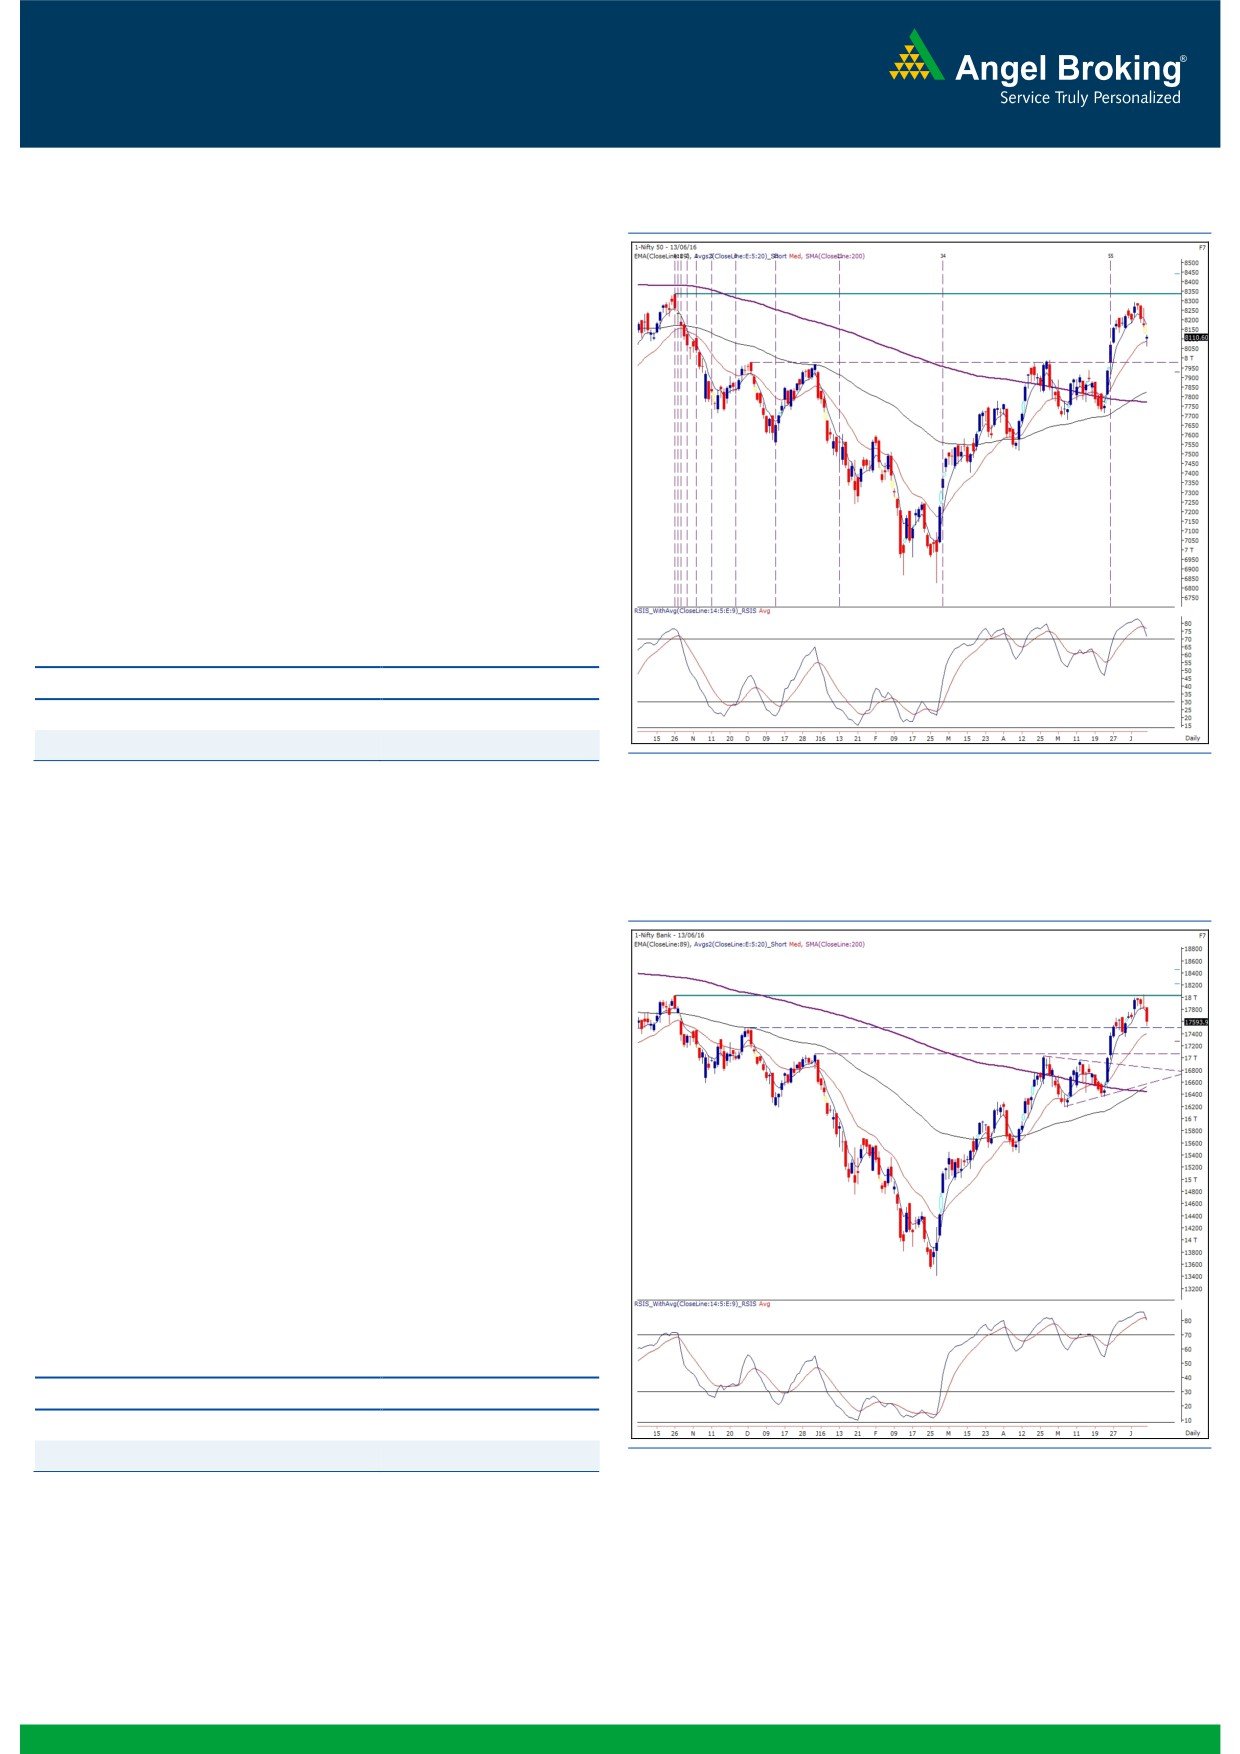
Exhibit 1: Nifty Daily Chart
Our markets opened on a flat note considering mixed cues from
Asian bourses. Subsequently, we witnessed an intraday deep well
below the 8100 mark. However, once again we saw a modest
recovery in the latter half to close with very negligible loss.
If we look at the daily chart, we can clearly see a sheet anchor
support of couple of technical tools which are placed around
8080 - 8060 levels. Thus, we maintain our positive stance on the
market and do not expect any major correction from current
levels. The hourly chart now depicts a positive crossover of the
'RSI-Smoothened' well inside the oversold territory. Thus, in the
forthcoming session, if the Nifty manages to surpass the
'Parabolic SAR' placed around 8121, then we may see a good
intraday rally towards 8180 - 8210 levels.
Key Levels
Support 1 - 8080
Resistance 1 - 8180
Support 2 - 8060
Resistance 2 - 8210
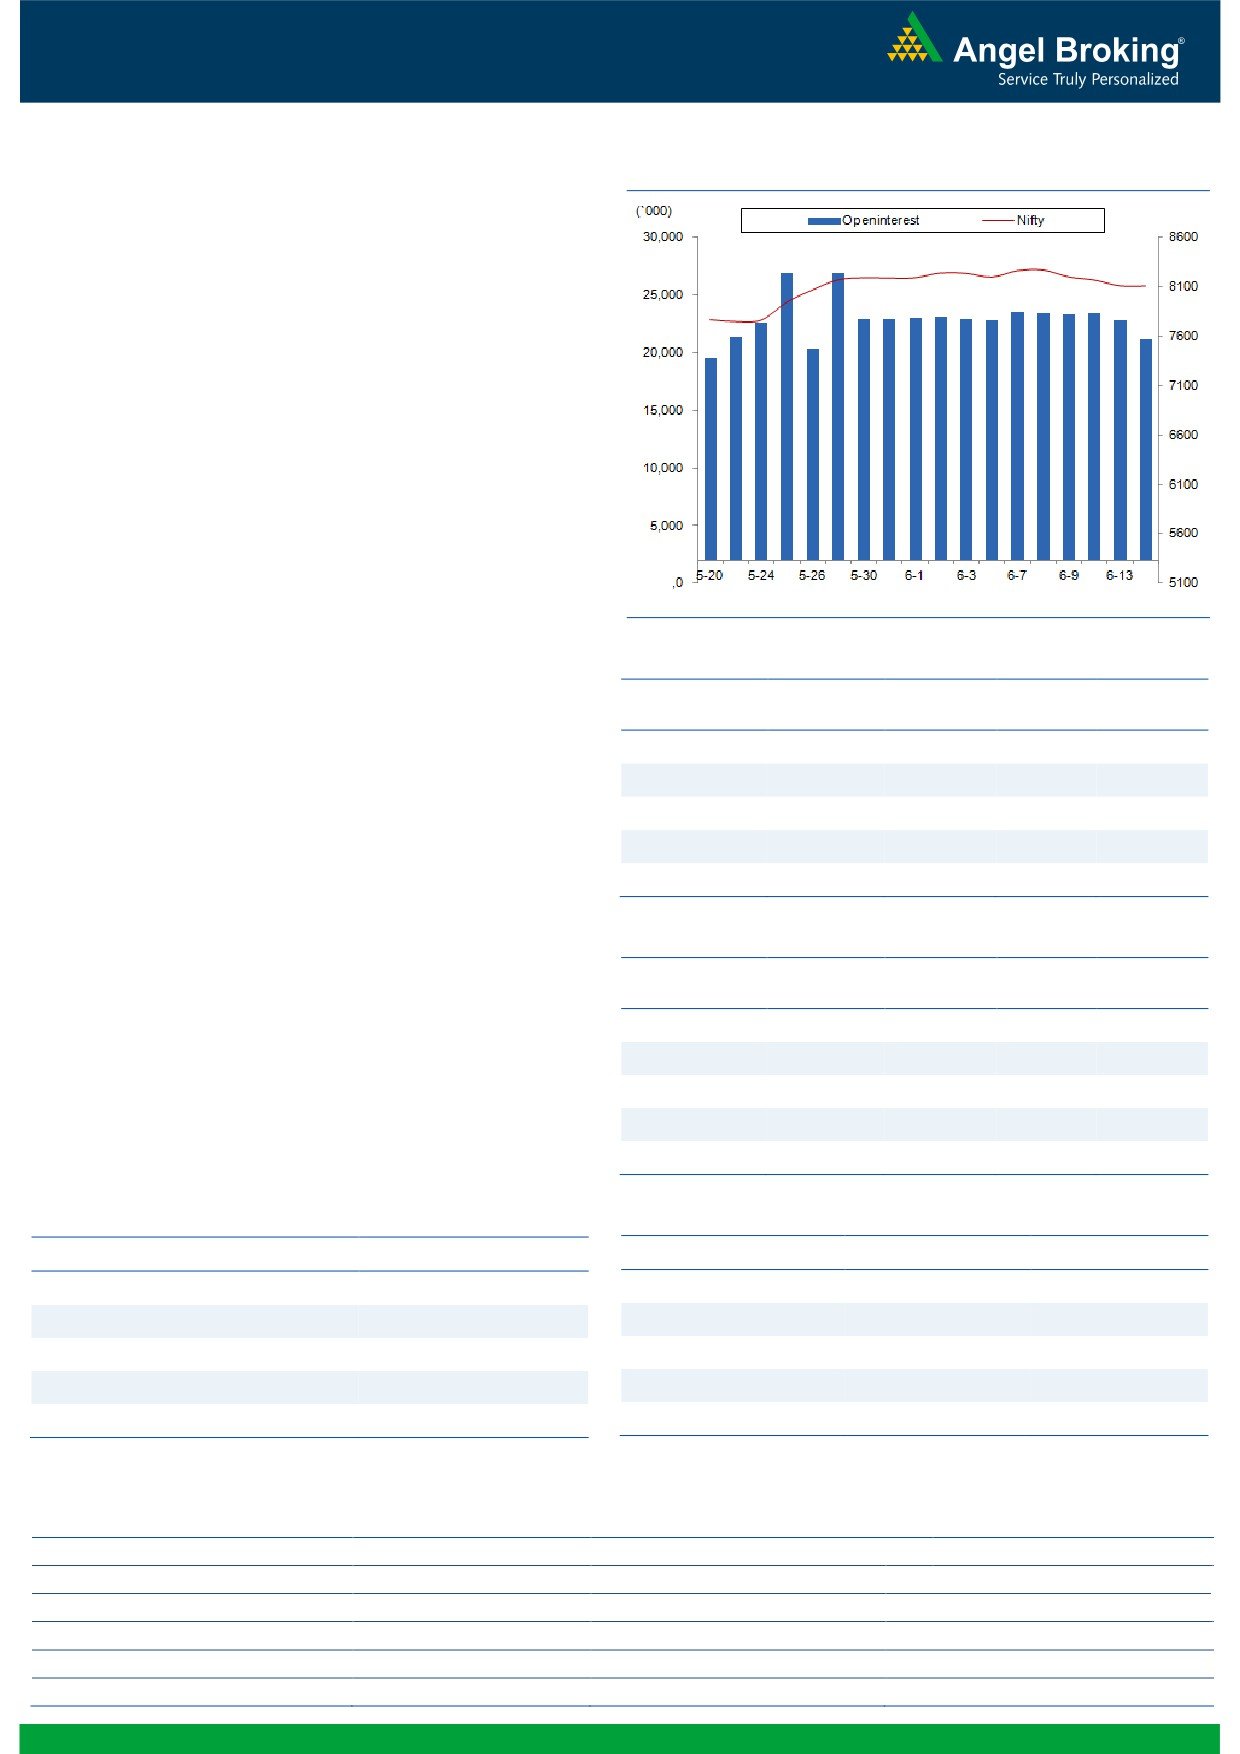
Exhibit 2: Nifty Bank Daily Chart
Nifty Bank Outlook - (17672)
The index traded in a narrow range yesterday and ended the
session with minor gains of
0.45 percent over its previous
session’s close.
Yesterday's trading session was clearly dominated by the PSU
banking stocks wherein the PSU Bank index outperformed other
indices and gained 3.16%. However, the private sector banking
stocks, which contributes heavily in the Nifty Bank index, traded in
a narrow range and hence, we could not see directional
momentum in the index. Hence, we continue to advise traders to
stay light on positions in the index and focus on stock specific
trades with proper risk management. The intraday support for the
index is placed at 17520 and 17350; whereas, resistance is seen
in the range of 17800 - 17900.
Key Levels
Support 1 - 17520
Resistance 1 - 17800
Support 2 - 17350
Resistance 2 - 17900
1
Technical & Derivatives Report
June 15, 2016
Comments
Nifty Vs OI
The Nifty futures open interest has decreased by 7.02%
BankNifty futures open interest has decreased by 1.16%
as market closed at 8108.85 levels.
The Nifty June future closed with a premium of 11.70
points against a premium of 20.05 points in previous
session. The July series closed at a premium of 40.10
points.
The Implied Volatility of at the money options has
increased from 15.59% to 16.34%.
The total OI of the market is Rs. 2,36,430/- cr. and the
stock futures OI is Rs. 67,084/- cr.
Few of the liquid counters where we have seen high cost
of carry are ANDHRABANK, PTC, JINDALSTEL,
PIDILITIND and NCC.
Views
OI Gainers
FIIs were net sellers in both cash market segment and in
OI
PRICE
SCRIP
OI
PRICE
Index Futures. They sold equities to the tune of
CHG. (%)
CHG. (%)
Rs. 113 crores. While in Index Futures, they sold worth
IGL
2183500
39.30
615.10
5.31
Rs. 1881 crores with good amount of decline in open
HEROMOTOCO
1189400
11.08
3019.15
-0.93
interest, indicating long unwinding in last trading session.
SAIL
51918000
10.42
45.10
3.56
On Index Options front, FIIs bought of Rs. 404 crores
CEATLTD
2891700
7.94
876.55
-0.34
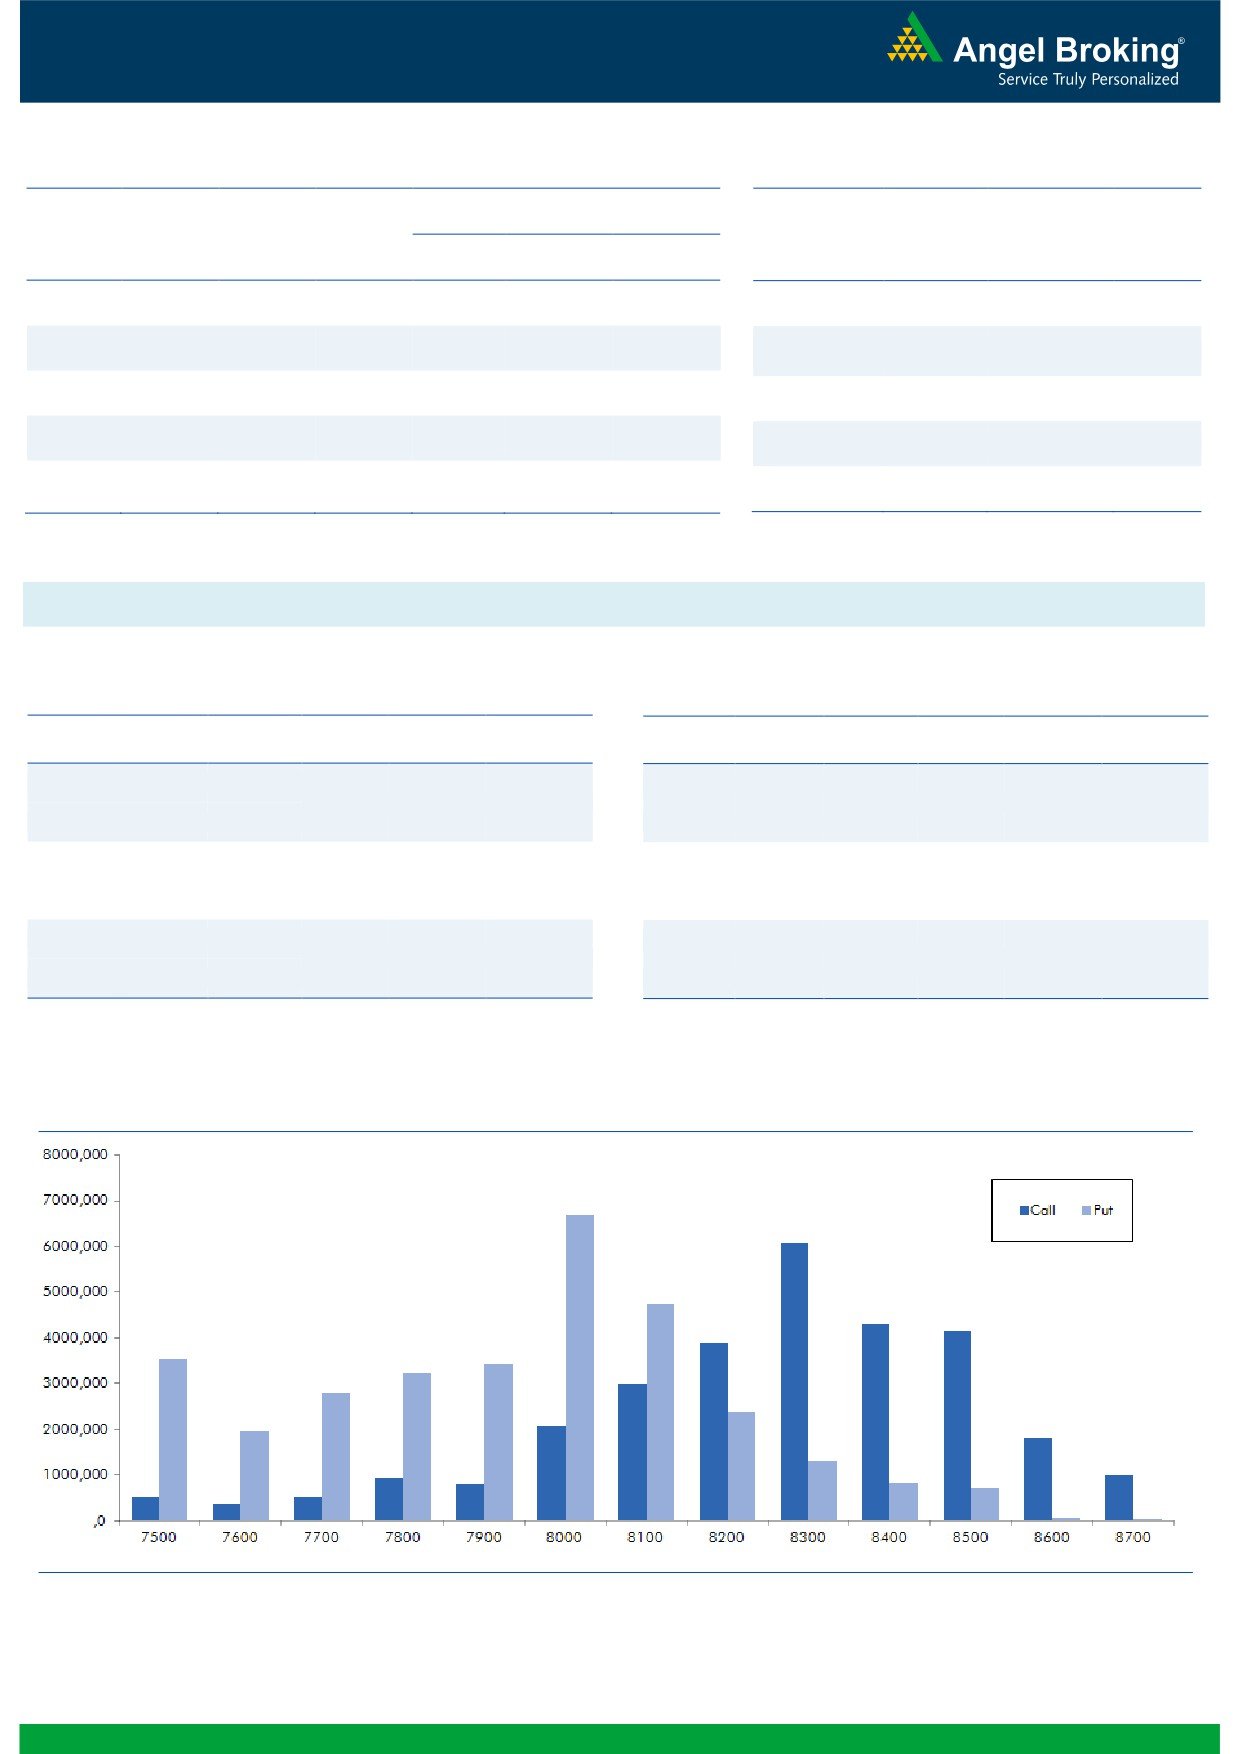
with rise in open interest. In call options,w8300 strikeng.com
PNB
34188000
7.36
88.75
7.71
added some build-up and we believe it’s writing which
took place. While in put options, we hardly saw any
OI Losers
meaningful OI additions, some unwinding was visible in
OI
PRICE
8000-8100 strike prices. Maximum open interest in June
SCRIP
OI
PRICE
CHG. (%)
CHG. (%)
series is visible in 8300 call and 8000 put options. From
INDIACEM
29673000
-8.08
99.00
-1.15
last 2-3 trading session, Nifty remained under pressure;
JPASSOCIAT
210592000
-6.89
7.95
15.22
but, we hardly saw any short formation. 8000 levels is an
CANBK
15854000
-5.40
190.40
2.59
important support zone for Nifty, one should avoid
CIPLA
13734000
-5.28
483.55
2.74
shorting this market till we see any relevant change in
statistic.
APOLLOTYRE
8487000
-5.16
151.95
2.29
Historical Volatility
Put-Call Ratio
SCRIP
HV
SCRIP
PCR-OI
PCR-VOL
IGL
32.57
NIFTY
1.09
0.96
JPASSOCIAT
102.47
BANKNIFTY
0.96
0.95
PNB
54.74
SBIN
0.88
0.62
ADANIENT
60.79
RELIANCE
0.56
0.33
IDBI
46.49
SUNPHARMA
0.37
0.22
Strategy Date
Symbol
Strategy
Status
May 30, 2016
TCS
Ratio Bull Call Spread
Active
June 06, 2016
NIFTY
Long Call
Exited at Cost
June 13, 2016
ONGC
Ratio Bull Call Spread
Active
2
Technical & Derivatives Report
June 15, 2016
FII Statistics for 14-June 2016
Turnover on 14-June 2016
Open Interest
No. of
Turnover
Change
Detail
Buy
Sell
Net
Instrument
Value
Contracts
( in Cr. )
(%)
Contracts
Change (%)
(in Cr.)
INDEX
INDEX
1601.03
3481.97
(1880.95)
250805
15019.96
(11.32)
281982
15015.96
-8.31
FUTURES
FUTURES
INDEX
INDEX
19596.08
19192.24
403.83
1062895
64017.11
1.61
2924781
150600.05
-13.31
OPTIONS
OPTIONS
STOCK
3944.34
4118.60
(174.27)
1072923
52820.11
0.78
STOCK
FUTURES
491511
23478.03
-7.00
FUTURES
STOCK
STOCK
2202.31
2188.84
13.47
101042
5197.80
3.97
OPTIONS
293532
13029.50
-15.53
OPTIONS
TOTAL
27343.75
28981.66
(1637.91)
2487665
137054.99
(0.12)
TOTAL
3991806
202123.54
-12.42
Nifty Spot = 8108.85
Lot Size = 75
Bull-Call Spreads
Bear-Put Spreads
Action
Strike
Price
Risk
Reward
BEP
Action
Strike
Price
Risk
Reward
BEP
Buy
8100
120.55
Buy
8100
100.75
48.15
51.85
8148.15
34.50
65.50
8065.50
Sell
8200
72.40
Sell
8000
66.25
Buy
8100
120.55
Buy
8100
100.75
81.15
118.85
8181.15
57.60
142.40
8042.40
Sell
8300
39.40
Sell
7900
43.15
Buy
8200
72.40
Buy
8000
66.25
33.00
67.00
8233.00
23.10
76.90
7976.90
Sell
8300
39.40
Sell
7900
43.15
Note: Above mentioned Bullish or Bearish Spreads in Nifty (June Series) are given as an information and not as a recommendation.
Nifty Put-Call Analysis
3
Technical & Derivatives Report
June 15, 2016
Daily Pivot Levels for Nifty Constituents
Scrips
S2
S1
PIVOT
R1
R2
ACC
1,526
1,533
1,543
1,550
1,560
ADANIPORTS
199
204
207
212
215
AMBUJACEM
231
232
235
237
240
ASIANPAINT
968
977
988
997
1,008
AUROPHARMA
740
745
751
756
762
AXISBANK
520
525
530
535
541
BAJAJ-AUTO
2,530
2,545
2,566
2,581
2,602
BANKBARODA
146
148
149
150
151
BHEL
120
121
121
122
123
BPCL
970
981
999
1,009
1,028
BHARTIARTL
334
339
342
346
349
INFRATEL
374
378
381
385
388
BOSCH
21,187
21,504
21,717
22,034
22,247
CIPLA
464
474
479
488
493
COALINDIA
305
307
309
311
312
DRREDDY
3,066
3,082
3,096
3,111
3,125
EICHERMOT
18,178
18,466
18,638
18,926
19,098
GAIL
367
370
374
377
381
GRASIM
4,222
4,247
4,280
4,305
4,338
HCLTECH
733
743
754
764
775
HDFCBANK
1,138
1,145
1,151
1,158
1,164
HDFC
1,178
1,188
1,199
1,209
1,219
HEROMOTOCO
2,972
2,989
3,014
3,031
3,057
HINDALCO
113
115
115
116
117
HINDUNILVR
852
859
867
874
882
ICICIBANK
242
244
246
247
249
IDEA
98
99
100
101
102
INDUSINDBK
1,092
1,104
1,112
1,125
1,132
INFY
1,160
1,167
1,175
1,183
1,190
ITC
346
349
352
356
358
KOTAKBANK
744
748
753
757
763
LT
1,445
1,453
1,463
1,471
1,481
LUPIN
1,436
1,443
1,453
1,460
1,470
M&M
1,339
1,348
1,357
1,365
1,375
MARUTI
4,059
4,082
4,119
4,142
4,179
NTPC
146
147
148
149
150
ONGC
209
211
213
215
217
POWERGRID
149
150
151
152
153
RELIANCE
961
969
977
985
993
SBIN
202
205
207
210
212
SUNPHARMA
743
749
752
757
760
TCS
2,497
2,516
2,537
2,556
2,578
TATAMTRDVR
299
302
304
307
310
TATAMOTORS
435
442
448
454
461
TATAPOWER
74
75
75
76
77
TATASTEEL
318
322
325
328
331
TECHM
524
529
533
538
542
ULTRACEMCO
3,250
3,286
3,347
3,383
3,444
WIPRO
538
541
542
545
546
YESBANK
1,050
1,058
1,065
1,072
1,079
ZEEL
445
450
458
464
472
4
Technical & Derivatives Report
June 15, 2016
Research Team Tel: 022 - 39357800
For Technical Queries
For Derivatives Queries
DISCLAIMER
Angel Broking Private Limited (hereinafter referred to as “Angel”) is a registered Member of National Stock Exchange of India Limited,
Bombay Stock Exchange Limited and MCX Stock Exchange Limited. It is also registered as a Depository Participant with CDSL and
Portfolio Manager with SEBI. It also has registration with AMFI as a Mutual Fund Distributor. Angel Broking Private Limited is a
registered entity with SEBI for Research Analyst in terms of SEBI (Research Analyst) Regulations, 2014 vide registration number
INH000000164. Angel or its associates has not been debarred/ suspended by SEBI or any other regulatory authority for accessing
/dealing in securities Market. Angel or its associates including its relatives/analyst do not hold any financial interest/beneficial
ownership of more than 1% in the company covered by Analyst. Angel or its associates/analyst has not received any compensation /
managed or co-managed public offering of securities of the company covered by Analyst during the past twelve months. Angel/analyst
has not served as an officer, director or employee of company covered by Analyst and has not been engaged in market making activity
of the company covered by Analyst.
This document is solely for the personal information of the recipient, and must not be singularly used as the basis of any investment
decision. Nothing in this document should be construed as investment or financial advice. Each recipient of this document should
make such investigations as they deem necessary to arrive at an independent evaluation of an investment in the securities of the
companies referred to in this document (including the merits and risks involved), and should consult their own advisors to determine
the merits and risks of such an investment.
Reports based on technical and derivative analysis center on studying charts of a stock's price movement, outstanding positions and
trading volume, as opposed to focusing on a company's fundamentals and, as such, may not match with a report on a company's
fundamentals.
The information in this document has been printed on the basis of publicly available information, internal data and other reliable
sources believed to be true, but we do not represent that it is accurate or complete and it should not be relied on as such, as this
document is for general guidance only. Angel Broking Pvt. Limited or any of its affiliates/ group companies shall not be in any way
responsible for any loss or damage that may arise to any person from any inadvertent error in the information contained in this report.
Angel Broking Pvt. Limited has not independently verified all the information contained within this document. Accordingly, we cannot
testify, nor make any representation or warranty, express or implied, to the accuracy, contents or data contained within this document.
While Angel Broking Pvt. Limited endeavors to update on a reasonable basis the information discussed in this material, there may be
regulatory, compliance, or other reasons that prevent us from doing so.
This document is being supplied to you solely for your information, and its contents, information or data may not be reproduced,
redistributed or passed on, directly or indirectly.
Neither Angel Broking Pvt. Limited, nor its directors, employees or affiliates shall be liable for any loss or damage that may arise from
or in connection with the use of this information.
Note: Please refer to the important ‘Stock Holding Disclosure' report on the Angel website (Research Section). Also, please refer to the
latest update on respective stocks for the disclosure status in respect of those stocks. Angel Broking Pvt. Limited and its affiliates may
have investment positions in the stocks recommended in this report.
5