Technical & Derivatives Report
February 15, 2016
Sensex (22986) / Nifty (6981)
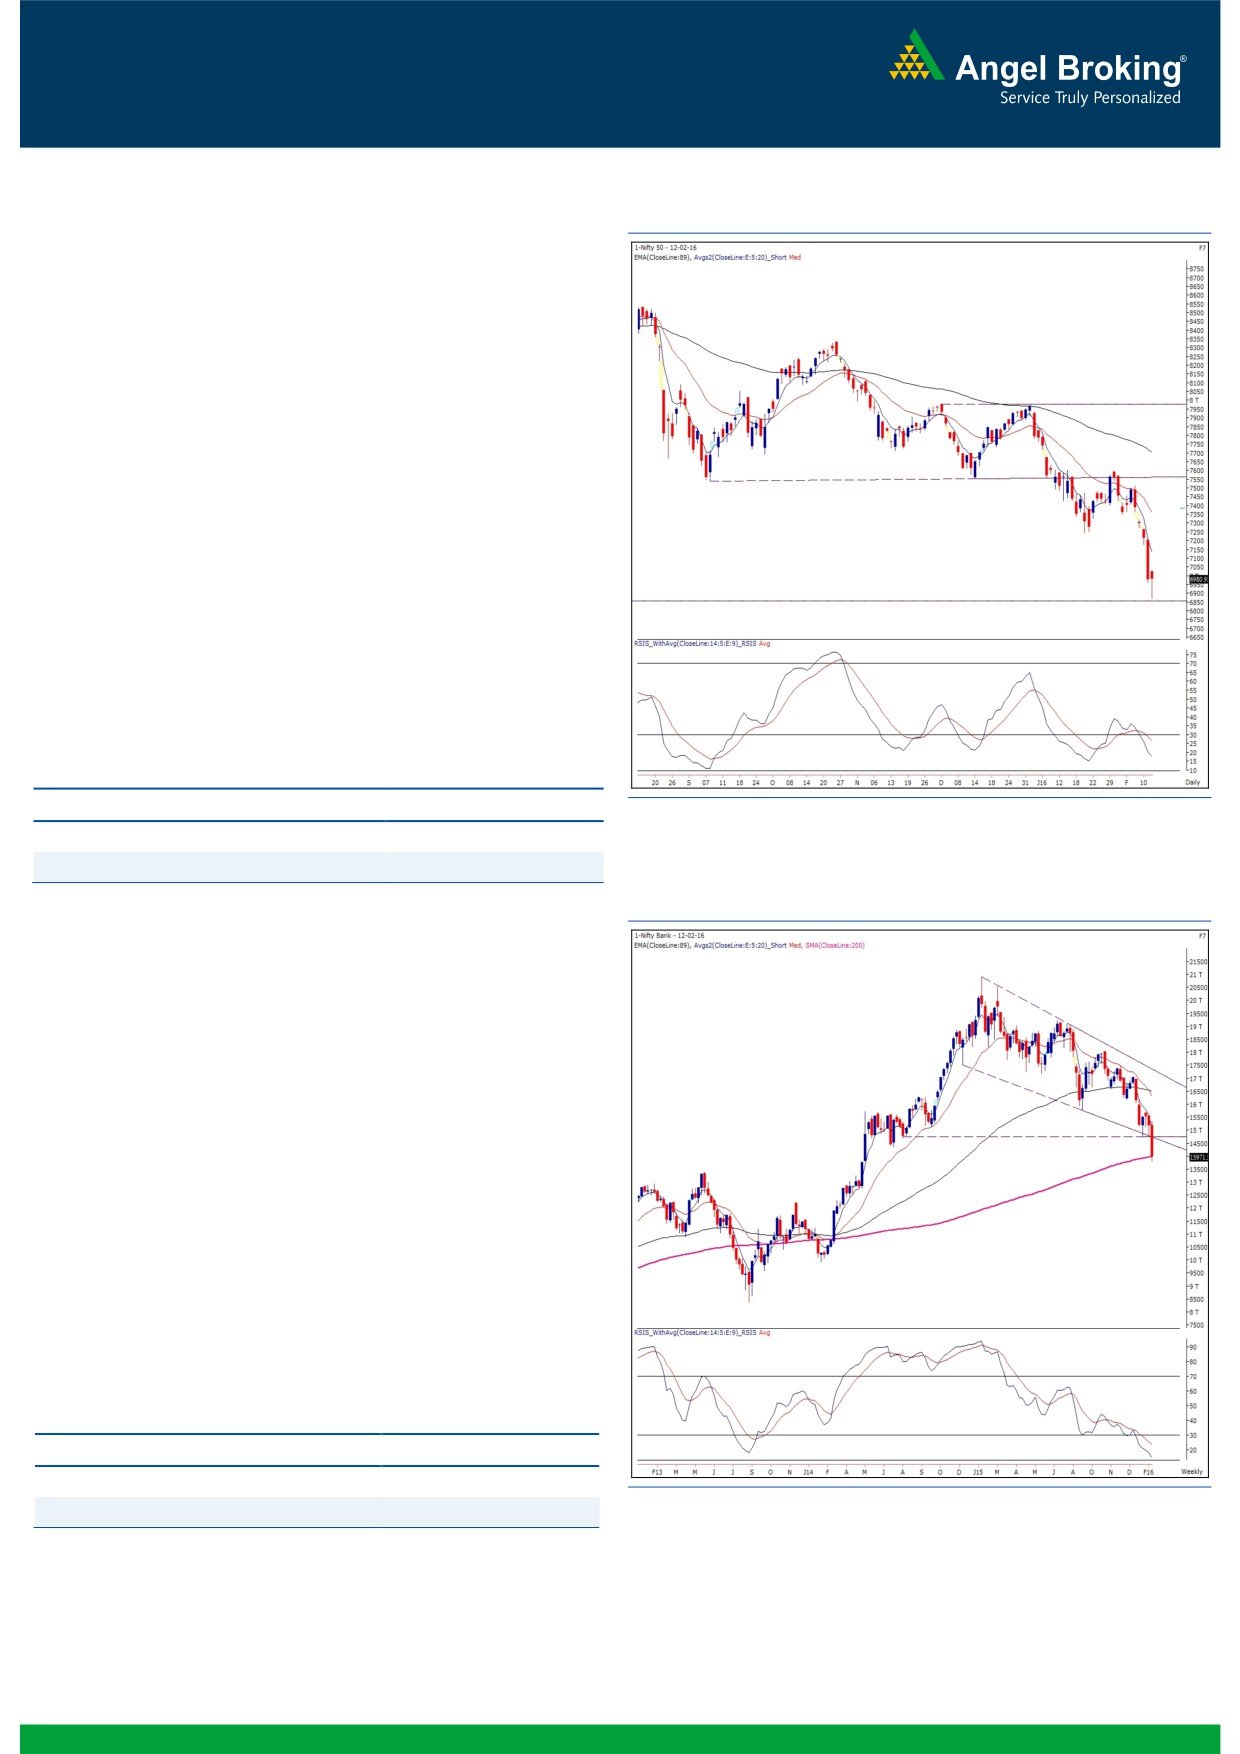
Exhibit 1: Nifty Daily Chart
The week gone was a dreadful week for the equity markets across
the globe. Although, we are now seeing a strong support zone on
the monthly chart, it won't be fair to keep discussing support levels
which are getting brutally thrashed one after another. Going
forward, 6870 (April 25, 2014 high as well as the Weekly ‘200
SMA’ level) and 6790 (50% retracement level of the large up
move from 4531.15 to 9119.20 and ’20 EMA’ on the quarterly
chart) levels should render strong support to the Nifty. On the
smaller (daily) degree chart, Friday’s candle can be termed as a
‘Bullish Hammer’ pattern. A move beyond the high of 7035 may
lead to some immediate bounce back towards 7090 - 7150
levels. Although the Nifty is very near to its strong supports,
considering the current scenario, we would rather wait for a
reversal sign on the weekly chart or a ‘Higher Top - Higher
Bottom’ structure on the daily chart to expect a strong bounce
from the current level. Traders are advised to stay light on
positions and keep monitoring above mentioned key levels.
Key Levels
Support 1 - 6870
Resistance 1 - 7090
Support 2 - 6790
Resistance 2 -
7150
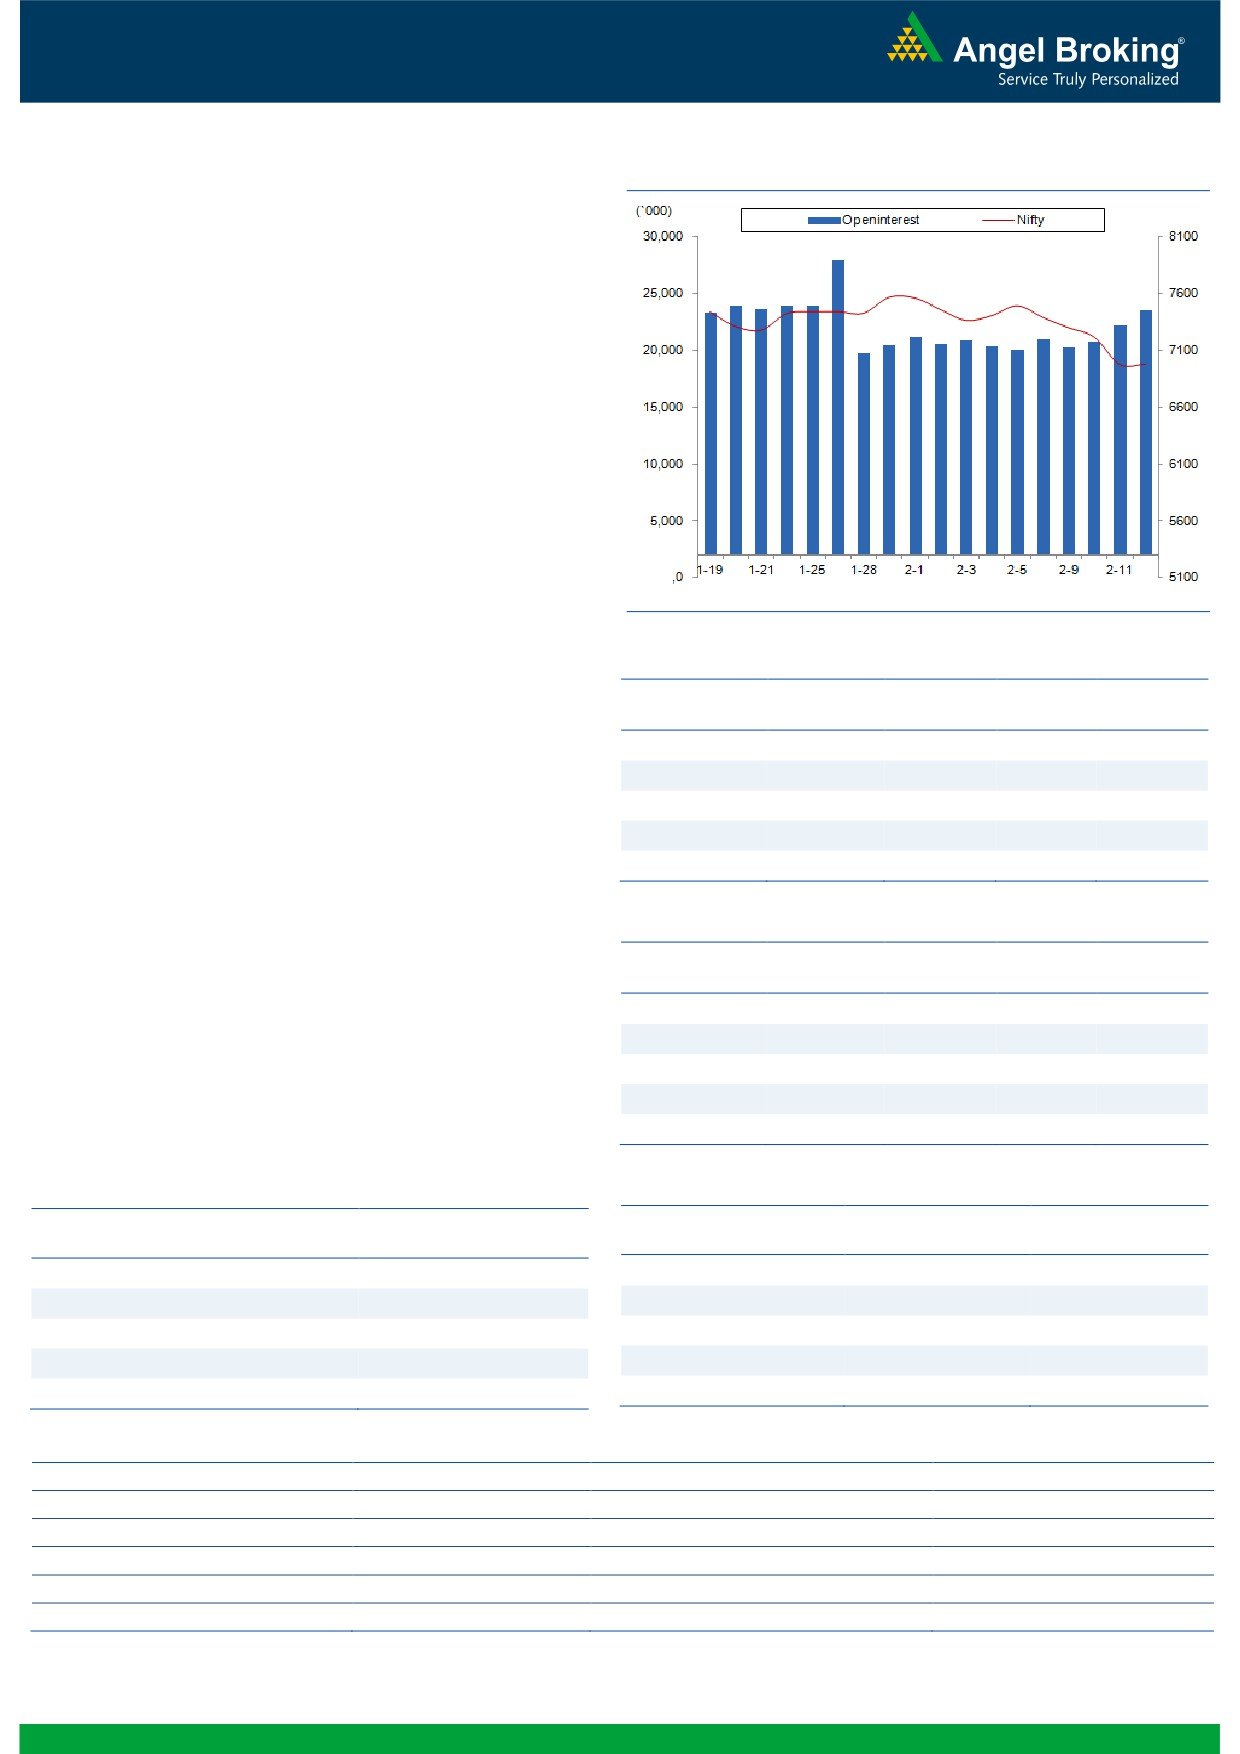
Exhibit 2: Bank Nifty Daily Chart
Bank Nifty Outlook - (13972)
The Nifty Bank index opened with marginal gains on Friday
and started correcting from initial trades. The banking index
corrected by around 2 percent from the opening levels and as
a result, somehow it looks like a follow-up selling of the drastic
damage of Thursday’s session. However, the responsive
buyers were active at lower levels and pulled the index to
make a new intraday high in the later half of the session.
Eventually, the Nifty Bank index ended the session with the loss
of 0.41 percent over its previous close. On week on week
basis, the banking index has seen a deep cut of 7.85 percent.
At current juncture, the Nifty Bank index is hovering around its
support of ‘200 SMA’ in the weekly chart; but, we would like to
wait for some reversal signals to get developed. Going
forward, immediate support for the Nifty Bank index is placed
at 13680 and 13500 levels; while, resistance is seen at 14240
- 14370 levels.
Key Levels
Support 1 - 13680
Resistance 1 - 14240
Support 2 - 13500
Resistance 2 - 14370
1
Technical & Derivatives Report
February 15, 2016
Comments
Nifty Vs OI
The Nifty futures open interest has increased by 5.64%
BankNifty futures open interest has decreased by 4.48%
as market closed at 6980.95 levels.
The Nifty February future closed at a premium of 9.05
points against a premium of 17.10 points. The March
series closed at a premium of 27.95 points.
The Implied Volatility of at the money options has
decreased from 25.00% to 20.97%.
The total OI of the market is Rs. 2,35,101/- cr. and the
stock futures OI is Rs. 56,213/- cr.
Few of the liquid counters where we have seen high cost
of carry are JPASSOCIAT, INFRATEL, UBL, IBULHSGFIN
and VEDL.
Views
FIIs were net sellers in cash market segment to the tune
OI Gainers
of Rs. 398 crores. While in Index Futures, they bought of
OI
PRICE
SCRIP
OI
PRICE
Rs. 883 crores with good amount of rise in open interest
CHG. (%)
CHG. (%)
indicating fresh long formation in last trading session.
BHEL
28054000
13.86
104.35
-13.22
In Index Options front, they sold of Rs. 1144 crores with
IOB
18186000
13.45
20.50
-8.07
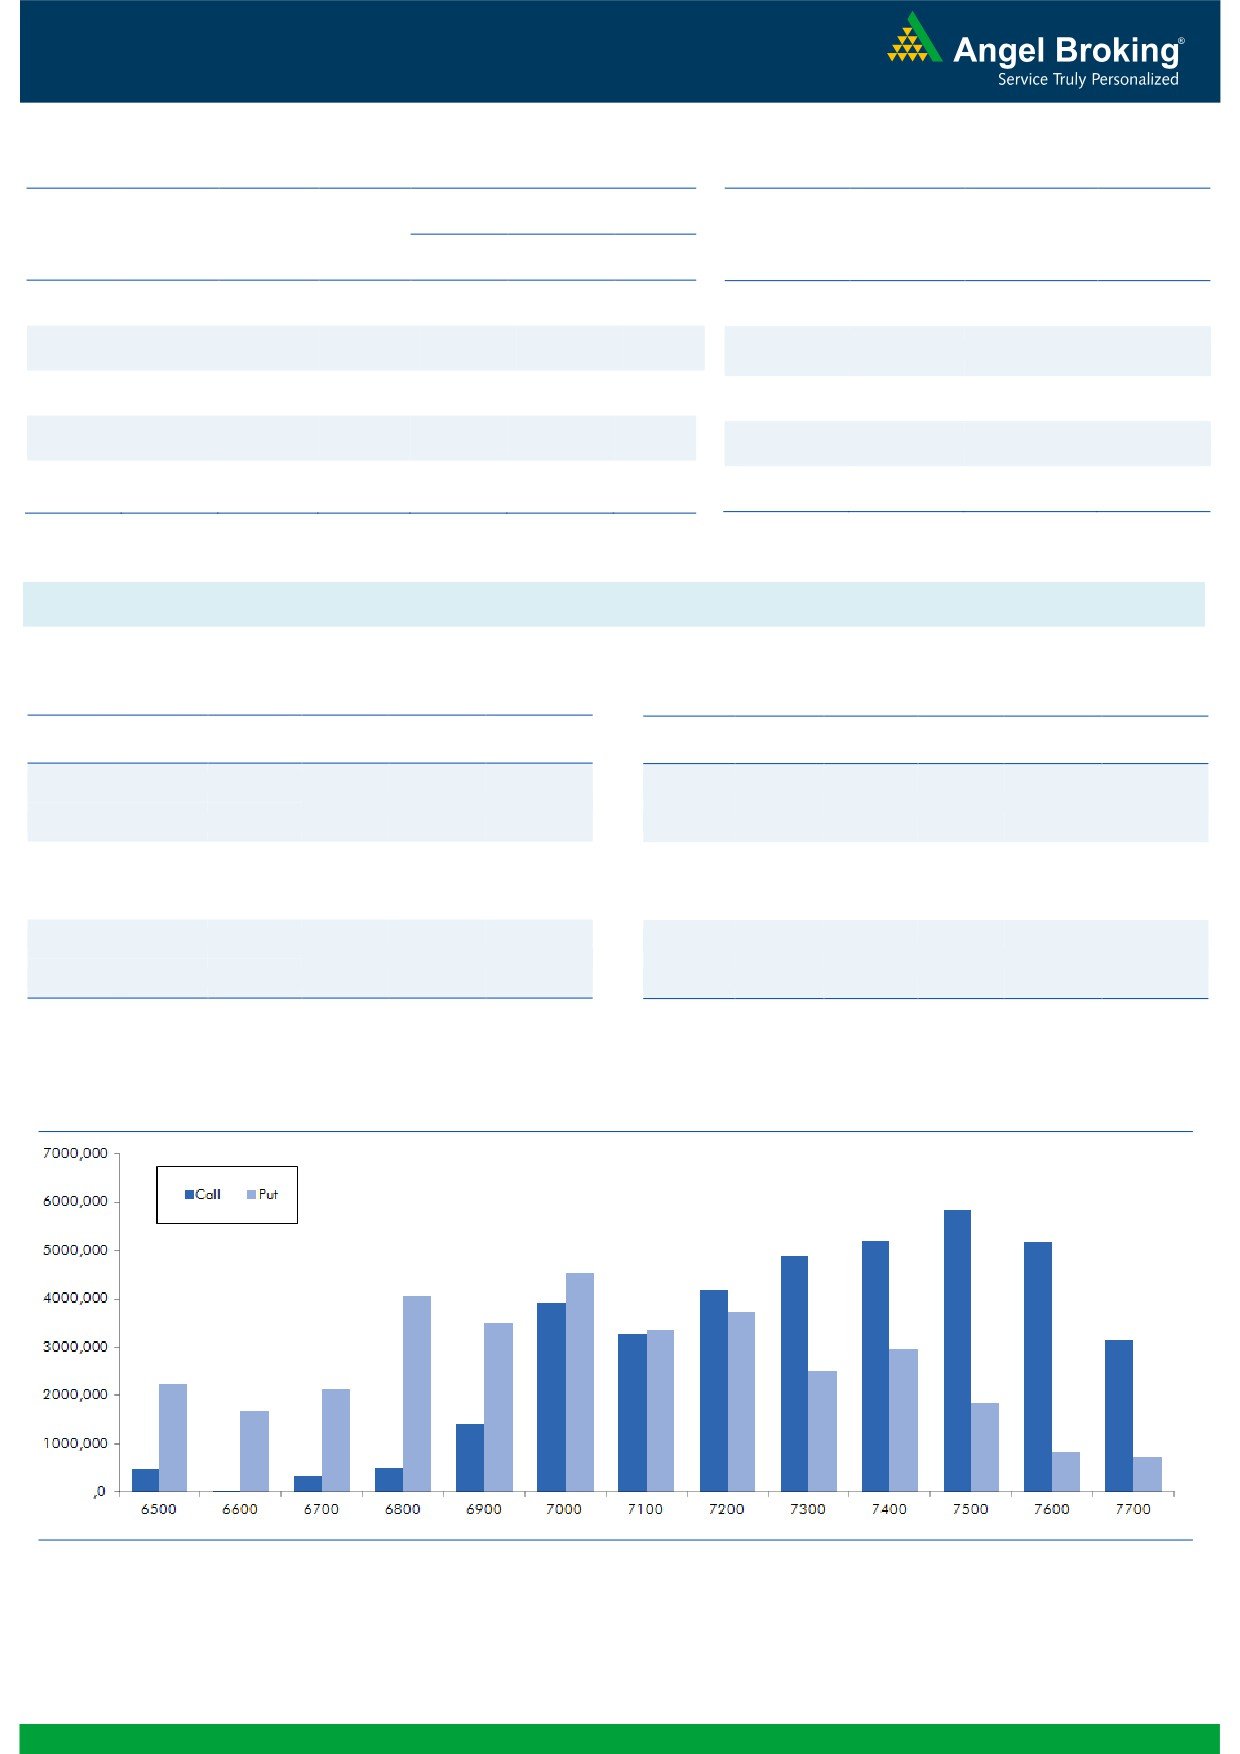
decent rise in OI. In call options, the build-up was quite
IBULHSGFIN
8396800
9.27
604.70
-1.72
scattered in the range of
6900-7300 strike. We
ADANIENT
15582000
8.98
64.50
-5.36
witnessed huge OI addition in 7000 call options and we
SKSMICRO
6879000
7.82
500.35
0.62
believe these may be long positions. While in put
options,
6800 and
7000 strikes added decent OI,
OI Losers
followed by unwinding in 7000-7300 strikes. Maximum
OI
PRICE
SCRIP
OI
PRICE
build-up is visible in 7500 call and 7000 put options.
CHG. (%)
CHG. (%)
Despite so much correction, FII have been buying in
ARVIND
3391500
-12.04
274.35
1.29
Index Futures, which is a positive sign. We don’t expect
WOCKPHARMA
2732250
-9.58
761.55
-13.04
any major downside front current levels.
TATAMOTORS
33775500
-8.00
298.45
7.70
PTC
7976000
-7.94
59.40
2.41
DLF
45600000
-7.55
80.70
-0.80
Historical Volatility
Put-Call Ratio
SCRIP
HV
SCRIP
PCR-OI
PCR-VOL
BHEL
86.30
NIFTY
0.78
0.68
BHARTIARTL
37.01
BANKNIFTY
0.63
0.67
BPCL
40.26
SBIN
0.51
0.50
IDEA
58.72
RELIANCE
0.39
0.53
WOCKPHARMA
109.71
ICICIBANK
0.46
0.45
Strategy Date
Symbol
Strategy
Status
February 01, 2016
BHEL
Bull Call Spread
Active
February 08, 2016
NIFTY
Short Strangle
Active
2
Technical & Derivatives Report
February 15, 2016
FII Statistics for 12-February 2016
Turnover on 12-February 2016
Open Interest
No. of
Turnover
Change
Detail
Buy
Sell
Net
Instrument
Value
Change
Contracts
( in Cr. )
(%)
Contracts
(in Cr.)
(%)
INDEX
INDEX
3388.84
2505.50
883.34
253931
12658.77
6.10
481279
23568.07
-2.15
FUTURES
FUTURES
INDEX
INDEX
49362.35
50507.04
(1144.69)
1401894
72189.82
2.75
5470286
287164.36
-0.43
OPTIONS
OPTIONS
STOCK
6388.39
6286.11
102.28
1175380
48214.60
1.35
STOCK
FUTURES
821434
32842.20
6.43
FUTURES
STOCK
STOCK
5023.23
5095.02
(71.79)
74828
3027.32
8.70
OPTIONS
535725
22337.29
-0.10
OPTIONS
TOTAL
64162.81
64393.67
(230.86)
2906033
136090.51
2.60
TOTAL
7308724
365911.91
0.05
Nifty Spot = 6980.95
Lot Size = 75
Bull-Call Spreads
Bear-Put Spreads
Action
Strike
Price
Risk
Reward
BEP
Action
Strike
Price
Risk
Reward
BEP
Buy
7000
101.40
Buy
7000
115.50
40.95
59.05
7040.95
40.90
59.10
6959.10
Sell
7100
60.45
Sell
6900
74.60
Buy
7000
101.40
Buy
7000
115.50
68.25
131.75
7068.25
69.00
131.00
6931.00
Sell
7200
33.15
Sell
6800
46.50
Buy
7100
60.45
Buy
6900
74.60
27.30
72.70
7127.30
28.10
71.90
6871.90
Sell
7200
33.15
Sell
6800
46.50
Note: Above mentioned Bullish or Bearish Spreads in Nifty (Feb. Series) are given as an information and not as a recommendation.
Nifty Put-Call Analysis
3
Technical & Derivatives Report
February 15, 2016
Daily Pivot Levels for Nifty 50 Stocks
Scrips
S2
S1
PIVOT
R1
R2
ACC
1,177
1,199
1,221
1,243
1,264
ADANIPORTS
158
168
179
189
201
AMBUJACEM
188
191
194
197
200
ASIANPAINT
831
843
858
870
885
AXISBANK
372
381
389
398
406
BAJAJ-AUTO
2,217
2,261
2,295
2,338
2,373
BANKBARODA
105
110
113
118
122
BHARTIARTL
298
311
321
334
343
BHEL
94
99
107
113
121
BOSCHLTD
15,331
15,640
16,045
16,353
16,759
BPCL
726
749
786
810
846
CAIRN
108
113
117
122
125
CIPLA
514
521
532
540
551
COALINDIA
294
299
305
309
315
DRREDDY
2,760
2,804
2,869
2,913
2,978
GAIL
305
315
325
335
345
GRASIM
3,293
3,339
3,370
3,416
3,447
HCLTECH
762
780
803
821
844
HDFC
1,053
1,068
1,083
1,098
1,113
HDFCBANK
954
963
975
983
995
HEROMOTOCO
2,409
2,449
2,493
2,534
2,578
HINDALCO
55
58
62
64
68
HINDUNILVR
786
800
808
821
830
ICICIBANK
186
190
194
198
202
IDEA
96
103
107
114
118
INDUSINDBK
783
797
815
829
846
INFY
1,048
1,066
1,085
1,104
1,123
ITC
295
298
301
304
308
KOTAKBANK
601
611
624
635
648
LT
971
1,012
1,057
1,099
1,144
LUPIN
1,679
1,718
1,764
1,802
1,849
M&M
1,058
1,111
1,145
1,199
1,232
MARUTI
3,406
3,478
3,533
3,605
3,660
NTPC
118
121
123
126
129
ONGC
181
187
194
200
206
PNB
70
72
74
76
79
POWERGRID
134
136
138
141
143
RELIANCE
864
885
910
931
955
SBIN
144
149
154
159
163
VEDL
55
59
62
66
69
SUNPHARMA
763
805
845
887
927
TATAMOTORS
259
279
291
311
324
TATAPOWER
54
55
57
58
59
TATASTEEL
201
209
219
228
238
TCS
2,132
2,179
2,211
2,259
2,291
TECHM
418
424
431
438
445
ULTRACEMCO
2,634
2,701
2,747
2,814
2,860
WIPRO
497
507
518
528
540
YESBANK
677
703
718
744
759
ZEEL
355
363
369
376
382
4
Technical & Derivatives Report
February 15, 2016
Research Team Tel: 022 - 39357800
For Technical Queries
For Derivatives Queries
DISCLAIMER
Angel Broking Private Limited (hereinafter referred to as “Angel”) is a registered Member of National Stock Exchange of India Limited,
Bombay Stock Exchange Limited and MCX Stock Exchange Limited. It is also registered as a Depository Participant with CDSL and
Portfolio Manager with SEBI. It also has registration with AMFI as a Mutual Fund Distributor. Angel Broking Private Limited is a
registered entity with SEBI for Research Analyst in terms of SEBI (Research Analyst) Regulations, 2014 vide registration number
INH000000164. Angel or its associates has not been debarred/ suspended by SEBI or any other regulatory authority for accessing
/dealing in securities Market. Angel or its associates including its relatives/analyst do not hold any financial interest/beneficial
ownership of more than 1% in the company covered by Analyst. Angel or its associates/analyst has not received any compensation /
managed or co-managed public offering of securities of the company covered by Analyst during the past twelve months. Angel/analyst
has not served as an officer, director or employee of company covered by Analyst and has not been engaged in market making activity
of the company covered by Analyst.
This document is solely for the personal information of the recipient, and must not be singularly used as the basis of any investment
decision. Nothing in this document should be construed as investment or financial advice. Each recipient of this document should
make such investigations as they deem necessary to arrive at an independent evaluation of an investment in the securities of the
companies referred to in this document (including the merits and risks involved), and should consult their own advisors to determine
the merits and risks of such an investment.
Reports based on technical and derivative analysis center on studying charts of a stock's price movement, outstanding positions and
trading volume, as opposed to focusing on a company's fundamentals and, as such, may not match with a report on a company's
fundamentals.
The information in this document has been printed on the basis of publicly available information, internal data and other reliable
sources believed to be true, but we do not represent that it is accurate or complete and it should not be relied on as such, as this
document is for general guidance only. Angel Broking Pvt. Limited or any of its affiliates/ group companies shall not be in any way
responsible for any loss or damage that may arise to any person from any inadvertent error in the information contained in this report.
Angel Broking Pvt. Limited has not independently verified all the information contained within this document. Accordingly, we cannot
testify, nor make any representation or warranty, express or implied, to the accuracy, contents or data contained within this document.
While Angel Broking Pvt. Limited endeavors to update on a reasonable basis the information discussed in this material, there may be
regulatory, compliance, or other reasons that prevent us from doing so.
This document is being supplied to you solely for your information, and its contents, information or data may not be reproduced,
redistributed or passed on, directly or indirectly.
Neither Angel Broking Pvt. Limited, nor its directors, employees or affiliates shall be liable for any loss or damage that may arise from
or in connection with the use of this information.
Note: Please refer to the important ‘Stock Holding Disclosure' report on the Angel website (Research Section). Also, please refer to the
latest update on respective stocks for the disclosure status in respect of those stocks. Angel Broking Pvt. Limited and its affiliates may
have investment positions in the stocks recommended in this report.
5