Technical & Derivatives Report
July 14, 2016
Sensex (27815) / Nifty (8520)
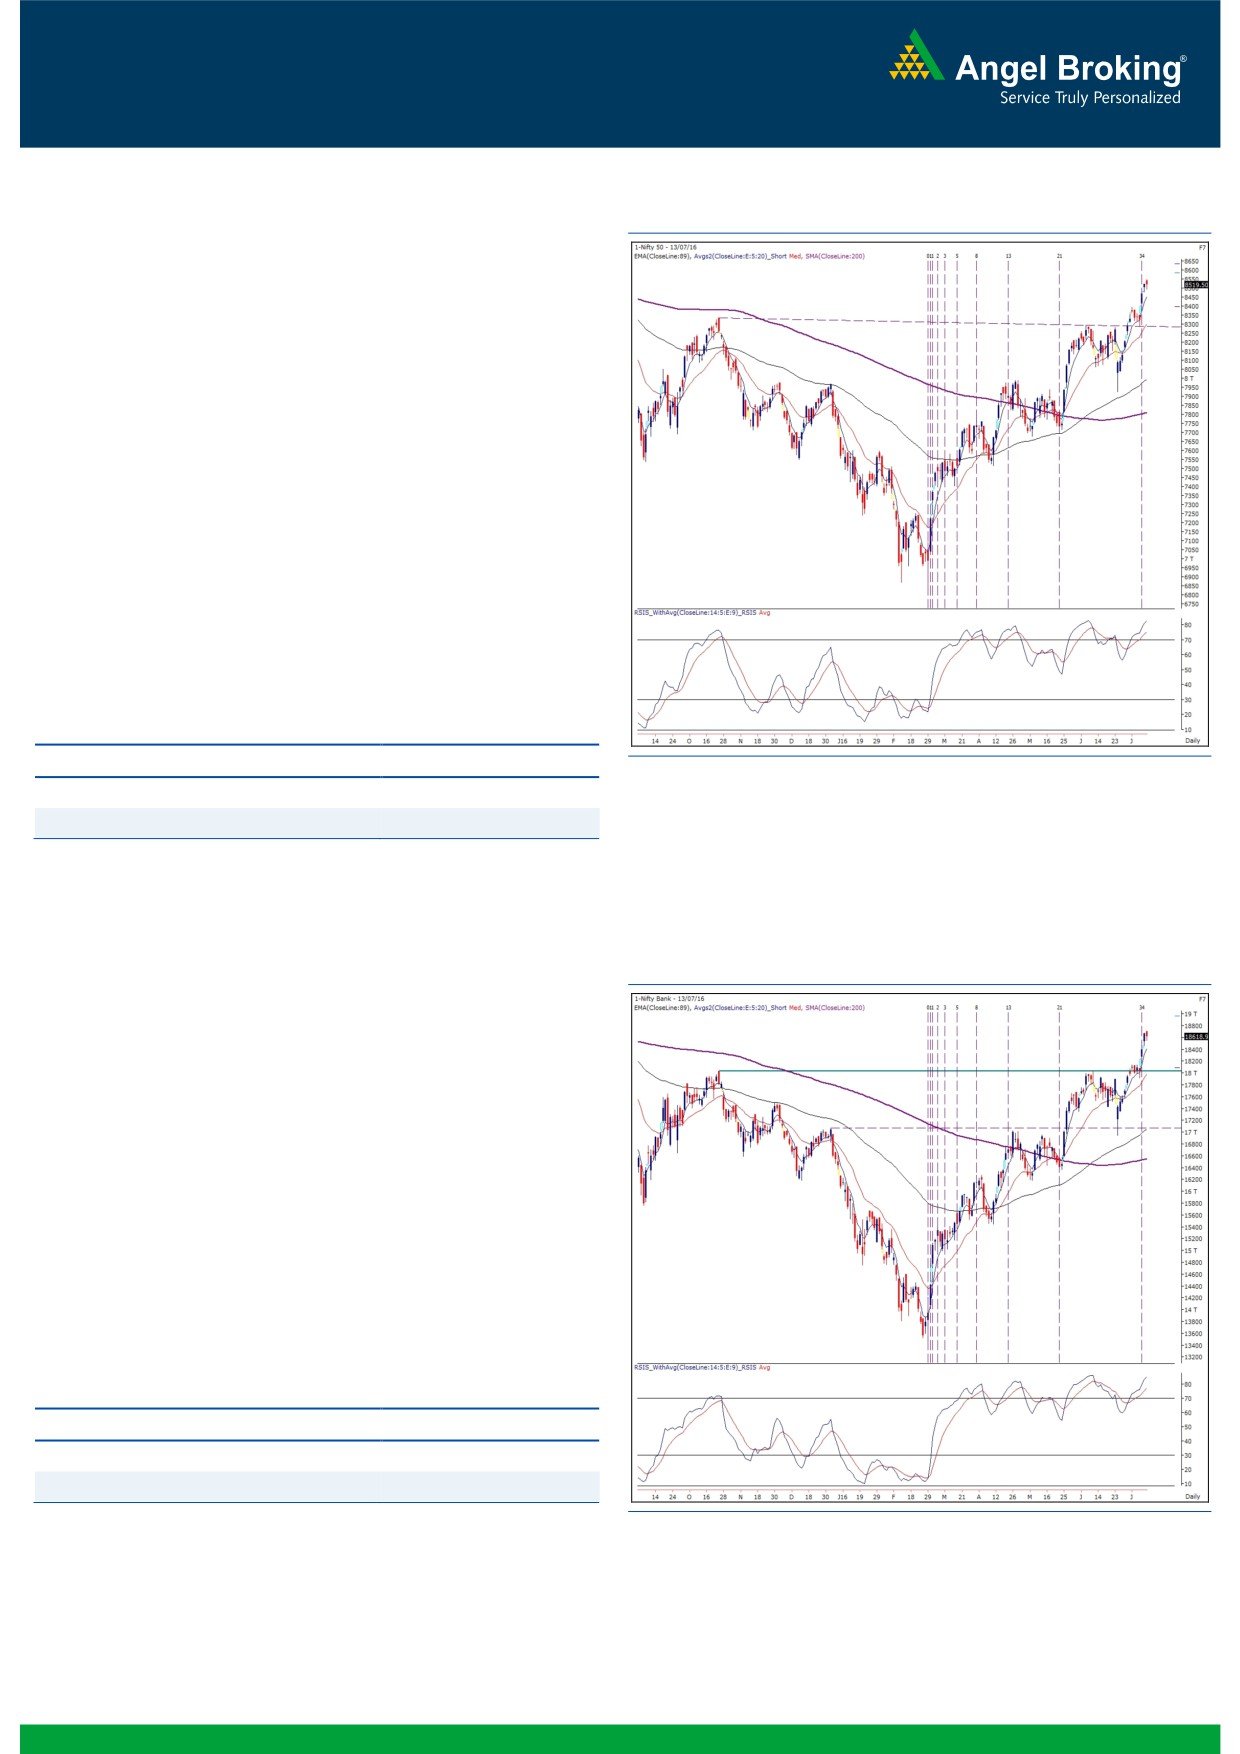
Exhibit 1: Nifty Daily Chart
Yesterday’s session opened tad higher owing to positive cues
from the Asian peers. Subsequently, we witnessed a range bound
session within very narrow band to conclude on a flat note.
It was clearly a day of consolidation after witnessing a spectacular
rally of 200 points in two days and more importantly, after testing
the intermediate hurdle of 8540. However, on expected lines, the
individual stocks gave very good moves on both sides. Despite
this small pause, we maintain our positive stance on the market
and continue to hold our view towards 8655. Positional traders
should not get carried away by such small intraday dips as the
overall trend remains strongly bullish. For the coming session, we
see support levels at 8493 - 8479; whereas, 8550 - 8600 would
be seen as next resistance levels for the Nifty. Similar to previous
session, traders are advised to focus on individual stocks which
may fetch higher returns as compared to the index.
Key Levels
Support 1 - 8493
Resistance 1 - 8550
Support 2 - 8479
Resistance 2 - 8600
Nifty Bank Outlook - (18619)
Exhibit 2: Nifty Bank Daily Chart
The Nifty Bank index too opened slightly higher in-line with the
benchmark index. However, during the session, we saw some
profit booking in individual heavyweights, leading to a minor cut
of 0.26% over its previous close.
Despite yesterday’s small corrective move, we do not see any
major change in the chart structure and thus, we maintain our
optimistic stance on the market. We stick to our higher targets of
18800 - 18900 and thus, intraday dips should be used as a
buying opportunity. On the flipside, immediate support levels are
placed at 18464 - 18409. Traders are advised to trade with a
positive bias and use dips to initiate long positions in selective
banking conglomerates.
Key Levels
Support 1 - 18464
Resistance 1 - 18800
Support 2 - 18409
Resistance 2 - 18900
1
Technical & Derivatives Report
July 14, 2016
Comments
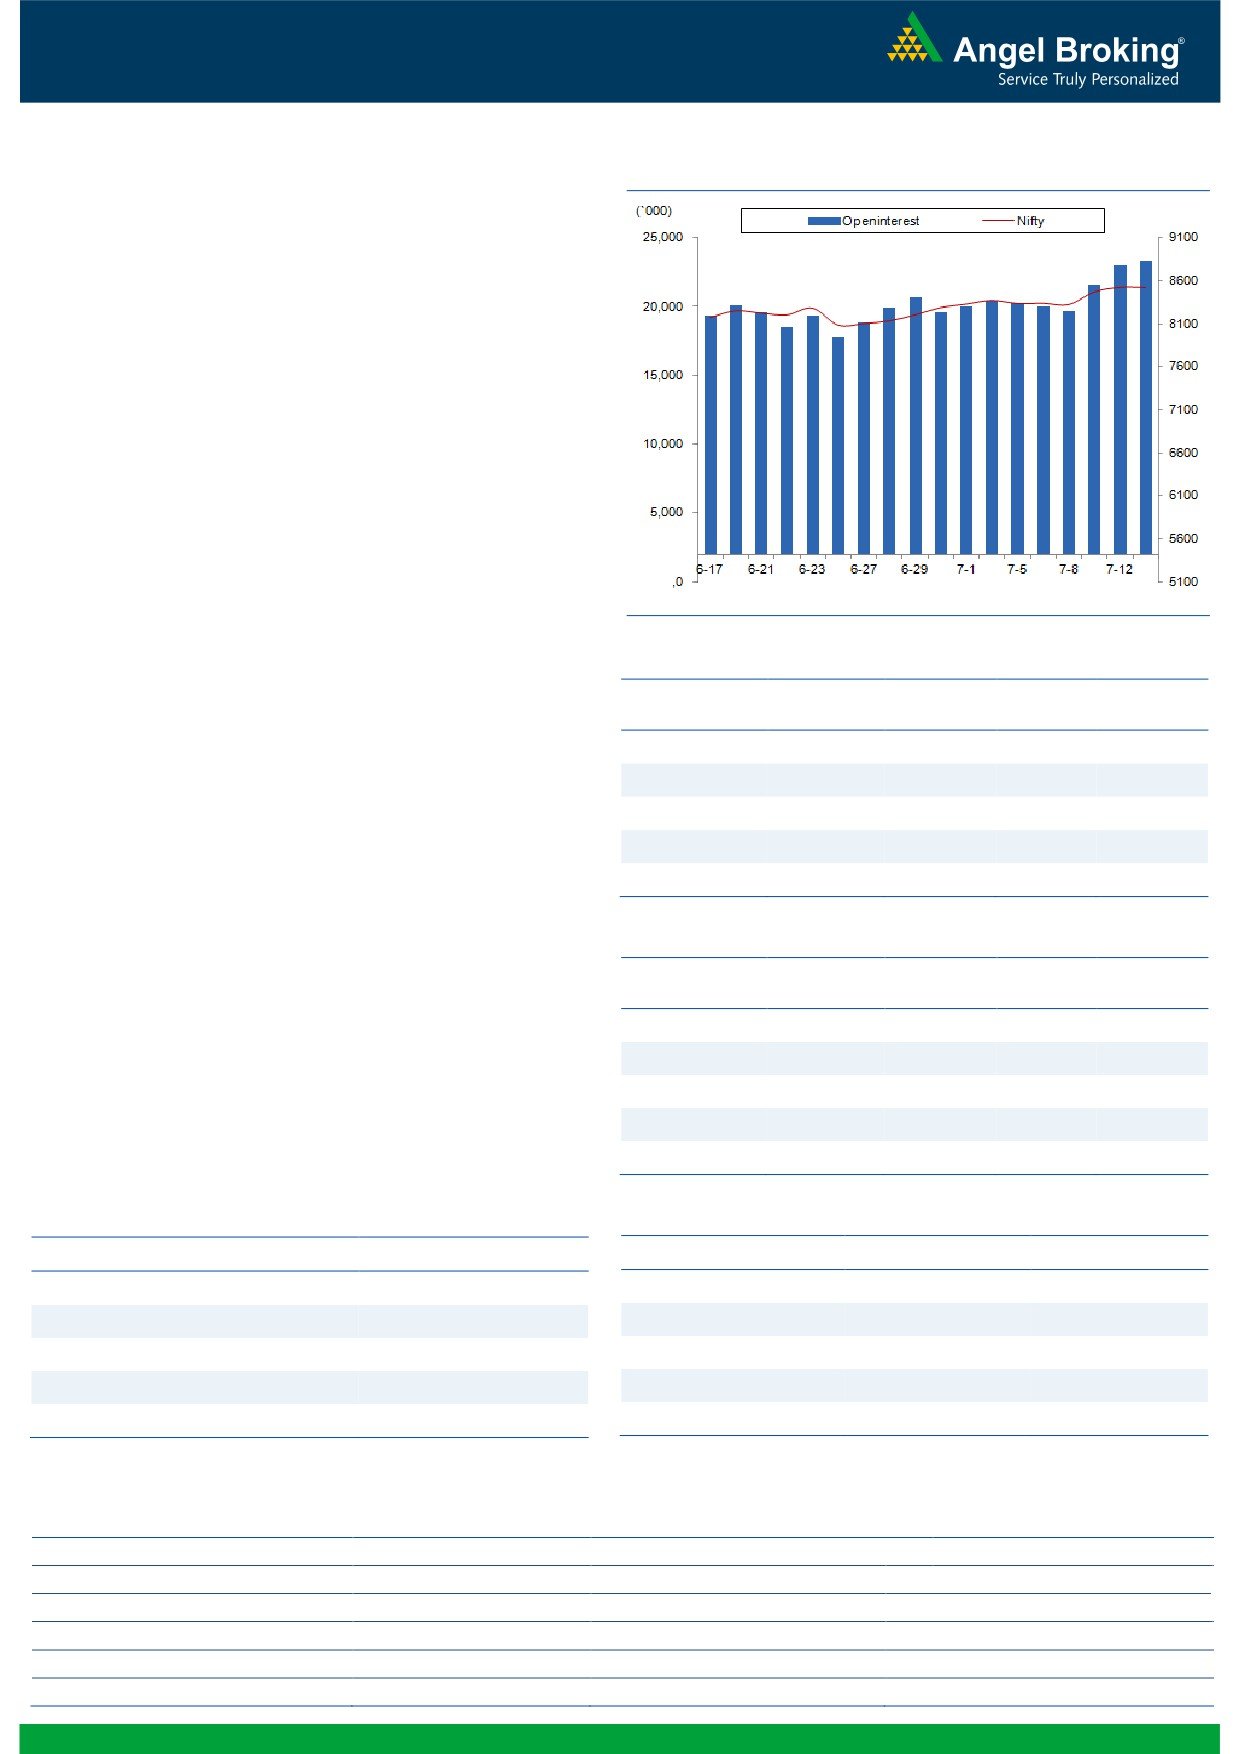
Nifty Vs OI
The Nifty futures open interest has increased by 1.37%
BankNifty futures open interest has increased by 0.45%
as market closed at 8519.50 levels.
The Nifty July future closed with a premium of 0.55
points against a premium of 7.70 points in previous
session. The August series closed at a premium of 35.45
points.
The Implied Volatility of at the money options has
increased from 12.73% to 13.21%.
The total OI of the market is Rs. 2,50,548/- cr. and the
stock futures OI is Rs. 68,021/- cr.
Few of the liquid counters where we have seen high cost
of carry are GODREJCP, GMRINFRA, TV18BRDCST,
RCOM and APOLLOTYRE.
Views
OI Gainers
Yesterday, FIIs were net buyers in both cash market and
OI
PRICE
SCRIP
OI
PRICE
CHG. (%)
CHG. (%)
Index Futures segment. They bought equities to the tune
OIL
1047200
26.75
373.15
1.55
of Rs. 291 crores. While in Index Futures, they were net
buyers worth Rs. 673 crores with of rise in open interest,
ARVIND
5468000
20.44
318.85
-4.28
indicating fresh long formation.
IBREALEST
42780000
16.00
91.65
-4.78
On Index Options front, FIIs were net buyer worth
LICHSGFIN
8107000
10.00
513.80
-1.72
Rs. 197 crores with rise in open interest. In call options,ng.com
CAIRN
17713500
9.43
167.05
2.36
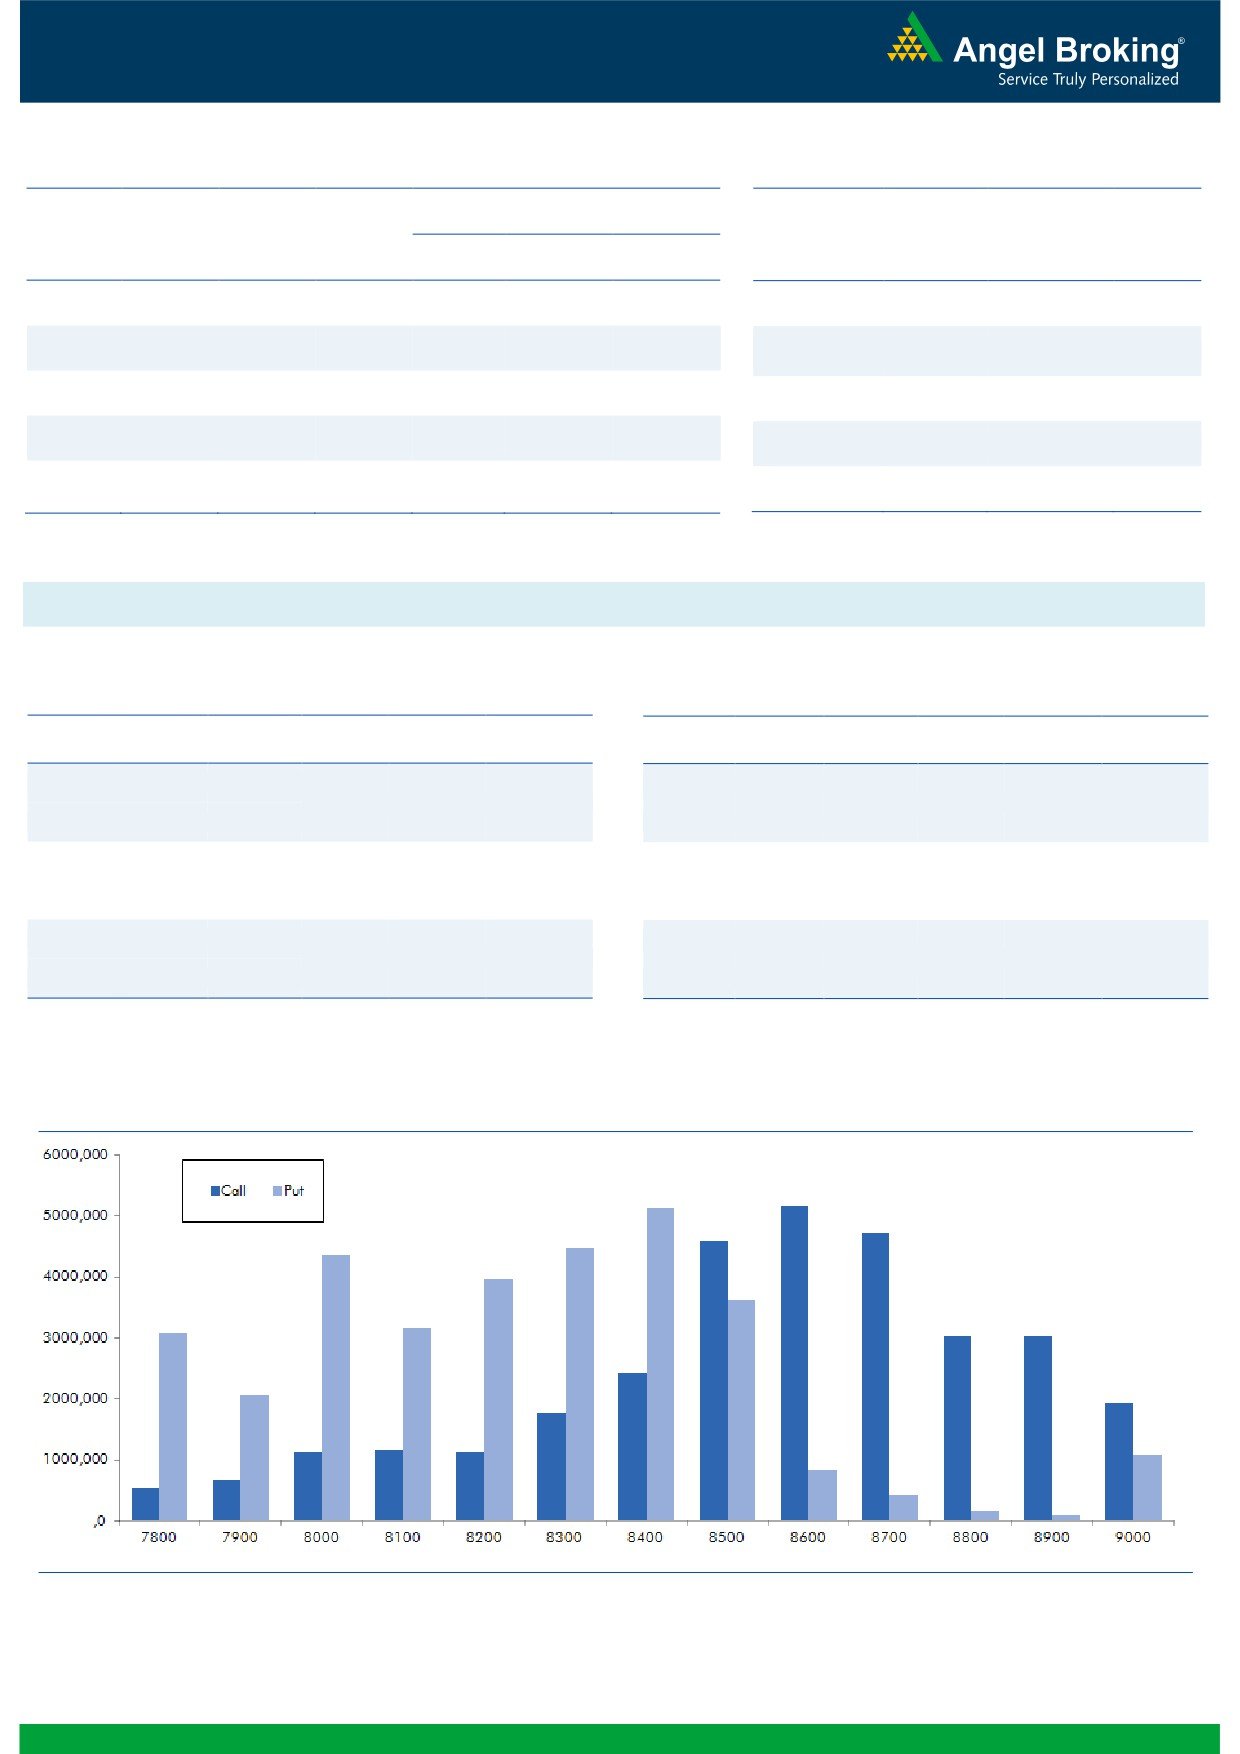
8900 strike added huge amount of fresh positions;
followed by decent build up in 8800, 8500 and 8600
OI Losers
strikes. On the other hand, we didn’t witness any major
OI
PRICE
activty in put options. Maximum open interest in current
SCRIP
OI
PRICE
CHG. (%)
CHG. (%)
series is placed at 8600 call and 8400 put.
MOTHERSUMI
9035000
-10.48
295.30
0.34
FIIs continued their buying streak in Index futures; and
ACC
874400
-8.15
1619.35
-0.45
considering the quantum of their longs, we are expecting
GAIL
6865500
-7.01
392.10
3.14
Nifty to test its next resistance zone 8600-8630. Thus,
GLENMARK
2203600
-6.50
848.90
0.75
Traders are advised to trade with positive bias.
CUMMINSIND
1029000
-5.87
811.65
1.08
Historical Volatility
Put-Call Ratio
SCRIP
HV
SCRIP
PCR-OI
PCR-VOL
TV18BRDCST
77.05
NIFTY
1.05
0.90
KSCL
31.47
BANKNIFTY
1.56
1.08
GAIL
31.26
SBIN
0.79
0.59
ARVIND
38.90
INFY
0.81
0.52
POWERGRID
27.38
RELIANCE
0.50
0.35
Strategy Date
Symbol
Strategy
Status
04-07-2016
RCOM
Ratio Bull Call Spread
Active
11-07-2016
BANKNIFTY
Bull Call Spread
Didn’t trigger
2
Technical & Derivatives Report
July 14, 2016
FII Statistics for 13-July 2016
Turnover on 13-July 2016
Open Interest
No. of
Turnover
Change
Detail
Buy
Sell
Net
Instrument
Value
Contracts
( in Cr. )
(%)
Contracts
Change (%)
(in Cr.)
INDEX
INDEX
2051.90
1378.87
673.04
285025
18538.48
3.65
171106
11567.37
-5.22
FUTURES
FUTURES
INDEX
INDEX
22303.06
22105.57
197.49
922853
59494.85
4.91
2760011
189272.77
-1.16
OPTIONS
OPTIONS
STOCK
5732.01
5577.98
154.03
813346
51791.85
0.11
STOCK
FUTURES
574790
38961.10
10.90
FUTURES
STOCK
STOCK
4381.89
4465.52
(83.63)
81941
5343.66
10.63
OPTIONS
364390
25586.93
16.96
OPTIONS
TOTAL
34468.86
33527.93
940.93
2103165
135168.84
3.04
TOTAL
3870297
265388.18
1.80
Nifty Spot = 8519.50
Lot Size = 75
Bull-Call Spreads
Bear-Put Spreads
Action
Strike
Price
Risk
Reward
BEP
Action
Strike
Price
Risk
Reward
BEP
Buy
8500
102.70
Buy
8500
84.70
47.90
52.10
8547.90
33.00
67.00
8467.00
Sell
8600
54.80
Sell
8400
51.70
Buy
8500
102.70
Buy
8500
84.70
76.85
123.15
8576.85
54.10
145.90
8445.90
Sell
8700
25.85
Sell
8300
30.60
Buy
8600
54.80
Buy
8400
51.70
28.95
71.05
8628.95
21.10
78.90
8378.90
Sell
8700
25.85
Sell
8300
30.60
Note: Above mentioned Bullish or Bearish Spreads in Nifty (July Series) are given as an information and not as a recommendation.
Nifty Put-Call Analysis
3
Technical & Derivatives Report
July 14, 2016
Daily Pivot Levels for Nifty Constituents
Scrips
S2
S1
PIVOT
R1
R2
ACC
1,604
1,610
1,618
1,625
1,632
ADANIPORTS
211
214
218
221
225
AMBUJACEM
257
259
261
263
265
ASIANPAINT
992
1,001
1,015
1,024
1,038
AUROPHARMA
762
768
774
781
787
AXISBANK
545
551
557
563
570
BAJAJ-AUTO
2,614
2,636
2,652
2,673
2,690
BANKBARODA
157
159
160
162
164
BHEL
135
138
143
146
151
BPCL
531
538
551
558
570
BHARTIARTL
356
360
363
367
370
INFRATEL
340
346
350
356
360
BOSCH
22,947
23,093
23,272
23,418
23,596
CIPLA
507
511
515
519
523
COALINDIA
314
319
322
327
331
DRREDDY
3,527
3,572
3,599
3,643
3,671
EICHERMOT
19,260
19,398
19,549
19,687
19,838
GAIL
374
383
388
397
402
GRASIM
4,581
4,605
4,629
4,653
4,677
HCLTECH
713
716
720
724
728
HDFCBANK
1,189
1,193
1,198
1,202
1,206
HDFC
1,307
1,318
1,328
1,340
1,350
HEROMOTOCO
3,190
3,205
3,235
3,250
3,280
HINDALCO
132
134
137
139
142
HINDUNILVR
913
920
925
932
937
ICICIBANK
254
258
263
266
271
IDEA
103
105
106
108
109
INDUSINDBK
1,082
1,093
1,112
1,123
1,141
INFY
1,168
1,181
1,188
1,201
1,209
ITC
244
246
247
249
251
KOTAKBANK
754
765
771
781
787
LT
1,528
1,540
1,555
1,566
1,581
LUPIN
1,617
1,633
1,659
1,675
1,701
M&M
1,448
1,456
1,468
1,476
1,488
MARUTI
4,268
4,295
4,327
4,354
4,386
NTPC
155
156
158
159
161
ONGC
227
230
236
240
245
POWERGRID
156
159
164
167
171
RELIANCE
997
1,003
1,010
1,016
1,022
SBIN
222
225
227
229
231
SUNPHARMA
763
771
783
791
803
TCS
2,433
2,463
2,481
2,511
2,529
TATAMTRDVR
298
302
307
311
316
TATAMOTORS
472
477
482
487
493
TATAPOWER
71
72
72
73
74
TATASTEEL
339
348
354
363
368
TECHM
501
504
508
510
514
ULTRACEMCO
3,381
3,408
3,452
3,479
3,523
WIPRO
566
570
574
578
582
YESBANK
1,131
1,139
1,146
1,154
1,161
ZEEL
448
453
457
461
466
4
Technical & Derivatives Report
July 14, 2016
Research Team Tel: 022 - 39357800
For Technical Queries
For Derivatives Queries
DISCLAIMER
Angel Broking Private Limited (hereinafter referred to as “Angel”) is a registered Member of National Stock Exchange of India Limited,
Bombay Stock Exchange Limited and MCX Stock Exchange Limited. It is also registered as a Depository Participant with CDSL and
Portfolio Manager with SEBI. It also has registration with AMFI as a Mutual Fund Distributor. Angel Broking Private Limited is a
registered entity with SEBI for Research Analyst in terms of SEBI (Research Analyst) Regulations, 2014 vide registration number
INH000000164. Angel or its associates has not been debarred/ suspended by SEBI or any other regulatory authority for accessing
/dealing in securities Market. Angel or its associates including its relatives/analyst do not hold any financial interest/beneficial
ownership of more than 1% in the company covered by Analyst. Angel or its associates/analyst has not received any compensation /
managed or co-managed public offering of securities of the company covered by Analyst during the past twelve months. Angel/analyst
has not served as an officer, director or employee of company covered by Analyst and has not been engaged in market making activity
of the company covered by Analyst.
This document is solely for the personal information of the recipient, and must not be singularly used as the basis of any investment
decision. Nothing in this document should be construed as investment or financial advice. Each recipient of this document should
make such investigations as they deem necessary to arrive at an independent evaluation of an investment in the securities of the
companies referred to in this document (including the merits and risks involved), and should consult their own advisors to determine
the merits and risks of such an investment.
Reports based on technical and derivative analysis center on studying charts of a stock's price movement, outstanding positions and
trading volume, as opposed to focusing on a company's fundamentals and, as such, may not match with a report on a company's
fundamentals.
The information in this document has been printed on the basis of publicly available information, internal data and other reliable
sources believed to be true, but we do not represent that it is accurate or complete and it should not be relied on as such, as this
document is for general guidance only. Angel Broking Pvt. Limited or any of its affiliates/ group companies shall not be in any way
responsible for any loss or damage that may arise to any person from any inadvertent error in the information contained in this report.
Angel Broking Pvt. Limited has not independently verified all the information contained within this document. Accordingly, we cannot
testify, nor make any representation or warranty, express or implied, to the accuracy, contents or data contained within this document.
While Angel Broking Pvt. Limited endeavors to update on a reasonable basis the information discussed in this material, there may be
regulatory, compliance, or other reasons that prevent us from doing so.
This document is being supplied to you solely for your information, and its contents, information or data may not be reproduced,
redistributed or passed on, directly or indirectly.
Neither Angel Broking Pvt. Limited, nor its directors, employees or affiliates shall be liable for any loss or damage that may arise from
or in connection with the use of this information.
Note: Please refer to the important ‘Stock Holding Disclosure' report on the Angel website (Research Section). Also, please refer to the
latest update on respective stocks for the disclosure status in respect of those stocks. Angel Broking Pvt. Limited and its affiliates may
have investment positions in the stocks recommended in this report.
5