Technical & Derivatives Report
June 14, 2016
Sensex (26397) / Nifty (8111)
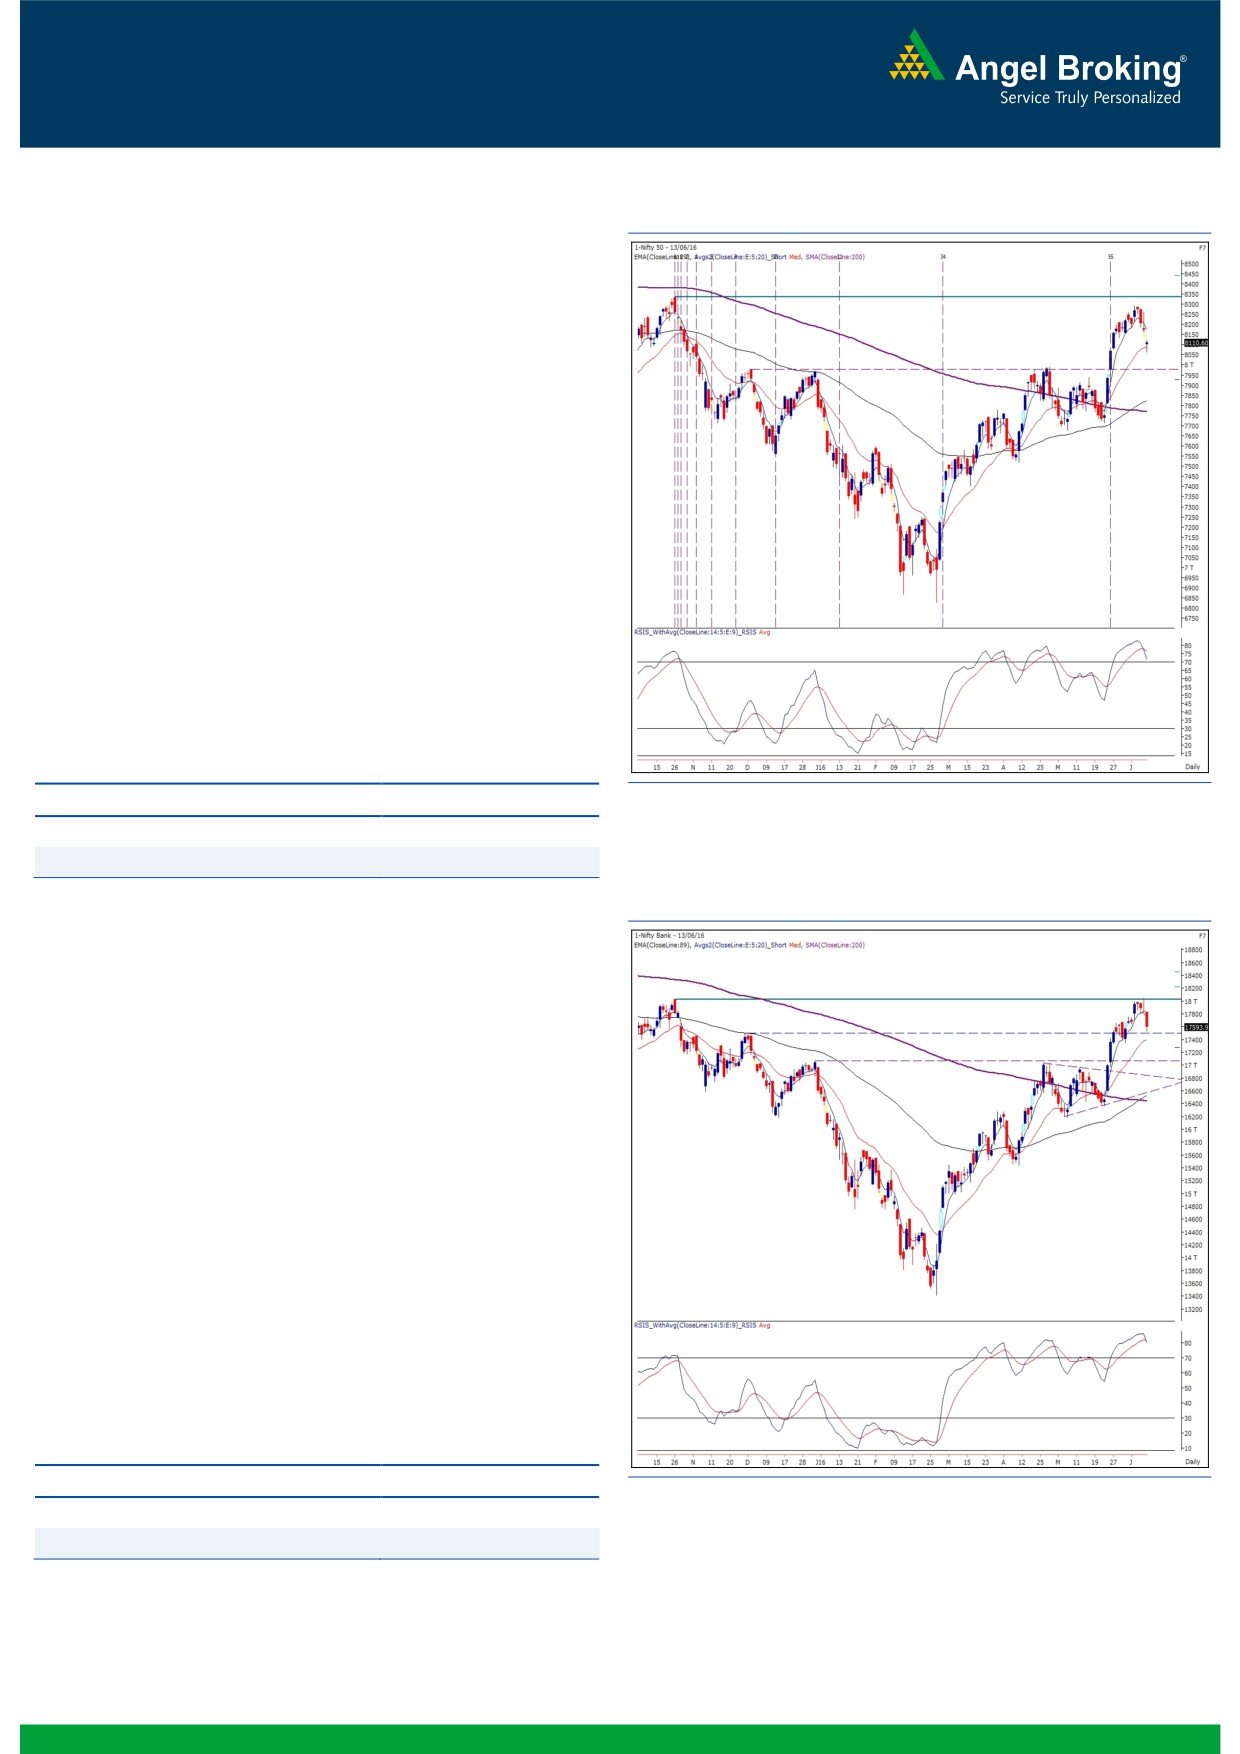
Exhibit 1: Nifty Daily Chart
Opening session of the week began with nearly a percent cut
mirroring to negative cues from the global bourses. Subsequently,
the index continued this downward bias to sneak convincingly
below the 8100 mark. However, due to a modest recovery in the
latter part Nifty managed to close above 8100 mark.
Yesterday, the Nifty managed to find a strong support around
mentioned technical evidences such as, the Daily ’20 EMA’ and
the ‘Super Trend’ indicator placed around
8080. If we
meticulously observe yesterday’s candle, it resembles a ‘Dragonfly
Doji’. The said pattern has a bullish implication if occurs after a
fall. In this case, it has occurred after a small corrective move and
thus, cannot be termed as a trend reversal; but, certainly indicates
exhaustion or weak move by the bears at a support zone. Going
forward, if the index manages to sustain above yesterday’s high
of 8125 then we may witness an intraday bounce towards 8162 -
8186 levels. On the flipside, yesterday’s low of 8063 would now
be seen as important support during the day.
Key Levels
Support 1 - 8063
Resistance 1 - 8125
Support 2 - 8030
Resistance 2 - 8162
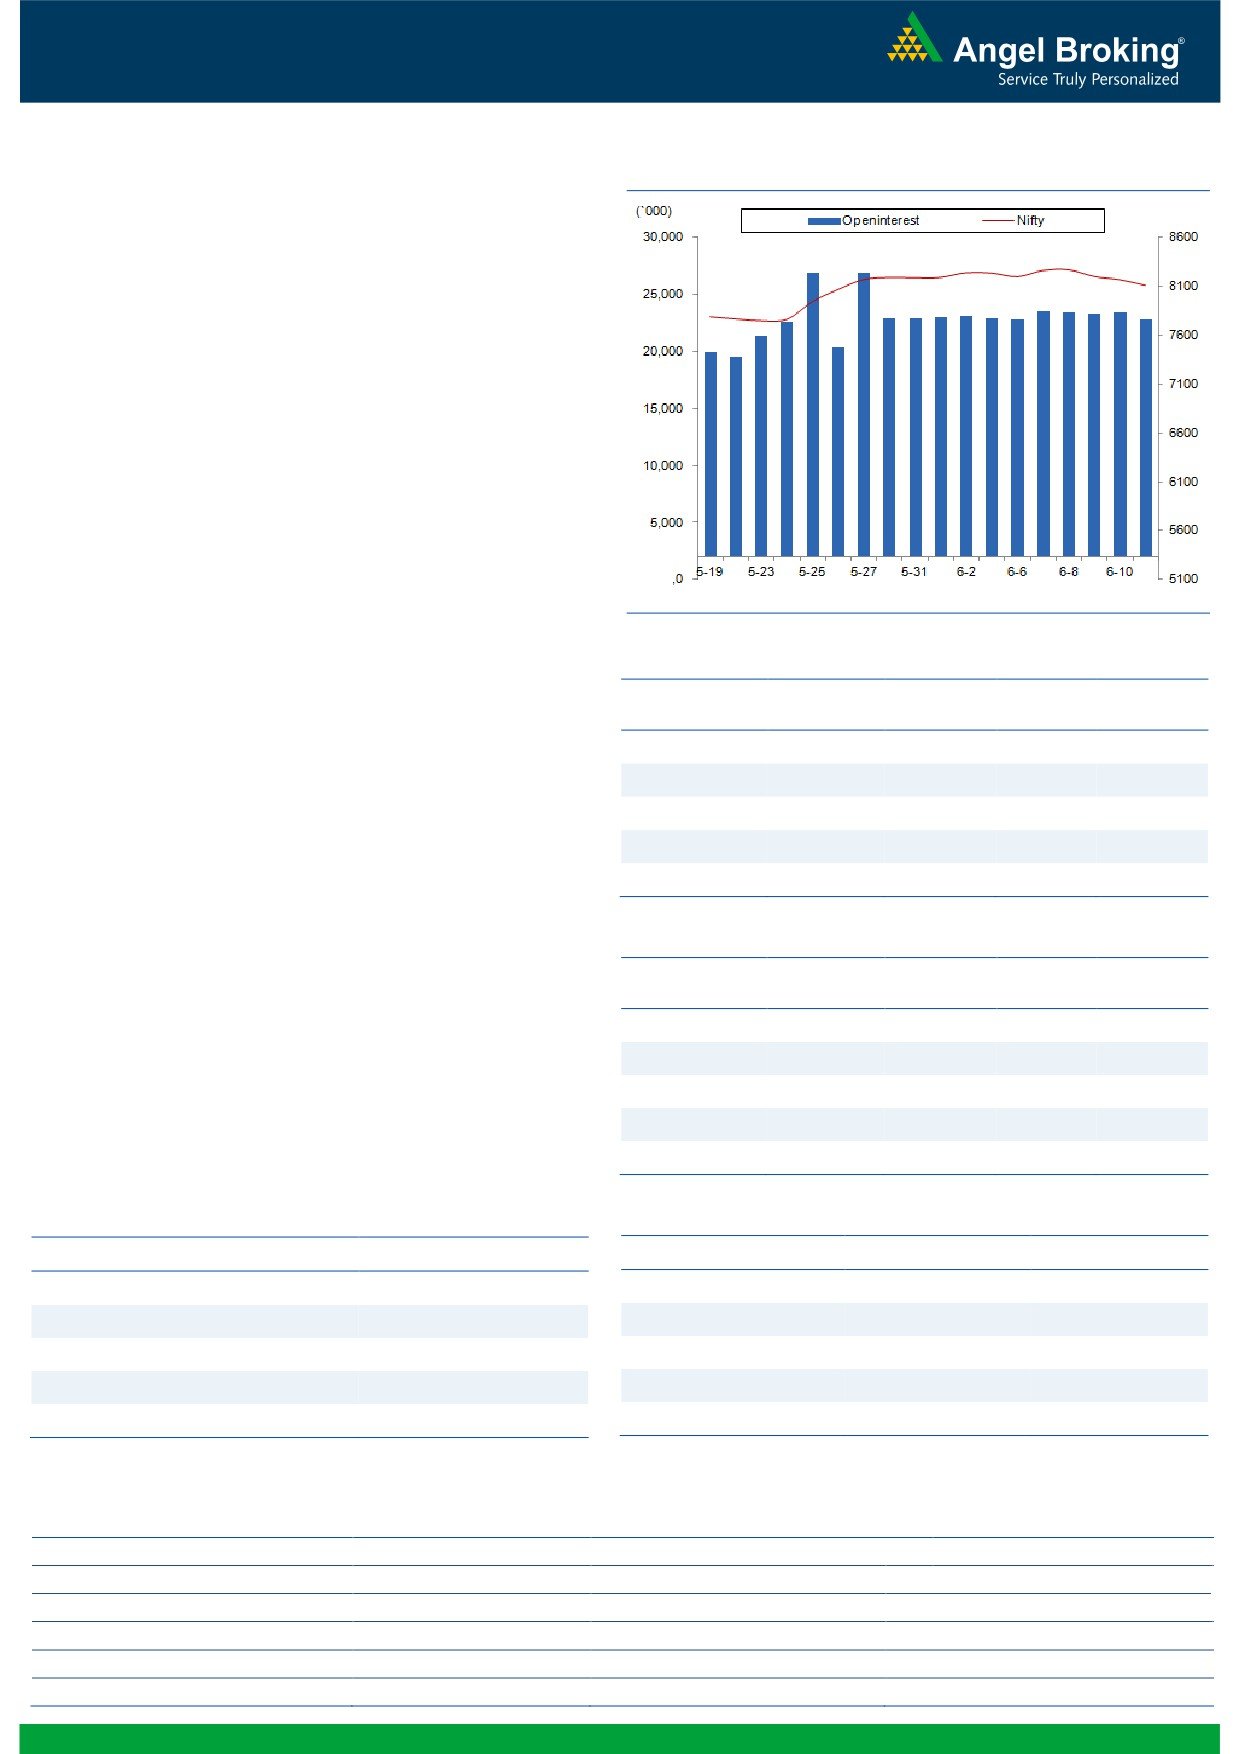
Exhibit 2: Nifty Bank Daily Chart
Nifty Bank Outlook - (17594)
The Nifty Bank index opened on a negative note yesterday on
weak global cues and corrected sharply in first hour of trade.
Thereafter, rest of the session was marred by range bound activity
with the index ending the day with a loss of 1.32% over Friday's
close.
Yesterday's correction in the index was much on our expected
lines as we had mentioned in our previous report about the
bearish implication of the 'Gravestone Doji' pattern around the
resistance zone. Post sell off in first hour of trade, Nifty Bank
consolidated near the support zone hourly ‘89EMA’. However,
analyzing the daily charts, we continue to advise traders to stay
light on positions and wait for fresh developments to re-enter the
markets. Till then, it is wise to trade on stock specific moves with
proper risk management. The intraday support for the index is
placed at 17520 - 17350; whereas, resistances are seen in the
range of 17800 - 17900.
Key Levels
Support 1 - 17520
Resistance 1 - 17800
Support 2 - 17350
Resistance 2 - 17900
1
Technical & Derivatives Report
June 14, 2016
Comments
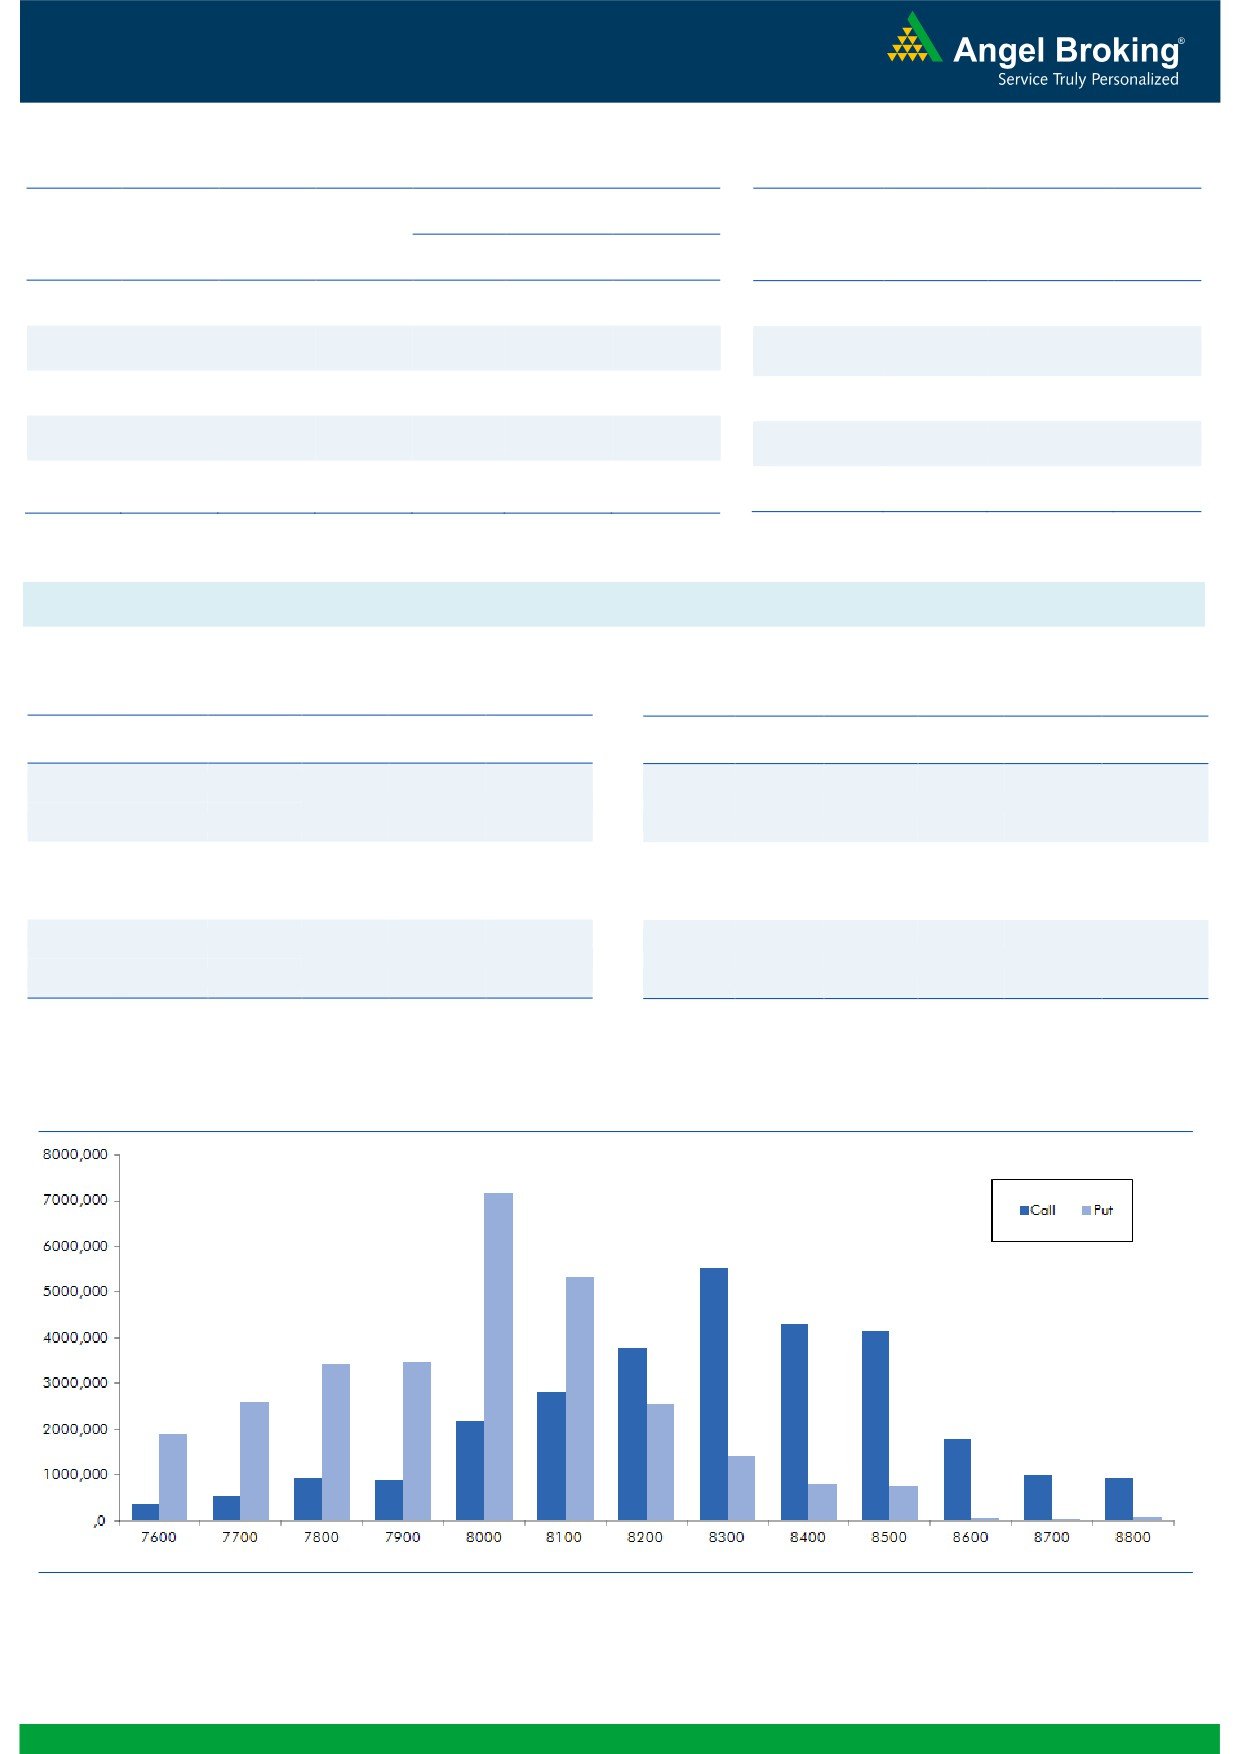
Nifty Vs OI
The Nifty futures open interest has decreased by 2.76%
BankNifty futures open interest has decreased by 8.27%
as market closed at 8110.60 levels.
The Nifty June future closed with a premium of 20.05
points against a premium of 20.35 points in previous
session. The July series closed at a premium of 46.75
points.
The Implied Volatility of at the money options has
increased from 14.64% to 15.59%.
The total OI of the market is Rs. 2,35,653/- cr. and the
stock futures OI is Rs. 66,734/- cr.
Few of the liquid counters where we have seen high cost
of carry are UNITECH, JPASSOCIAT, DISHTV, CESC and
SRTRANSFIN.
Views
Despite a correction in market, yesterday, the FIIs were
OI Gainers
net buyers in equity cash segment worth Rs. 212 crores.
OI
PRICE
SCRIP
OI
PRICE
CHG. (%)
CHG. (%)
While, in Index Futures, they sold worth Rs. 616 crores
MCLEODRUSS
3605200
17.75
198.60
6.37
with fall in open interest, suggesting long unwinding.
AMBUJACEM
10263300
15.24
237.20
0.68
On Index Options front, FIIs were buyer to the tune of
Rs. 649 crores with marginal change in OI. In Call
APOLLOHOSP
747600
10.40
1325.70
-2.74
options, good amount of build-up seen in 8100 strike,
KPIT
1508000
9.59
190.00
2.10
followed by unwinding in 8400 - 8500 strikes. While inng.com
HINDUNILVR
5787000
9.49
869.45
-0.08
put option, 7800 strike added some fresh positions;
whereas, huge unwinding was seen in 8100 and 8200
OI Losers
strikes. We believe that put writers are covering their
OI
PRICE
positions. Maximum open interest in current series is
SCRIP
OI
PRICE
CHG. (%)
CHG. (%)
placed at 8300 call and 8000 put option.
HINDALCO
35621000
-5.43
114.90
-0.43
Though FIIs has not formed fresh shorts yet; but, they are
BAJFINANCE
554500
-4.66
7533.15
-1.20
unwinding long and their activity in option segment
IOB
6622000
-4.06
25.90
-2.81
doesn’t bode well for bulls. Hence, we maintain cautious
TVSMOTOR
5964000
-3.40
288.95
0.23
approach and are attentive towards further FIIs activity.
JSWENERGY
13594000
-3.40
79.15
-1.55
Thus, traders are advised to remain light on longs.
Historical Volatility
Put-Call Ratio
SCRIP
HV
SCRIP
PCR-OI
PCR-VOL
UNITECH
90.39
NIFTY
1.11
1.06
JPASSOCIAT
77.95
BANKNIFTY
0.89
0.83
MCLEODRUSS
44.57
SBIN
0.86
0.74
TATAGLOBAL
30.21
RELIANCE
0.60
0.41
CAIRN
41.58
SUNPHARMA
0.37
0.31
Strategy Date
Symbol
Strategy
Status
May 30, 2016
TCS
Ratio Bull Call Spread
Active
June 06, 2016
NIFTY
Long Call
Exited at Cost
June 13, 2016
ONGC
Ratio Bull Call Spread
Active
2
Technical & Derivatives Report
June 14, 2016
FII Statistics for 13-June 2016
Turnover on 13-June 2016
Open Interest
No. of
Turnover
Change
Detail
Buy
Sell
Net
Instrument
Value
Contracts
( in Cr. )
(%)
Contracts
Change (%)
(in Cr.)
INDEX
INDEX
1506.29
2121.90
(615.61)
282821
16979.91
(4.84)
281982
16377.67
-17.02
FUTURES
FUTURES
INDEX
INDEX
20143.73
19494.61
649.11
1046057
63025.58
(0.10)
2924781
173728.21
-10.96
OPTIONS
OPTIONS
STOCK
4018.41
5405.42
(1387.02)
1064617
52199.57
0.85
STOCK
FUTURES
491511
25245.74
-11.81
FUTURES
STOCK
STOCK
2749.27
2752.95
(3.68)
97188
4973.79
2.22
OPTIONS
293532
15425.71
-6.57
OPTIONS
TOTAL
28417.69
29774.88
(1357.19)
2490683
137178.86
(0.18)
TOTAL
3991806
230777.34
-11.24
Nifty Spot = 8110.60
Lot Size = 75
Bull-Call Spreads
Bear-Put Spreads
Action
Strike
Price
Risk
Reward
BEP
Action
Strike
Price
Risk
Reward
BEP
Buy
8100
124.70
Buy
8100
96.15
50.10
49.90
8150.10
33.45
66.55
8066.55
Sell
8200
74.60
Sell
8000
62.70
Buy
8100
124.70
Buy
8100
96.15
84.40
115.60
8184.40
55.55
144.45
8044.45
Sell
8300
40.30
Sell
7900
40.60
Buy
8200
74.60
Buy
8000
62.70
34.30
65.70
8234.30
22.10
77.90
7977.90
Sell
8300
40.30
Sell
7900
40.60
Note: Above mentioned Bullish or Bearish Spreads in Nifty (June Series) are given as an information and not as a recommendation.
Nifty Put-Call Analysis
3
Technical & Derivatives Report
June 14, 2016
Daily Pivot Levels for Nifty Constituents
Scrips
S2
S1
PIVOT
R1
R2
ACC
1,530
1,539
1,545
1,553
1,560
ADANIPORTS
195
199
201
205
207
AMBUJACEM
229
233
236
240
243
ASIANPAINT
981
988
992
999
1,004
AUROPHARMA
723
736
744
757
766
AXISBANK
519
525
530
536
541
BAJAJ-AUTO
2,537
2,560
2,577
2,601
2,618
BANKBARODA
140
143
145
148
151
BHEL
118
119
121
122
124
BPCL
968
988
1,001
1,021
1,033
BHARTIARTL
336
339
345
348
354
INFRATEL
369
374
377
382
385
BOSCH
21,001
21,299
21,500
21,798
21,998
CIPLA
457
463
471
477
486
COALINDIA
302
305
308
311
314
DRREDDY
3,052
3,070
3,086
3,104
3,120
EICHERMOT
18,151
18,299
18,426
18,574
18,701
GAIL
358
365
371
377
383
GRASIM
4,256
4,284
4,309
4,337
4,362
HCLTECH
736
745
750
759
765
HDFCBANK
1,142
1,148
1,156
1,162
1,170
HDFC
1,187
1,196
1,211
1,220
1,234
HEROMOTOCO
2,995
3,016
3,037
3,058
3,079
HINDALCO
110
112
114
116
118
HINDUNILVR
861
867
874
881
888
ICICIBANK
239
241
245
247
251
IDEA
97
99
101
102
104
INDUSINDBK
1,090
1,099
1,109
1,119
1,129
INFY
1,158
1,170
1,177
1,189
1,196
ITC
342
346
350
354
358
KOTAKBANK
740
748
753
761
765
LT
1,447
1,456
1,465
1,475
1,484
LUPIN
1,415
1,434
1,449
1,467
1,482
M&M
1,315
1,336
1,356
1,377
1,398
MARUTI
4,028
4,081
4,116
4,169
4,204
NTPC
147
148
149
150
152
ONGC
210
212
214
216
218
POWERGRID
150
151
152
153
155
RELIANCE
955
968
976
989
996
SBIN
199
200
202
203
204
SUNPHARMA
728
737
743
752
757
TCS
2,504
2,526
2,539
2,561
2,575
TATAMTRDVR
291
297
303
308
314
TATAMOTORS
429
437
444
452
459
TATAPOWER
74
75
76
77
78
TATASTEEL
316
319
325
328
334
TECHM
525
530
533
537
541
ULTRACEMCO
3,300
3,349
3,377
3,426
3,455
WIPRO
536
538
542
544
547
YESBANK
1,044
1,054
1,063
1,074
1,082
ZEEL
446
455
460
469
474
4
Technical & Derivatives Report
June 14, 2016
Research Team Tel: 022 - 39357800
For Technical Queries
For Derivatives Queries
DISCLAIMER
Angel Broking Private Limited (hereinafter referred to as “Angel”) is a registered Member of National Stock Exchange of India Limited,
Bombay Stock Exchange Limited and MCX Stock Exchange Limited. It is also registered as a Depository Participant with CDSL and
Portfolio Manager with SEBI. It also has registration with AMFI as a Mutual Fund Distributor. Angel Broking Private Limited is a
registered entity with SEBI for Research Analyst in terms of SEBI (Research Analyst) Regulations, 2014 vide registration number
INH000000164. Angel or its associates has not been debarred/ suspended by SEBI or any other regulatory authority for accessing
/dealing in securities Market. Angel or its associates including its relatives/analyst do not hold any financial interest/beneficial
ownership of more than 1% in the company covered by Analyst. Angel or its associates/analyst has not received any compensation /
managed or co-managed public offering of securities of the company covered by Analyst during the past twelve months. Angel/analyst
has not served as an officer, director or employee of company covered by Analyst and has not been engaged in market making activity
of the company covered by Analyst.
This document is solely for the personal information of the recipient, and must not be singularly used as the basis of any investment
decision. Nothing in this document should be construed as investment or financial advice. Each recipient of this document should
make such investigations as they deem necessary to arrive at an independent evaluation of an investment in the securities of the
companies referred to in this document (including the merits and risks involved), and should consult their own advisors to determine
the merits and risks of such an investment.
Reports based on technical and derivative analysis center on studying charts of a stock's price movement, outstanding positions and
trading volume, as opposed to focusing on a company's fundamentals and, as such, may not match with a report on a company's
fundamentals.
The information in this document has been printed on the basis of publicly available information, internal data and other reliable
sources believed to be true, but we do not represent that it is accurate or complete and it should not be relied on as such, as this
document is for general guidance only. Angel Broking Pvt. Limited or any of its affiliates/ group companies shall not be in any way
responsible for any loss or damage that may arise to any person from any inadvertent error in the information contained in this report.
Angel Broking Pvt. Limited has not independently verified all the information contained within this document. Accordingly, we cannot
testify, nor make any representation or warranty, express or implied, to the accuracy, contents or data contained within this document.
While Angel Broking Pvt. Limited endeavors to update on a reasonable basis the information discussed in this material, there may be
regulatory, compliance, or other reasons that prevent us from doing so.
This document is being supplied to you solely for your information, and its contents, information or data may not be reproduced,
redistributed or passed on, directly or indirectly.
Neither Angel Broking Pvt. Limited, nor its directors, employees or affiliates shall be liable for any loss or damage that may arise from
or in connection with the use of this information.
Note: Please refer to the important ‘Stock Holding Disclosure' report on the Angel website (Research Section). Also, please refer to the
latest update on respective stocks for the disclosure status in respect of those stocks. Angel Broking Pvt. Limited and its affiliates may
have investment positions in the stocks recommended in this report.
5