Technical & Derivatives Report
March 14, 2016
Sensex (24718) / Nifty (7510)
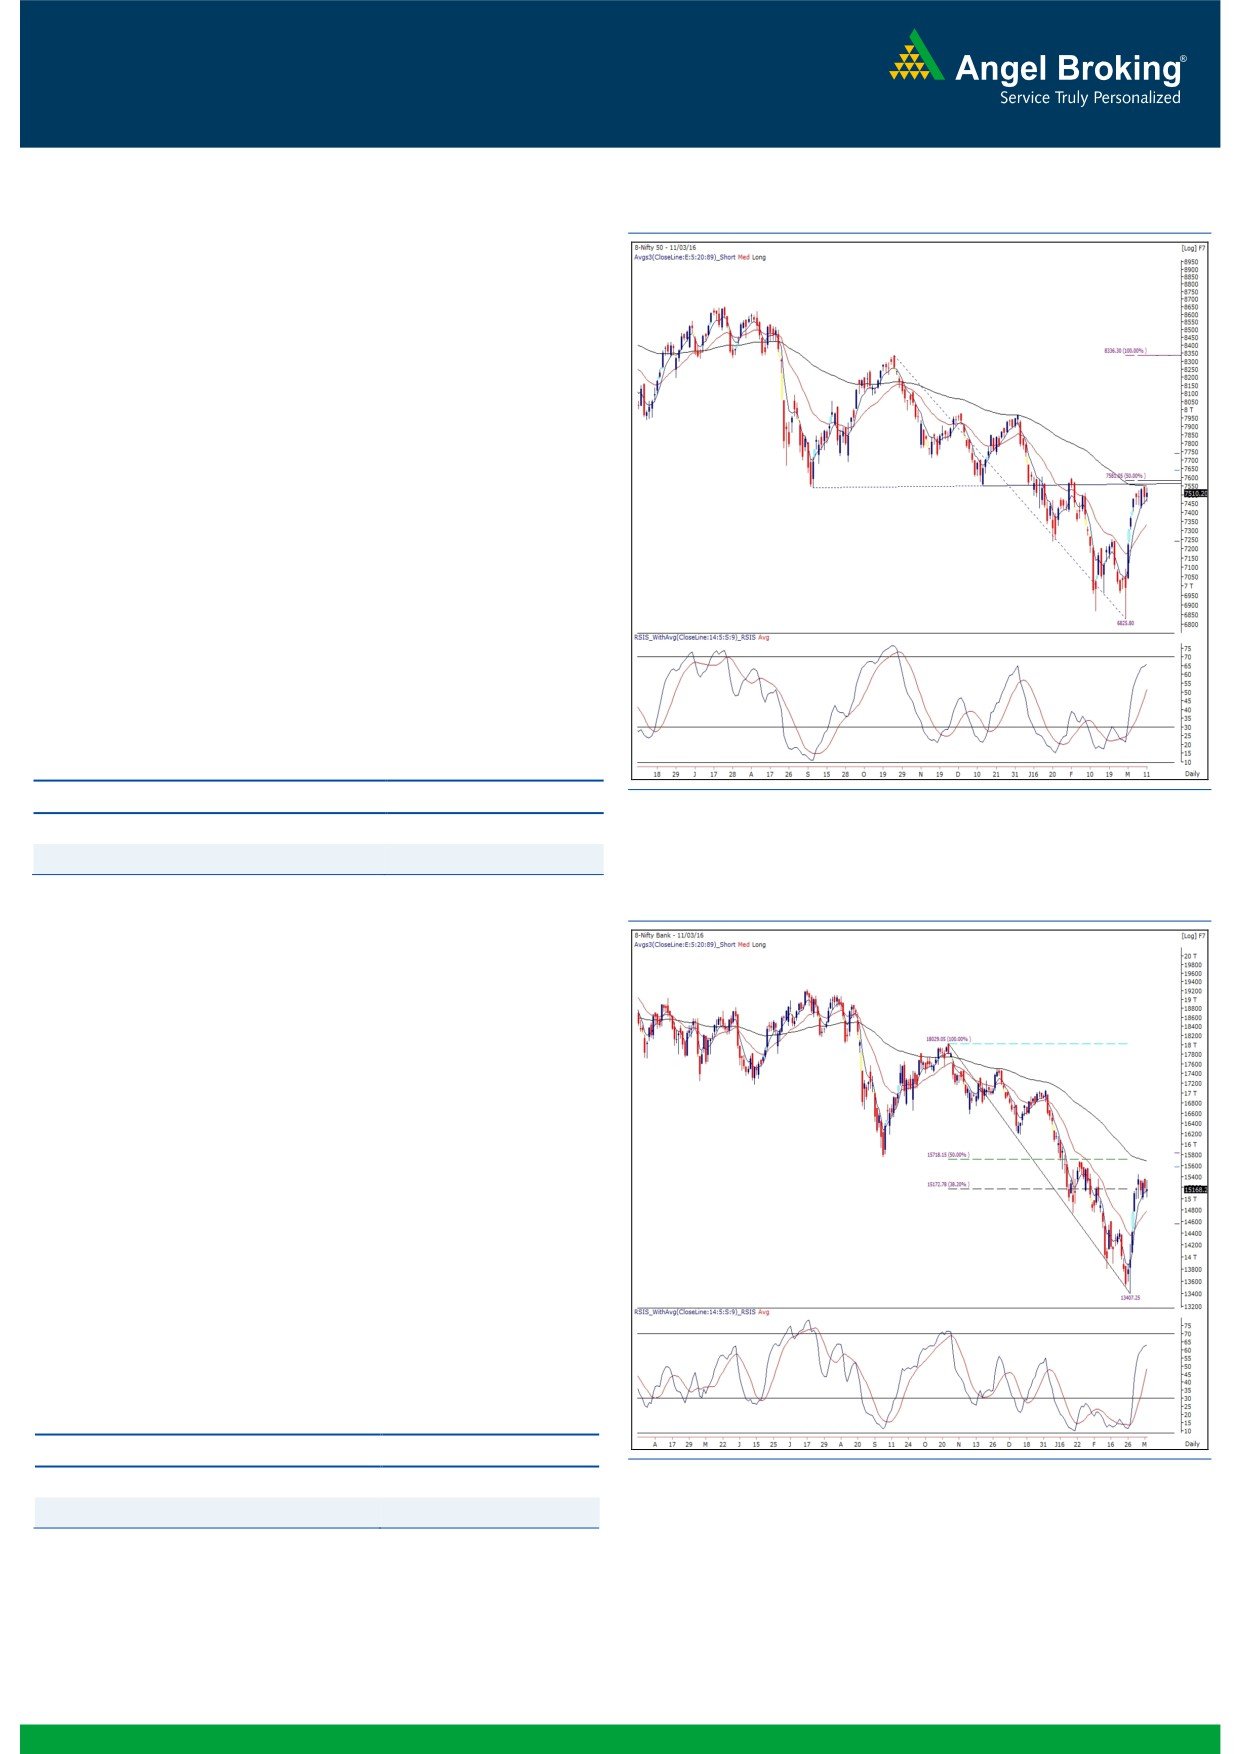
Exhibit 1: Nifty Daily Chart
On Friday, the Nifty opened on a flat note and started moving
higher from initial trades. But, the index took resistance
around previous day’s high and corrected in first half of the
session. However, we witnessed some recovery in the later half
and as result; Nifty trimmed-off its intraday losses and closed
with the gains of 0.32 percent over its previous close.
In concluded week, the Nifty traded in a narrow range around
its resistance of 7550 (previous breakdown level) on the daily
chart, which coincides with the
‘89 DEMA’ and
50%
retracement level of the previous down move from 8336.30 to
6825.80. However, in the last few trading sessions, the index
has not shown any signs of reversal or weakness in spite of it
hovering around the resistance zone. The short term trend,
hence, continues to remain positive. Going forward,
immediate resistance for the Nifty is placed at 7550 - 7600
levels; whereas, intraday support levels are seen at 7460 -
7424 levels.
Key Levels
Support 1 - 7460
Resistance 1 - 7550
Support 2 - 7424
Resistance 2 -
7600
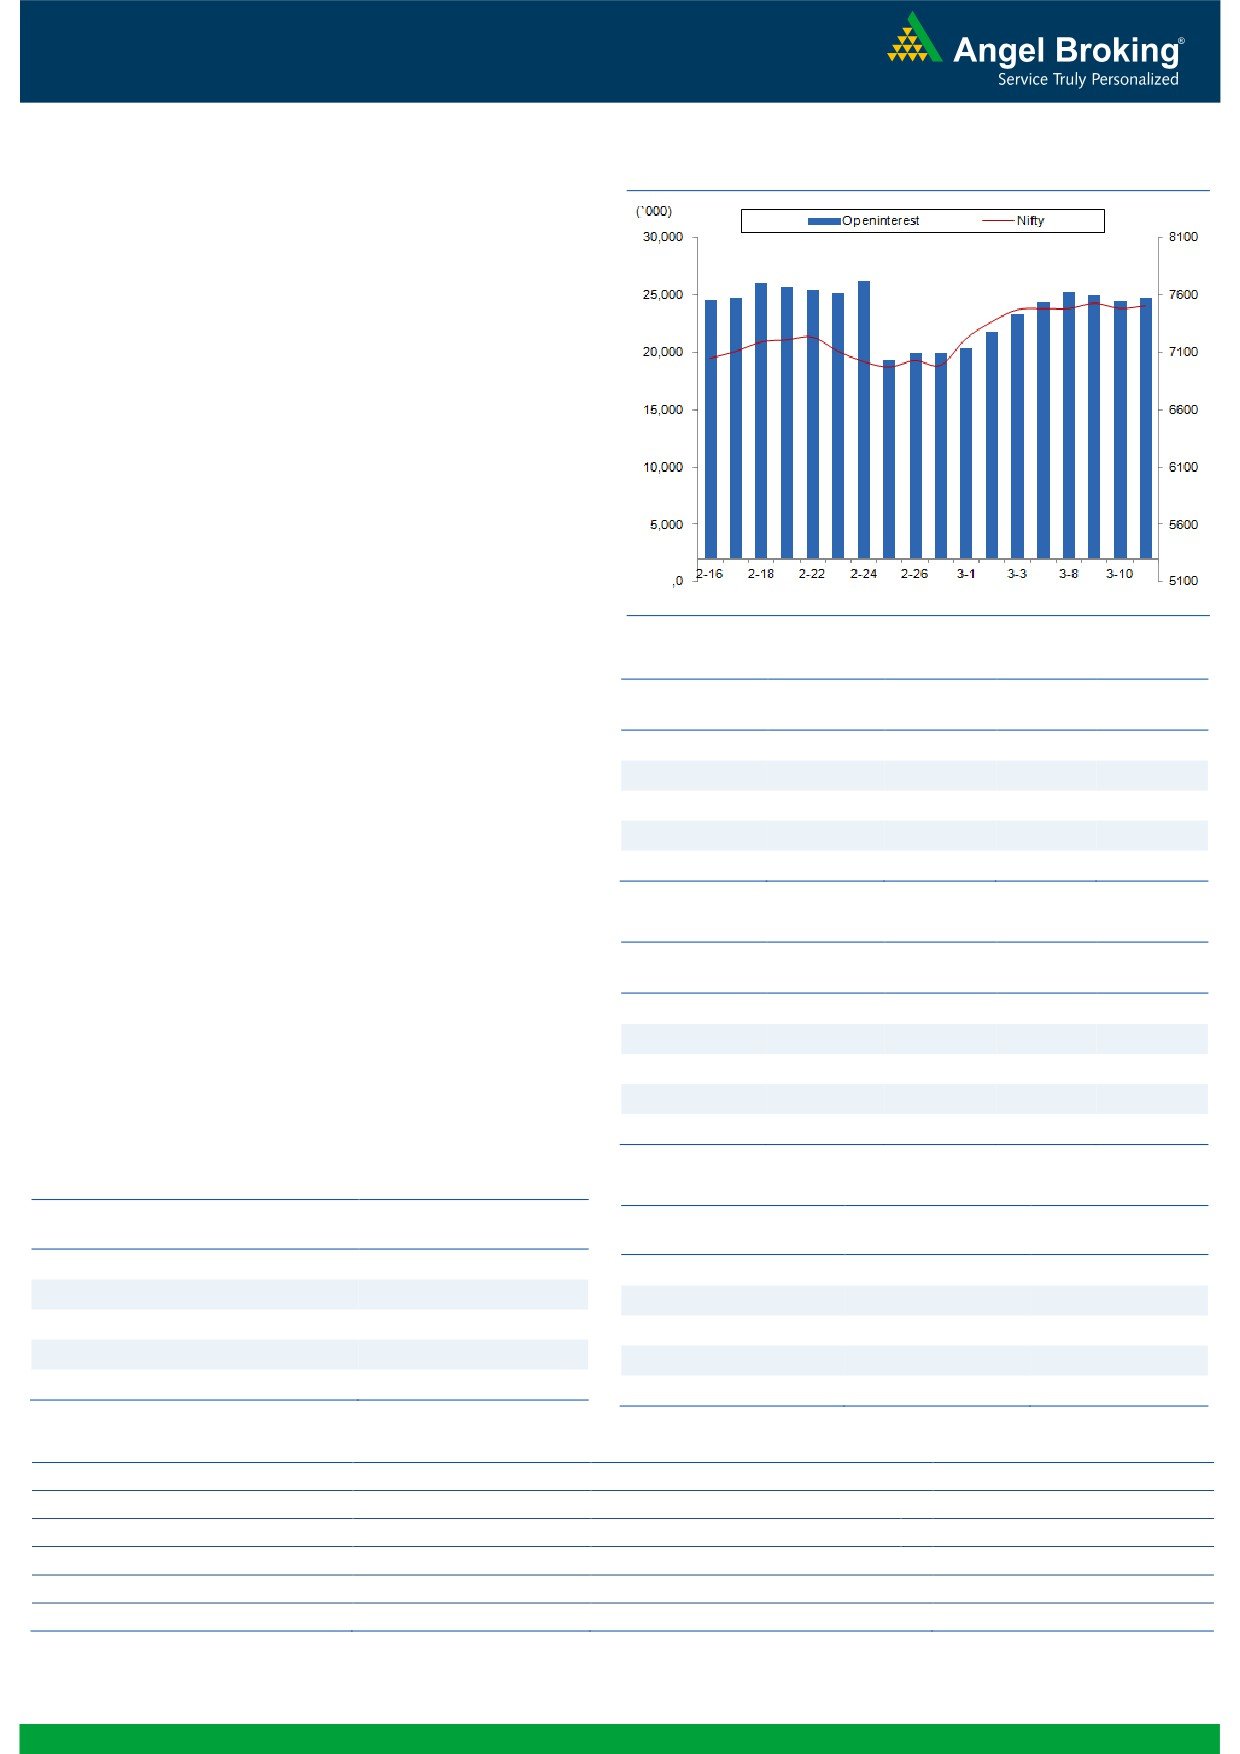
Exhibit 2: Nifty Bank Daily Chart
Nifty Bank Outlook - (15168)
The Nifty Bank index continued to trade in a narrow range;
wherein, the index ended the week with marginal gains of one
third of a percent over its previous week's close.
The index has formed a small body candle on weekly charts,
which clearly depicts the narrow range consolidation that was
seen during last week. During the consolidation, the index has
not shown any negative divergence or reversal signs and
hence, the short term trend continues to remain positive. In
near term, major resistance for the index is seen around the
January month's high of 15700, which coincides with daily
‘89EMA’. Traders with long positions in the index can thus
continue to hold the positions for target of 15700. The
intraday support for the index are placed around 15000 and
14765; whereas, resistances are seen around 15452 and
15700.
Key Levels
Support 1 - 15000
Resistance 1 - 15452
Support 2 - 14765
Resistance 2 - 15700
1
Technical & Derivatives Report
March 14, 2016
Comments
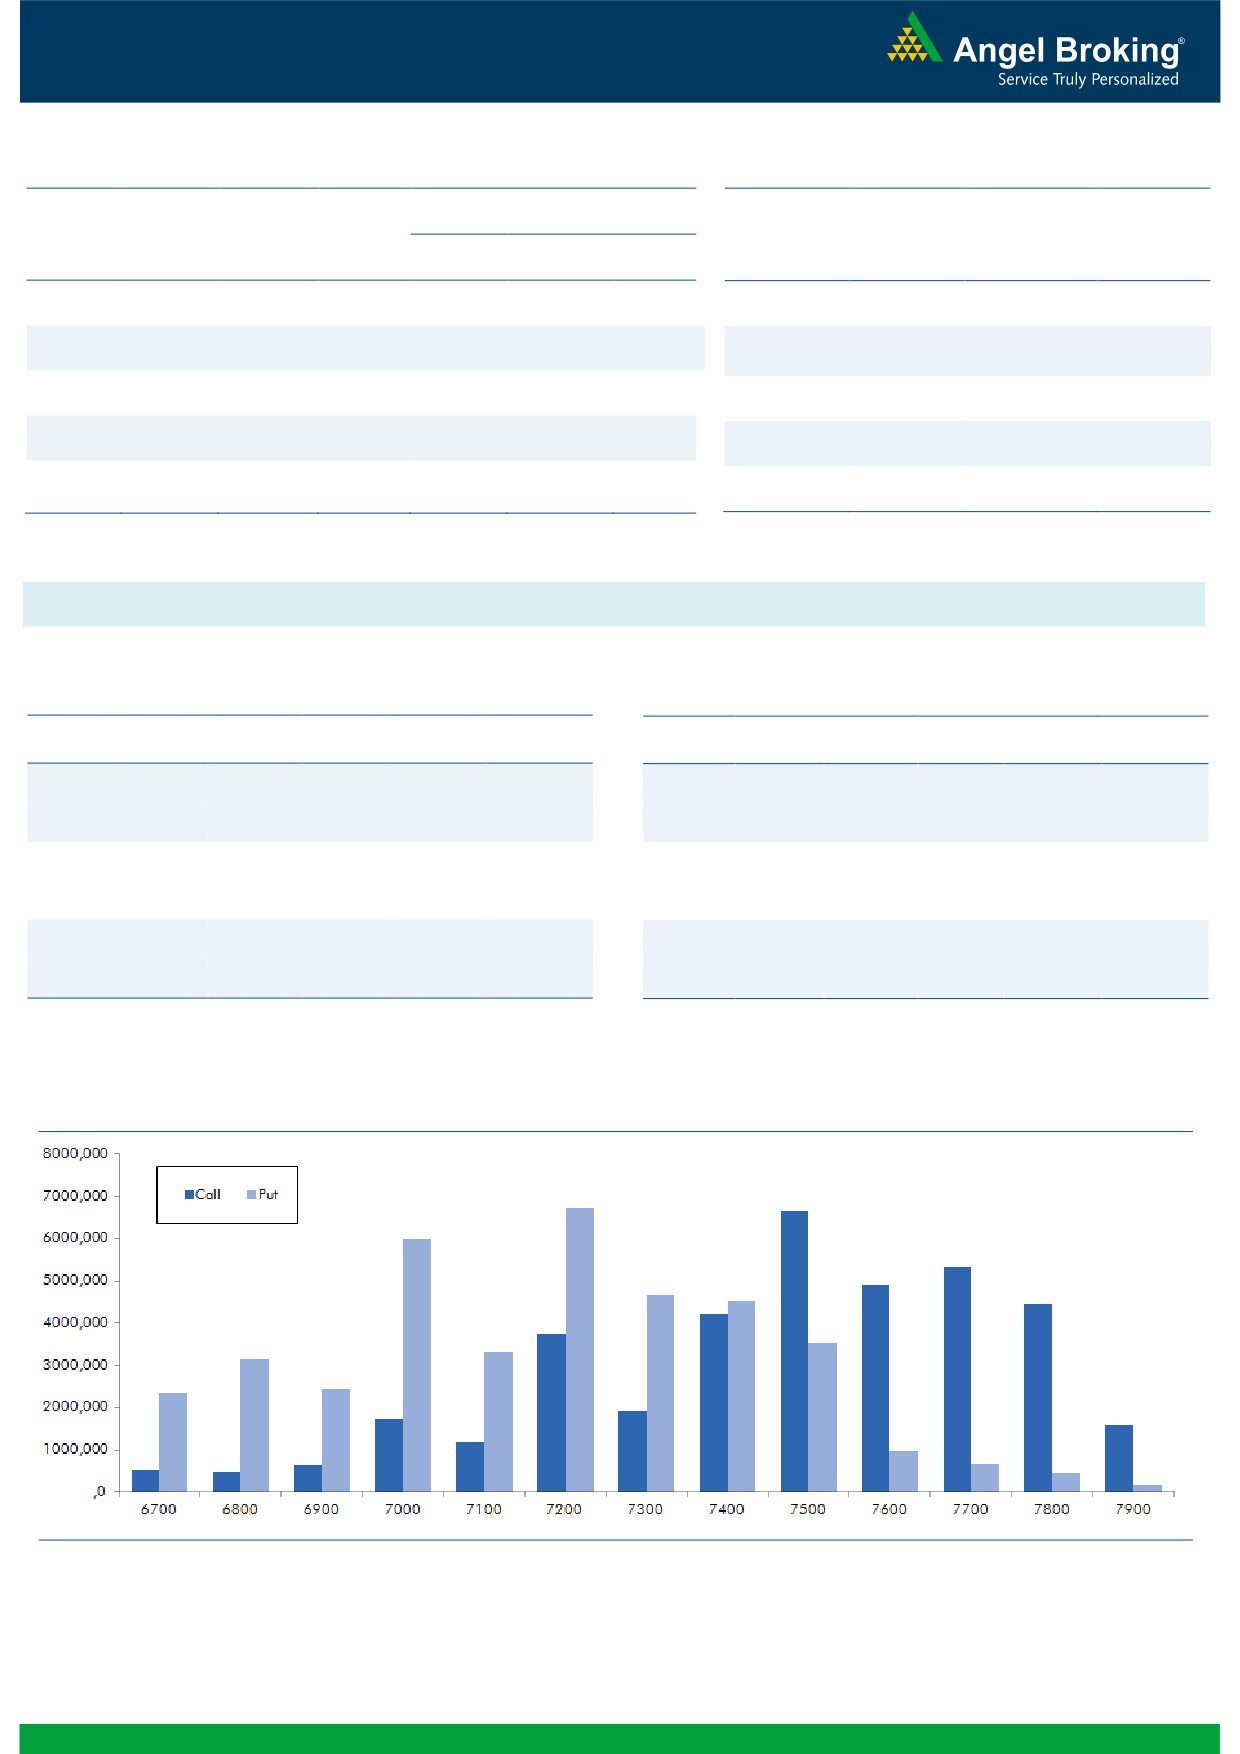
Nifty Vs OI
The Nifty futures open interest has increased by 1.31%
BankNifty futures open interest has decreased by 1.88%
as market closed at 7510.20 levels.
The Nifty March future closed at a premium of 2.00
points against a discount of 2.45 points. The April series
closed at a premium of 38.55 points.
The Implied Volatility of at the money options has
decreased from 15.53% to 14.33%.
The total OI of the market is Rs. 2,23,644/- cr. and the
stock futures OI is Rs. 55,606/- cr.
Few of the liquid counters where we have seen high cost
of carry are UNITECH, FEDERALBNK, GMRINFRA,
ADANIPOWER and ABIRLANUVO.
Views
OI Gainers
FIIs continue buying in both cash and F&O segment.
OI
PRICE
SCRIP
OI
PRICE
They bought equities to the tune of Rs. 378 crores. While
CHG. (%)
CHG. (%)
in Index Futures, they were net buyers of Rs. 932 crores
MCDOWELL-N
816000
28.71
2401.45
1.64
with good amount of rise in OI, suggesting fresh long
CUMMINSIND
58200
18.29
851.80
-0.28
formation in last trading session.
COALINDIA
18512400
16.25
291.80
-1.00
In Index Options front, FIIs sold marginally with some
HDIL
22674000
14.24
69.75
-2.17
rise in OI. The overall activity in call was muted but 7800
TATAELXSI
308100
8.33
1960.45
-0.47
strike was comparatively active on Friday. While in put
options, 7500 strike added some OI, followed by decent
OI Losers
unwinding in 7100 put option. Maximum OI in current
OI
PRICE
SCRIP
OI
PRICE
series is visible in 7500 call and of put options got shifted
CHG. (%)
CHG. (%)
from 7000 to 7200 put options. Despite market being
CONCOR
1459200
-23.20
1155.10
-0.62
range bound in last two-three trading sessions, FIIs
MINDTREE
3052000
-5.80
663.85
-1.33
continue to pour in liquidity in our market. In fact, in
HAVELLS
2886000
-5.25
291.00
2.30
Index Future good amount of long were formed on the
CEATLTD
1190700
-4.92
1053.85
-0.78
higher levels, trade optimistically.
HINDPETRO
6569400
-4.90
726.05
0.84
Historical Volatility
Put-Call Ratio
SCRIP
HV
SCRIP
PCR-OI
PCR-VOL
MARICO
32.18
NIFTY
0.96
0.90
VOLTAS
60.40
BANKNIFTY
1.05
0.81
CAIRN
65.34
SBIN
0.73
0.44
HAVELLS
41.88
ICICIBANK
0.85
0.72
CESC
37.92
RELIANCE
0.55
0.46
Strategy Date
Symbol
Strategy
Status
February 29, 2016
RELIANCE
Ratio Bull Call Spread
Active
March 05, 2016
BHEL
Long Call Ladder
Active
2
Technical & Derivatives Report
March 14, 2016
FII Statistics for 11-March 2016
Turnover on 11-March 2016
Open Interest
No. of
Turnover
Change
Detail
Buy
Sell
Net
Instrument
Value
Change
Contracts
( in Cr. )
(%)
Contracts
(in Cr.)
(%)
INDEX
INDEX
1996.96
1065.35
931.61
312014
17095.10
4.98
367099
19065.93
20.54
FUTURES
FUTURES
INDEX
INDEX
35240.06
35346.58
(106.52)
1369477
76069.60
2.35
3780694
208534.53
18.89
OPTIONS
OPTIONS
STOCK
2817.27
3195.45
(378.19)
1046442
47160.88
(0.72)
STOCK
FUTURES
502840
23450.64
-1.47
FUTURES
STOCK
STOCK
2039.00
2053.39
(14.38)
73706
3344.55
4.67
OPTIONS
257800
12393.74
-3.17
OPTIONS
TOTAL
42093.29
41660.77
432.53
2801639
143670.12
1.52
TOTAL
4908433
263444.83
15.64
Nifty Spot = 7510.20
Lot Size = 75
Bull-Call Spreads
Bear-Put Spreads
Action
Strike
Price
Risk
Reward
BEP
Action
Strike
Price
Risk
Reward
BEP
Buy
7500
109.80
Buy
7500
98.55
46.20
53.80
7546.20
35.95
64.05
7464.05
Sell
7600
63.60
Sell
7400
62.60
Buy
7500
109.80
Buy
7500
98.55
76.55
123.45
7576.55
58.90
141.10
7441.10
Sell
7700
33.25
Sell
7300
39.65
Buy
7600
63.60
Buy
7400
62.60
30.35
69.65
7630.35
22.95
77.05
7377.05
Sell
7700
33.25
Sell
7300
39.65
Note: Above mentioned Bullish or Bearish Spreads in Nifty (March Series) are given as an information and not as a recommendation.
Nifty Put-Call Analysis
3
Technical & Derivatives Report
March 14, 2016
Daily Pivot Levels for Nifty 50 Stocks
Scrips
S2
S1
PIVOT
R1
R2
ACC
1,208
1,217
1,228
1,237
1,248
ADANIPORTS
223
227
230
234
237
AMBUJACEM
198
199
201
202
204
ASIANPAINT
886
892
898
904
910
AXISBANK
401
407
414
420
428
BAJAJ-AUTO
2,291
2,308
2,328
2,345
2,365
BANKBARODA
135
138
140
143
145
BHARTIARTL
332
335
337
339
341
BHEL
101
103
104
105
106
BOSCHLTD
17,645
17,831
18,036
18,222
18,427
BPCL
785
794
805
814
824
CAIRN
137
142
145
150
153
CIPLA
527
531
535
538
542
COALINDIA
311
315
320
324
329
DRREDDY
3,159
3,185
3,204
3,229
3,248
GAIL
332
336
340
344
349
GRASIM
3,527
3,555
3,593
3,621
3,659
HCLTECH
808
815
820
828
833
HDFC
1,138
1,149
1,158
1,170
1,179
HDFCBANK
1,006
1,018
1,024
1,035
1,042
HEROMOTOCO
2,773
2,793
2,816
2,836
2,859
HINDALCO
80
82
83
85
86
HINDUNILVR
821
836
847
863
873
ICICIBANK
209
211
215
217
221
IDEA
99
100
103
105
108
INDUSINDBK
911
919
926
934
941
INFY
1,128
1,135
1,146
1,153
1,163
ITC
312
317
319
324
326
KOTAKBANK
629
636
647
654
666
LT
1,156
1,171
1,186
1,201
1,217
LUPIN
1,793
1,824
1,844
1,875
1,895
M&M
1,204
1,212
1,224
1,232
1,244
MARUTI
3,575
3,608
3,649
3,682
3,723
NTPC
124
125
127
128
130
ONGC
200
202
205
208
210
PNB
79
81
82
83
84
POWERGRID
136
137
139
140
142
RELIANCE
999
1,007
1,018
1,026
1,037
SBIN
175
178
180
183
185
VEDL
84
86
87
89
91
SUNPHARMA
834
851
861
878
887
TATAMOTORS
341
348
352
358
363
TATAPOWER
58
59
59
59
60
TATASTEEL
286
290
294
298
302
TCS
2,308
2,337
2,364
2,392
2,420
TECHM
447
452
461
467
476
ULTRACEMCO
2,954
2,974
2,992
3,012
3,029
WIPRO
534
537
538
541
542
YESBANK
778
789
797
808
816
ZEEL
385
392
397
404
409
4
Technical & Derivatives Report
March 14, 2016
Research Team Tel: 022 - 39357800
For Technical Queries
For Derivatives Queries
DISCLAIMER
Angel Broking Private Limited (hereinafter referred to as “Angel”) is a registered Member of National Stock Exchange of India Limited,
Bombay Stock Exchange Limited and MCX Stock Exchange Limited. It is also registered as a Depository Participant with CDSL and
Portfolio Manager with SEBI. It also has registration with AMFI as a Mutual Fund Distributor. Angel Broking Private Limited is a
registered entity with SEBI for Research Analyst in terms of SEBI (Research Analyst) Regulations, 2014 vide registration number
INH000000164. Angel or its associates has not been debarred/ suspended by SEBI or any other regulatory authority for accessing
/dealing in securities Market. Angel or its associates including its relatives/analyst do not hold any financial interest/beneficial
ownership of more than 1% in the company covered by Analyst. Angel or its associates/analyst has not received any compensation /
managed or co-managed public offering of securities of the company covered by Analyst during the past twelve months. Angel/analyst
has not served as an officer, director or employee of company covered by Analyst and has not been engaged in market making activity
of the company covered by Analyst.
This document is solely for the personal information of the recipient, and must not be singularly used as the basis of any investment
decision. Nothing in this document should be construed as investment or financial advice. Each recipient of this document should
make such investigations as they deem necessary to arrive at an independent evaluation of an investment in the securities of the
companies referred to in this document (including the merits and risks involved), and should consult their own advisors to determine
the merits and risks of such an investment.
Reports based on technical and derivative analysis center on studying charts of a stock's price movement, outstanding positions and
trading volume, as opposed to focusing on a company's fundamentals and, as such, may not match with a report on a company's
fundamentals.
The information in this document has been printed on the basis of publicly available information, internal data and other reliable
sources believed to be true, but we do not represent that it is accurate or complete and it should not be relied on as such, as this
document is for general guidance only. Angel Broking Pvt. Limited or any of its affiliates/ group companies shall not be in any way
responsible for any loss or damage that may arise to any person from any inadvertent error in the information contained in this report.
Angel Broking Pvt. Limited has not independently verified all the information contained within this document. Accordingly, we cannot
testify, nor make any representation or warranty, express or implied, to the accuracy, contents or data contained within this document.
While Angel Broking Pvt. Limited endeavors to update on a reasonable basis the information discussed in this material, there may be
regulatory, compliance, or other reasons that prevent us from doing so.
This document is being supplied to you solely for your information, and its contents, information or data may not be reproduced,
redistributed or passed on, directly or indirectly.
Neither Angel Broking Pvt. Limited, nor its directors, employees or affiliates shall be liable for any loss or damage that may arise from
or in connection with the use of this information.
Note: Please refer to the important ‘Stock Holding Disclosure' report on the Angel website (Research Section). Also, please refer to the
latest update on respective stocks for the disclosure status in respect of those stocks. Angel Broking Pvt. Limited and its affiliates may
have investment positions in the stocks recommended in this report.
5