Technical & Derivatives Report
January 14, 2016
Sensex (24854) / Nifty (7562)
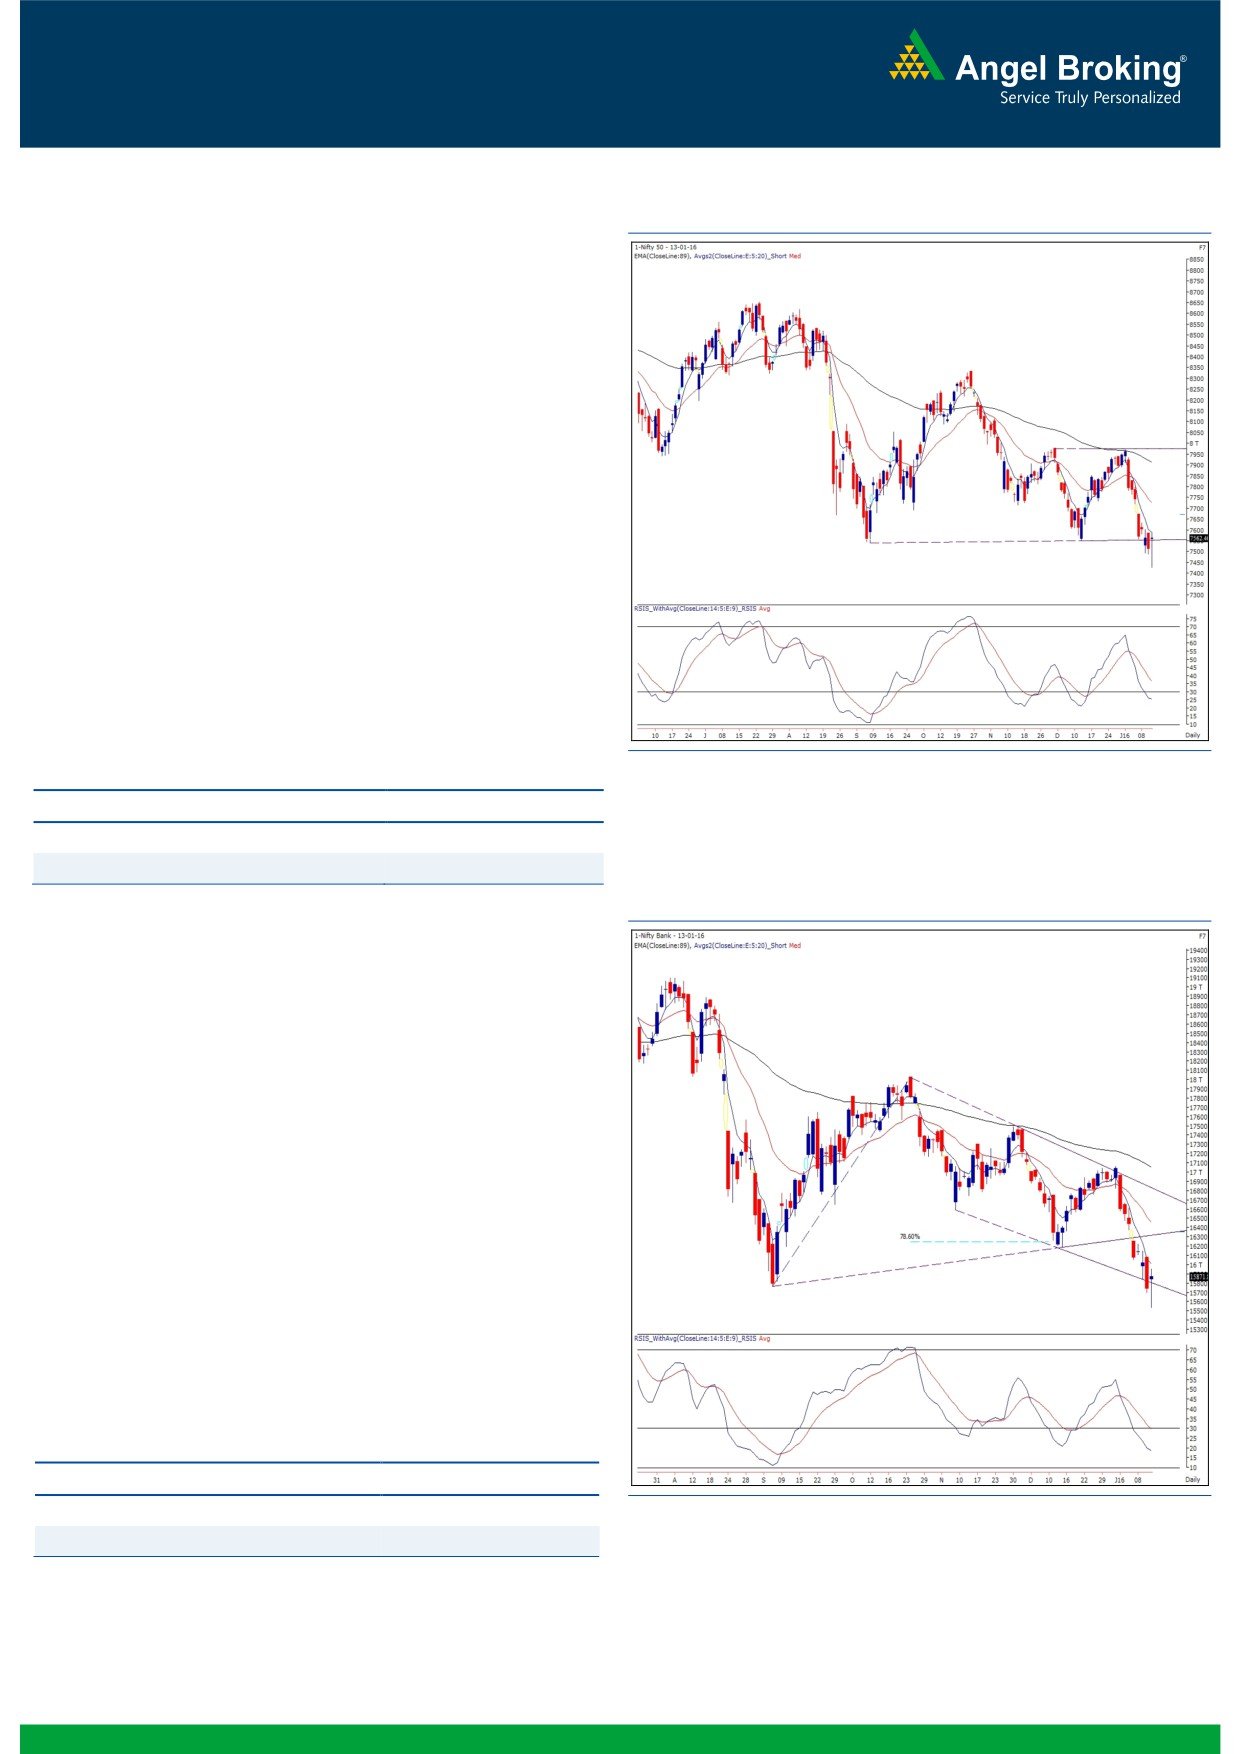
Exhibit 1: Nifty Daily Chart
Yesterday, our markets opened higher owing to positive global
cues. The index extended these gains in the initial hour of the
trade. However, post the initial hour, we witnessed a complete
roller coaster ride in our market. Firstly, the Nifty took a
nosedive after facing a resistance around previous day’s high
of 7588. The selling pressure was so immense that index
almost tested our mentioned level of 7420 in no time. Things
were looking extremely bleak; but, quite surprisingly to most of
the traders; we witnessed a v-shaped recovery in the second
half to pull the index well inside the positive territory.
The daily chart now depicts a 'Doji' pattern. However, we
maintian our view that the Nifty is likely to continue this down
move as long as it maintains its position below the resistance
zone of 7600 - 7620. Only a sustainable move above this
level extends this bounce towards 7650 - 7680 levels. On the
flipside, immediate support levels are seen around 7490 -
7450 levels.
Key Levels
Support 1 - 7490
Resistance 1 - 7620
Support 2 - 7450
Resistance 2 - 7650
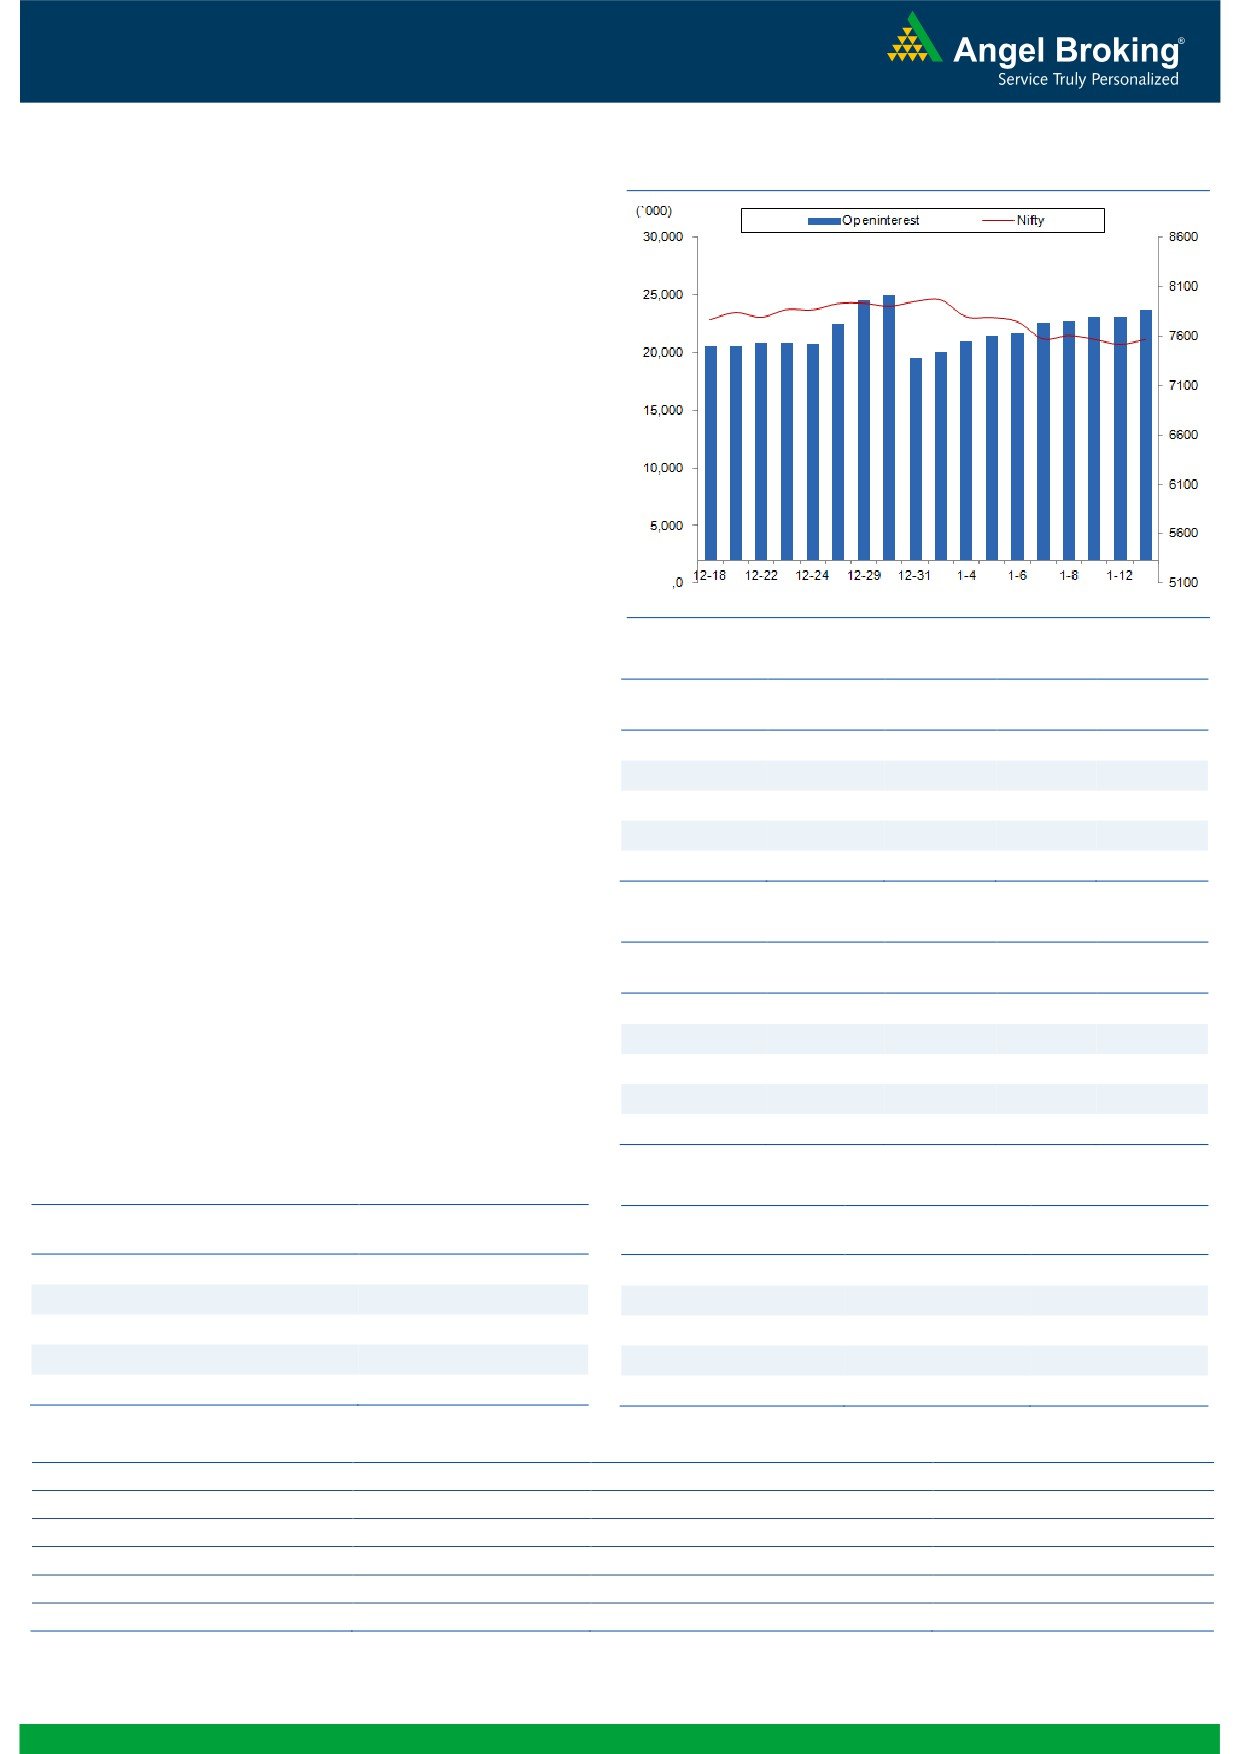
Exhibit 2: Bank Nifty Daily Chart
Bank Nifty Outlook - (15872)
Yesterday, the Nifty Bank index opened with gains of around
100 points and started moving higher in the initial trades. But,
the up move was short lived as we witnessed a sharp selling
pressure in the first half of the session during which the
banking index corrected up to 15532.25 level. However, the
Bulls showed tremendous strength at lower levels and
surprised most of the participants by making new intraday
high of 15956.25. Eventually, the banking index ended the
session with gains of 0.87 percent over its previous close.
The resilience shown by the Bulls is a positive trigger for
banking conglomerates. We continue our bullish stance on the
Nifty Bank index and advise traders to buy BankNifty future on
any intraday correction with a stop loss of 15480 levels.
Going forward, 15530 - 15480 zone will act as a strong
support for the index. On the flipside, intraday resistance is
placed at 16000 and 16230 levels.
Key Levels
Support 1 - 15530
Resistance 1 - 16000
Support 2 - 15400
Resistance 2 - 16230
1
Technical & Derivatives Report
January 14, 2016
Comments
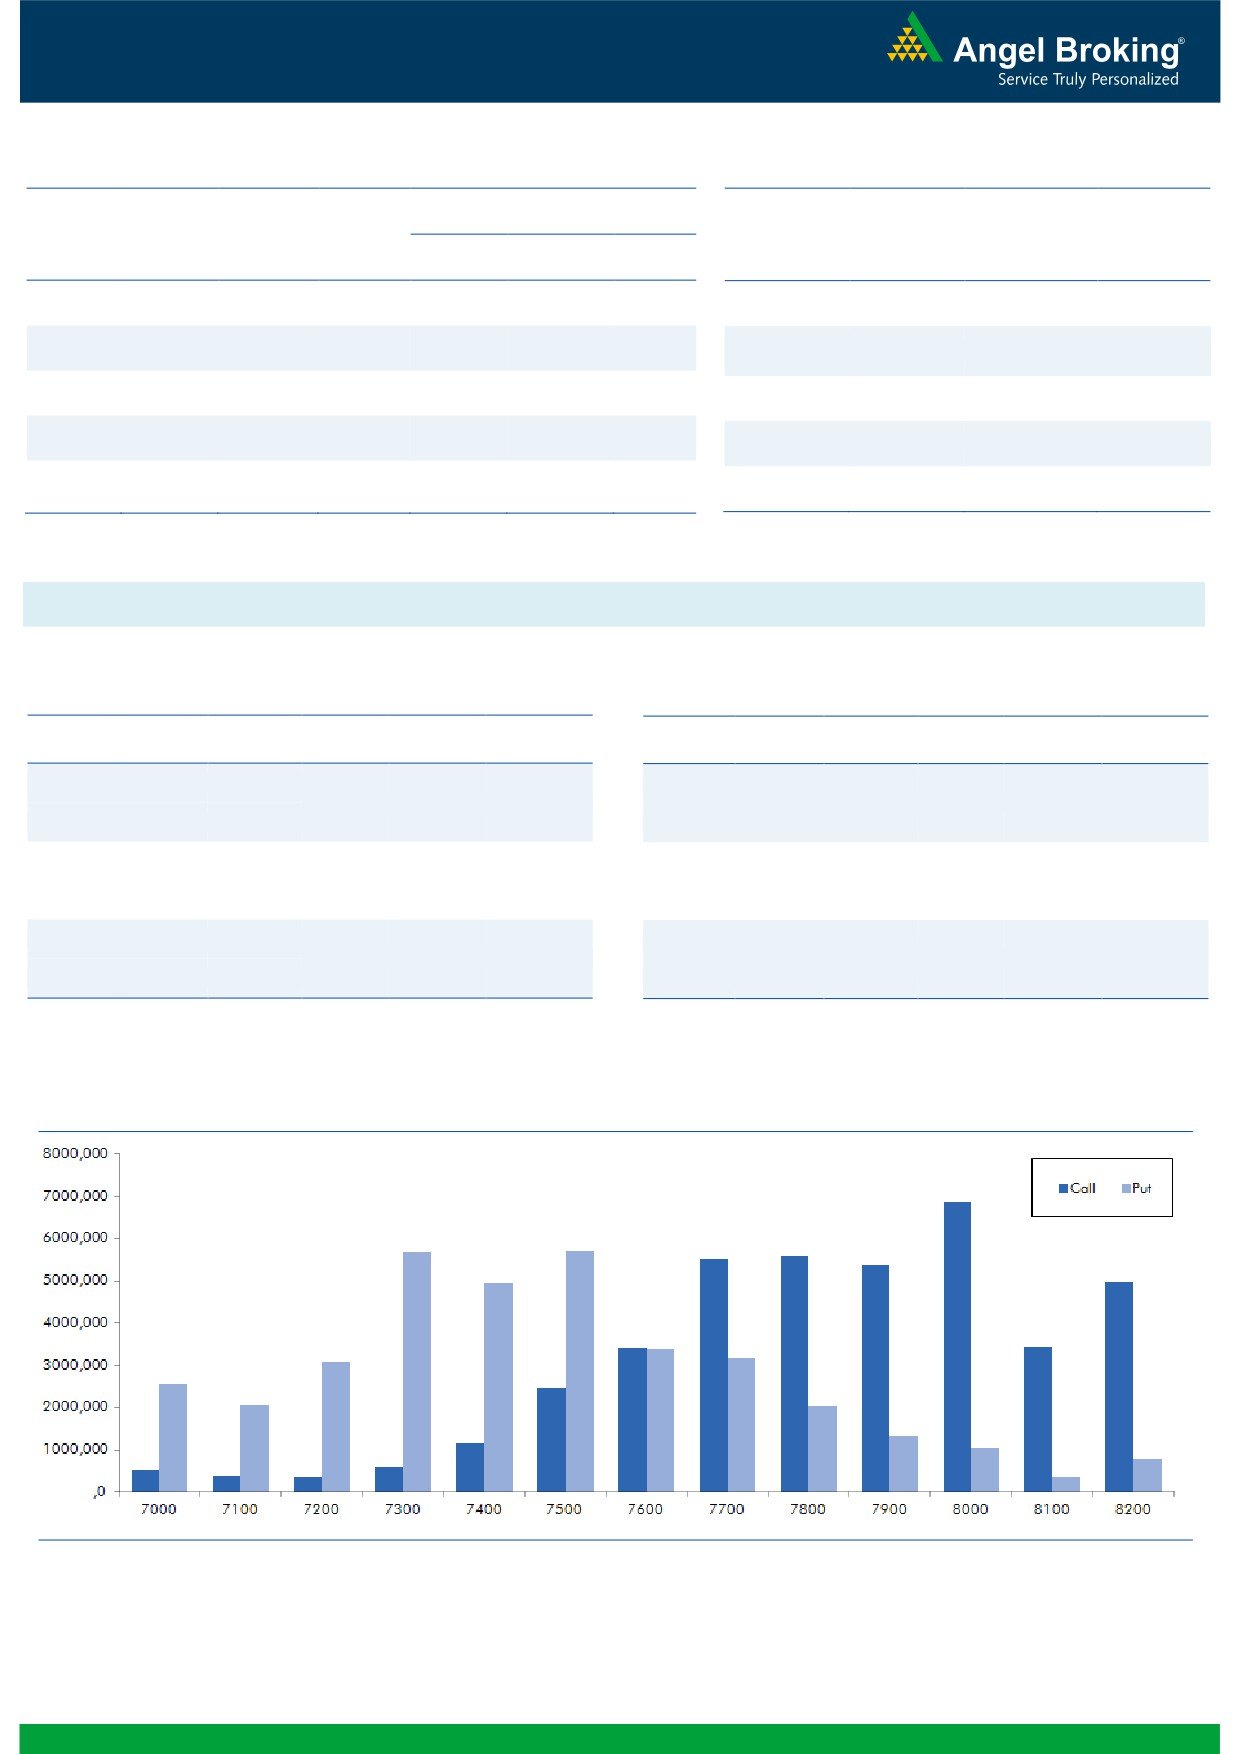
Nifty Vs OI
The Nifty futures open interest has increased by 2.48%
BankNifty futures open interest has decreased by 5.09%
as market closed at 7562.40 levels.
The Nifty January future closed at a premium of 12.15
points against a premium of 23.75 points. The February
series closed at a premium of 34.70 points.
The Implied Volatility of at the money options has
decreased from 17.99% to 17.15 %.
The total OI of the market is Rs. 2,38,417/- cr. and the
stock futures OI is Rs. 64,524/- cr.
Few of the liquid counters where we have seen high cost
of carry are GMRINFRA, JINDALSTEL, JSWENERGY, SRF
and HEXAWARE.
OI Gainers
Views
OI
PRICE
In equity segment, FIIs activity was subdued. In Index
SCRIP
OI
PRICE
CHG. (%)
CHG. (%)
Futures, they were net buyers of worth Rs. 322 with
BANKINDIA
33726000
16.73
94.55
-6.29
marginal change in OI, which suggest blend of both
ULTRACEMCO
1458400
13.11
2676.15
0.45
long formations and short covering in last trading
DABUR
4038000
11.18
257.70
0.64
session.
IDBI
45248000
8.85
70.20
-5.07
In Index Options front, they bought of Rs. 534 crores with
POWERGRID
17292000
7.97
142.75
-0.38
good amount of rise in open interest. Yesterday we
hardly saw fresh OI build-up in both call and put
OI Losers
options. Decent unwinding was seen in
8100 call
OI
PRICE
options. Maximum build-up in current series is visible in
SCRIP
OI
PRICE
CHG. (%)
CHG. (%)
8000 call and 7500 put options. In this correction, we
RELINFRA
11986000
-11.96
547.55
-4.75
are hardly witnessing any meaningful short formation in
GODREJCP
140800
-11.56
1272.20
0.09
Nifty. We don’t expect major downside from current
CADILAHC
8760000
-8.62
321.30
0.09
levels, avoid forming shorts.
HINDZINC
1872000
-7.44
141.65
0.11
HINDALCO
44405000
-6.21
77.05
1.58
Historical Volatility
Put-Call Ratio
SCRIP
HV
SCRIP
PCR-OI
PCR-VOL
BANKINDIA
52.77
NIFTY
0.80
0.71
INFY
28.84
BANKNIFTY
0.82
0.65
CANBK
42.84
SBIN
0.35
0.34
RELIANCE
32.52
INFY
0.68
0.61
TCS
23.19
TCS
1.17
1.12
Strategy Date
Symbol
Strategy
Status
January 04, 2016
SBIN
Ratio Bear Put Spread
Active
January 11, 2016
TCS
Short Strangle
Active
2
Technical & Derivatives Report
January 14, 2016
FII Statistics for 13-January 2015
Turnover on 13-January 2015
Open Interest
No. of
Turnover
Change
Detail
Buy
Sell
Net
Instrument
Value
Change
Contracts
( in Cr. )
(%)
Contracts
(in Cr.)
(%)
INDEX
INDEX
2470.00
2147.90
322.09
285174
15646.01
(0.08)
485012
25826.67
72.96
FUTURES
FUTURES
INDEX
INDEX
46699.18
46164.55
534.63
1302617
72893.06
4.08
5276666
296758.22
99.12
OPTIONS
OPTIONS
STOCK
5486.90
4955.91
530.99
1072680
50434.59
0.56
STOCK
FUTURES
732345
36174.14
42.16
FUTURES
STOCK
STOCK
5392.66
5406.06
(13.40)
77976
3699.36
17.95
OPTIONS
525244
26846.27
62.58
OPTIONS
TOTAL
60048.75
58674.43
1374.32
2738447
142673.01
2.57
TOTAL
7019267
385605.30
87.26
Nifty Spot = 7562.40
Lot Size = 75
Bull-Call Spreads
Bear-Put Spreads
Action
Strike
Price
Risk
Reward
BEP
Action
Strike
Price
Risk
Reward
BEP
Buy
7600
91.25
Buy
7500
76.10
39.65
60.35
7639.65
27.85
72.15
7472.15
Sell
7700
51.60
Sell
7400
48.25
Buy
7600
91.25
Buy
7500
76.10
64.40
135.60
7664.40
45.60
154.40
7454.40
Sell
7800
26.85
Sell
7300
30.50
Buy
7700
51.60
Buy
7400
48.25
24.75
75.25
7724.75
17.75
82.25
7382.25
Sell
7800
26.85
Sell
7300
30.50
Note: Above mentioned Bullish or Bearish Spreads in Nifty (Jan. Series) are given as an information and not as a recommendation.
Nifty Put-Call Analysis
3
Technical & Derivatives Report
January 14, 2016
Daily Pivot Levels for Nifty 50 Stocks
Scrips
S2
S1
PIVOT
R1
R2
ACC
1,253
1,268
1,281
1,295
1,308
ADANIPORTS
214
222
231
239
248
AMBUJACEM
192
195
197
200
202
ASIANPAINT
834
851
867
885
901
AXISBANK
385
396
404
415
423
BAJAJ-AUTO
2,308
2,339
2,363
2,394
2,419
BANKBARODA
122
127
132
137
142
BHARTIARTL
291
300
311
320
332
BHEL
138
143
148
153
158
BOSCHLTD
17,554
17,778
18,041
18,264
18,527
BPCL
854
875
889
910
923
CAIRN
120
123
126
129
132
CIPLA
587
598
607
618
627
COALINDIA
310
314
317
321
324
DRREDDY
2,805
2,848
2,899
2,942
2,992
GAIL
349
356
365
372
381
GRASIM
3,440
3,484
3,539
3,583
3,638
HCLTECH
795
811
820
836
846
HDFC
1,134
1,151
1,162
1,179
1,191
HDFCBANK
1,028
1,044
1,053
1,070
1,079
HEROMOTOCO
2,396
2,435
2,460
2,499
2,524
HINDALCO
73
75
76
78
79
HINDUNILVR
805
819
828
841
850
ICICIBANK
226
233
238
245
250
IDEA
115
118
123
126
130
INDUSINDBK
901
919
932
950
963
INFY
1,031
1,057
1,074
1,100
1,117
ITC
311
313
317
319
323
KOTAKBANK
672
681
691
699
709
LT
1,094
1,125
1,160
1,191
1,226
LUPIN
1,603
1,635
1,678
1,709
1,753
M&M
1,161
1,183
1,199
1,221
1,236
MARUTI
4,186
4,238
4,274
4,327
4,363
NTPC
139
141
144
147
150
ONGC
215
219
222
226
228
PNB
93
95
98
101
104
POWERGRID
138
141
142
145
147
RELIANCE
1,029
1,053
1,071
1,095
1,114
SBIN
191
196
199
204
208
VEDL
75
78
82
85
89
SUNPHARMA
771
784
794
807
817
TATAMOTORS
350
357
364
371
377
TATAPOWER
62
64
66
68
70
TATASTEEL
230
238
245
253
260
TCS
2,215
2,247
2,287
2,319
2,359
TECHM
489
497
504
512
520
ULTRACEMCO
2,567
2,626
2,667
2,726
2,768
WIPRO
535
541
546
552
558
YESBANK
648
665
678
695
707
ZEEL
401
408
412
419
423
4
Technical & Derivatives Report
January 14, 2016
Research Team Tel: 022 - 39357800
For Technical Queries
For Derivatives Queries
DISCLAIMER
Angel Broking Private Limited (hereinafter referred to as “Angel”) is a registered Member of National Stock Exchange of India Limited,
Bombay Stock Exchange Limited and MCX Stock Exchange Limited. It is also registered as a Depository Participant with CDSL and
Portfolio Manager with SEBI. It also has registration with AMFI as a Mutual Fund Distributor. Angel Broking Private Limited is a
registered entity with SEBI for Research Analyst in terms of SEBI (Research Analyst) Regulations, 2014 vide registration number
INH000000164. Angel or its associates has not been debarred/ suspended by SEBI or any other regulatory authority for accessing
/dealing in securities Market. Angel or its associates including its relatives/analyst do not hold any financial interest/beneficial
ownership of more than 1% in the company covered by Analyst. Angel or its associates/analyst has not received any compensation /
managed or co-managed public offering of securities of the company covered by Analyst during the past twelve months. Angel/analyst
has not served as an officer, director or employee of company covered by Analyst and has not been engaged in market making activity
of the company covered by Analyst.
This document is solely for the personal information of the recipient, and must not be singularly used as the basis of any investment
decision. Nothing in this document should be construed as investment or financial advice. Each recipient of this document should
make such investigations as they deem necessary to arrive at an independent evaluation of an investment in the securities of the
companies referred to in this document (including the merits and risks involved), and should consult their own advisors to determine
the merits and risks of such an investment.
Reports based on technical and derivative analysis center on studying charts of a stock's price movement, outstanding positions and
trading volume, as opposed to focusing on a company's fundamentals and, as such, may not match with a report on a company's
fundamentals.
The information in this document has been printed on the basis of publicly available information, internal data and other reliable
sources believed to be true, but we do not represent that it is accurate or complete and it should not be relied on as such, as this
document is for general guidance only. Angel Broking Pvt. Limited or any of its affiliates/ group companies shall not be in any way
responsible for any loss or damage that may arise to any person from any inadvertent error in the information contained in this report.
Angel Broking Pvt. Limited has not independently verified all the information contained within this document. Accordingly, we cannot
testify, nor make any representation or warranty, express or implied, to the accuracy, contents or data contained within this document.
While Angel Broking Pvt. Limited endeavors to update on a reasonable basis the information discussed in this material, there may be
regulatory, compliance, or other reasons that prevent us from doing so.
This document is being supplied to you solely for your information, and its contents, information or data may not be reproduced,
redistributed or passed on, directly or indirectly.
Neither Angel Broking Pvt. Limited, nor its directors, employees or affiliates shall be liable for any loss or damage that may arise from
or in connection with the use of this information.
Note: Please refer to the important ‘Stock Holding Disclosure' report on the Angel website (Research Section). Also, please refer to the
latest update on respective stocks for the disclosure status in respect of those stocks. Angel Broking Pvt. Limited and its affiliates may
have investment positions in the stocks recommended in this report.
5