Technical & Derivatives Report
October 13, 2016
Sensex (28082) / Nifty (8709)
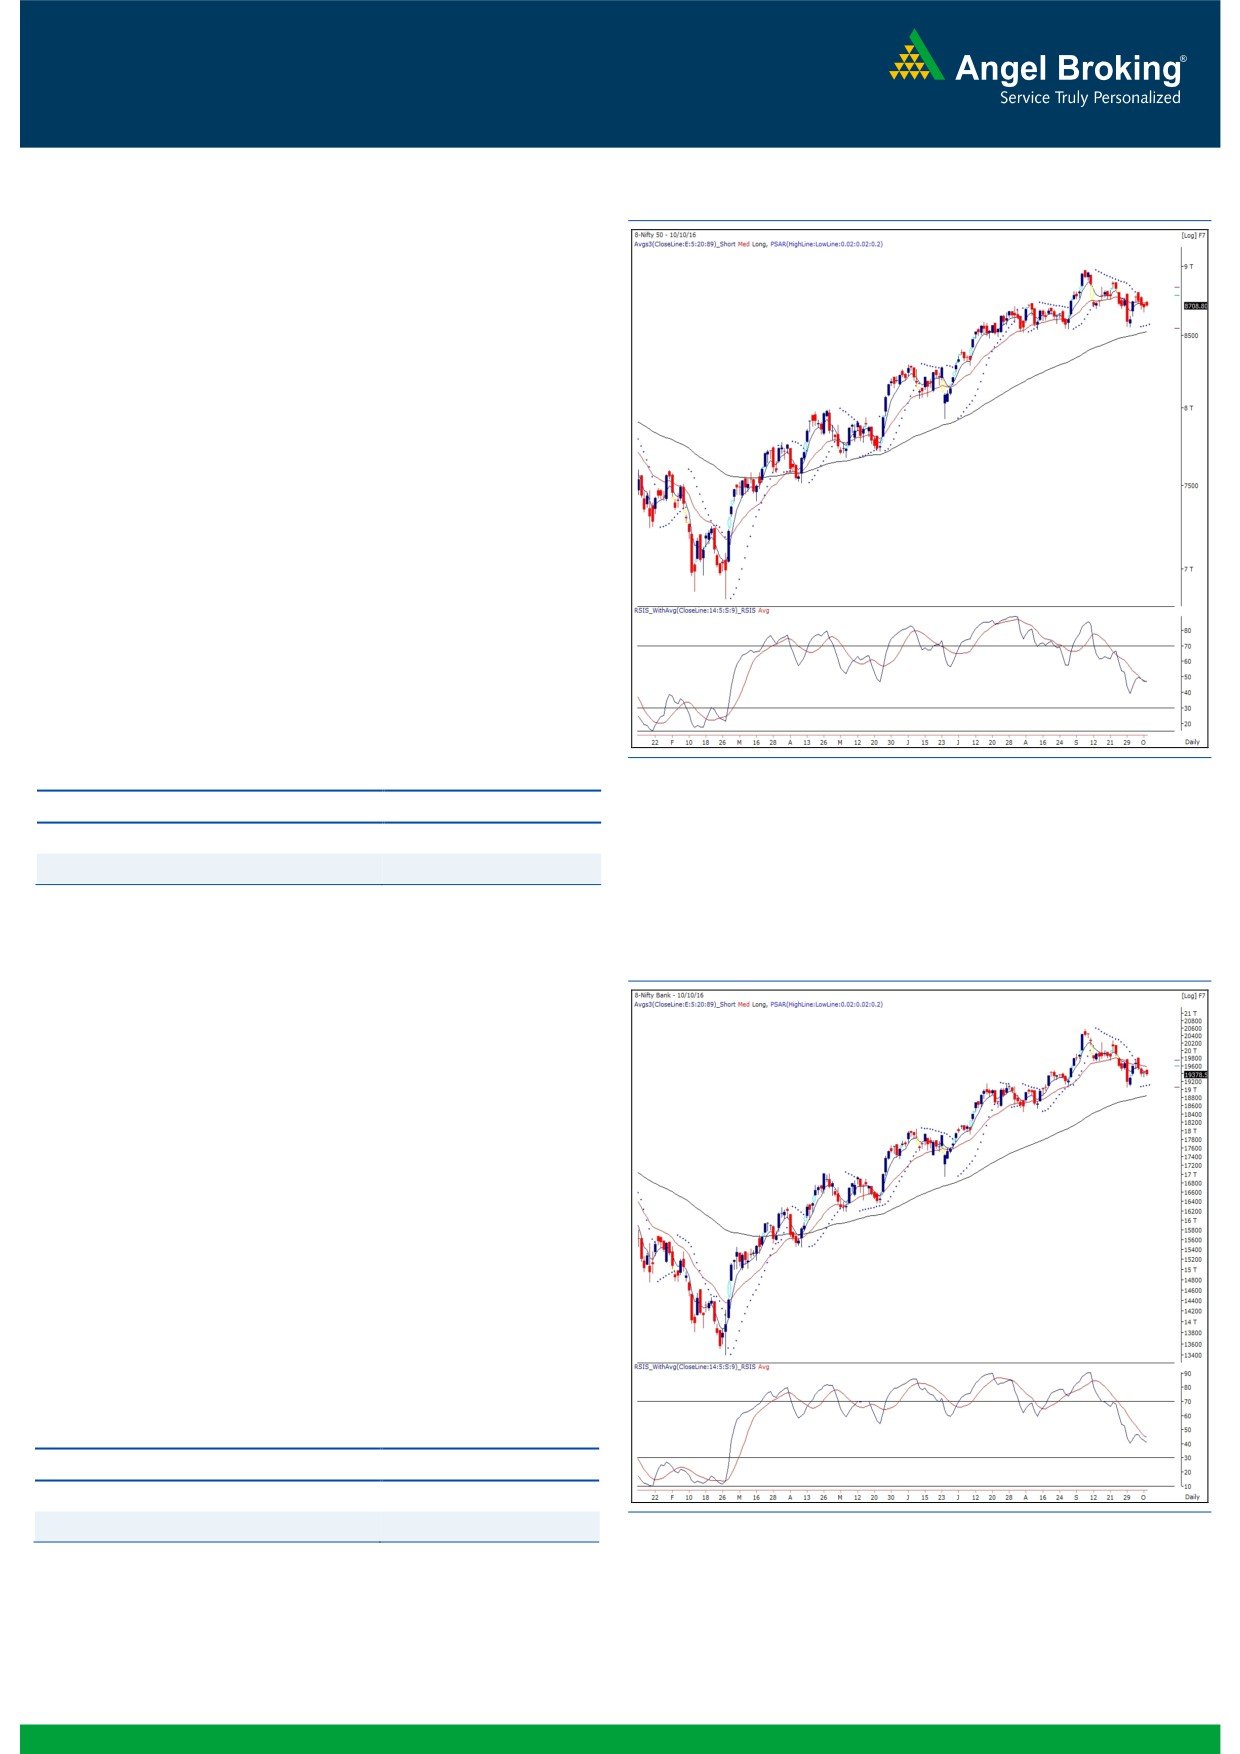
Exhibit 1: Nifty Daily Chart
On Monday, our markets opened marginally higher owing to
positive global cues. However, the lead was very short lived as the
index pared down major portion of gains in the initial trades. This
was followed by a consolidation within a narrow range
throughout the remaining part of the session to conclude tad
above the 8700 mark.
Monday’s lethargic movement was quite obvious taking into a
consideration two-days off for our markets. The volume activity
was lower than average and hence, we witnessed a narrow range
activity throughout the day. Since there was no major price action,
the chart structure remains unchanged so as our view on the
market. On the downside, 8663 - 8635 can be seen as an
immediate support for the market; whereas, the intraday
resistance zone is placed at 8745 - 8781 levels. To summarize,
we expect some consolidation occurrences in the forthcoming
sessions as well. Thus, it is advisable for traders to concentrate on
stock specific moves in order to find potential trades.
Key Levels
Support 1 - 8663
Resistance 1 - 8745
Support 2 - 8635
Resistance 2 - 8781
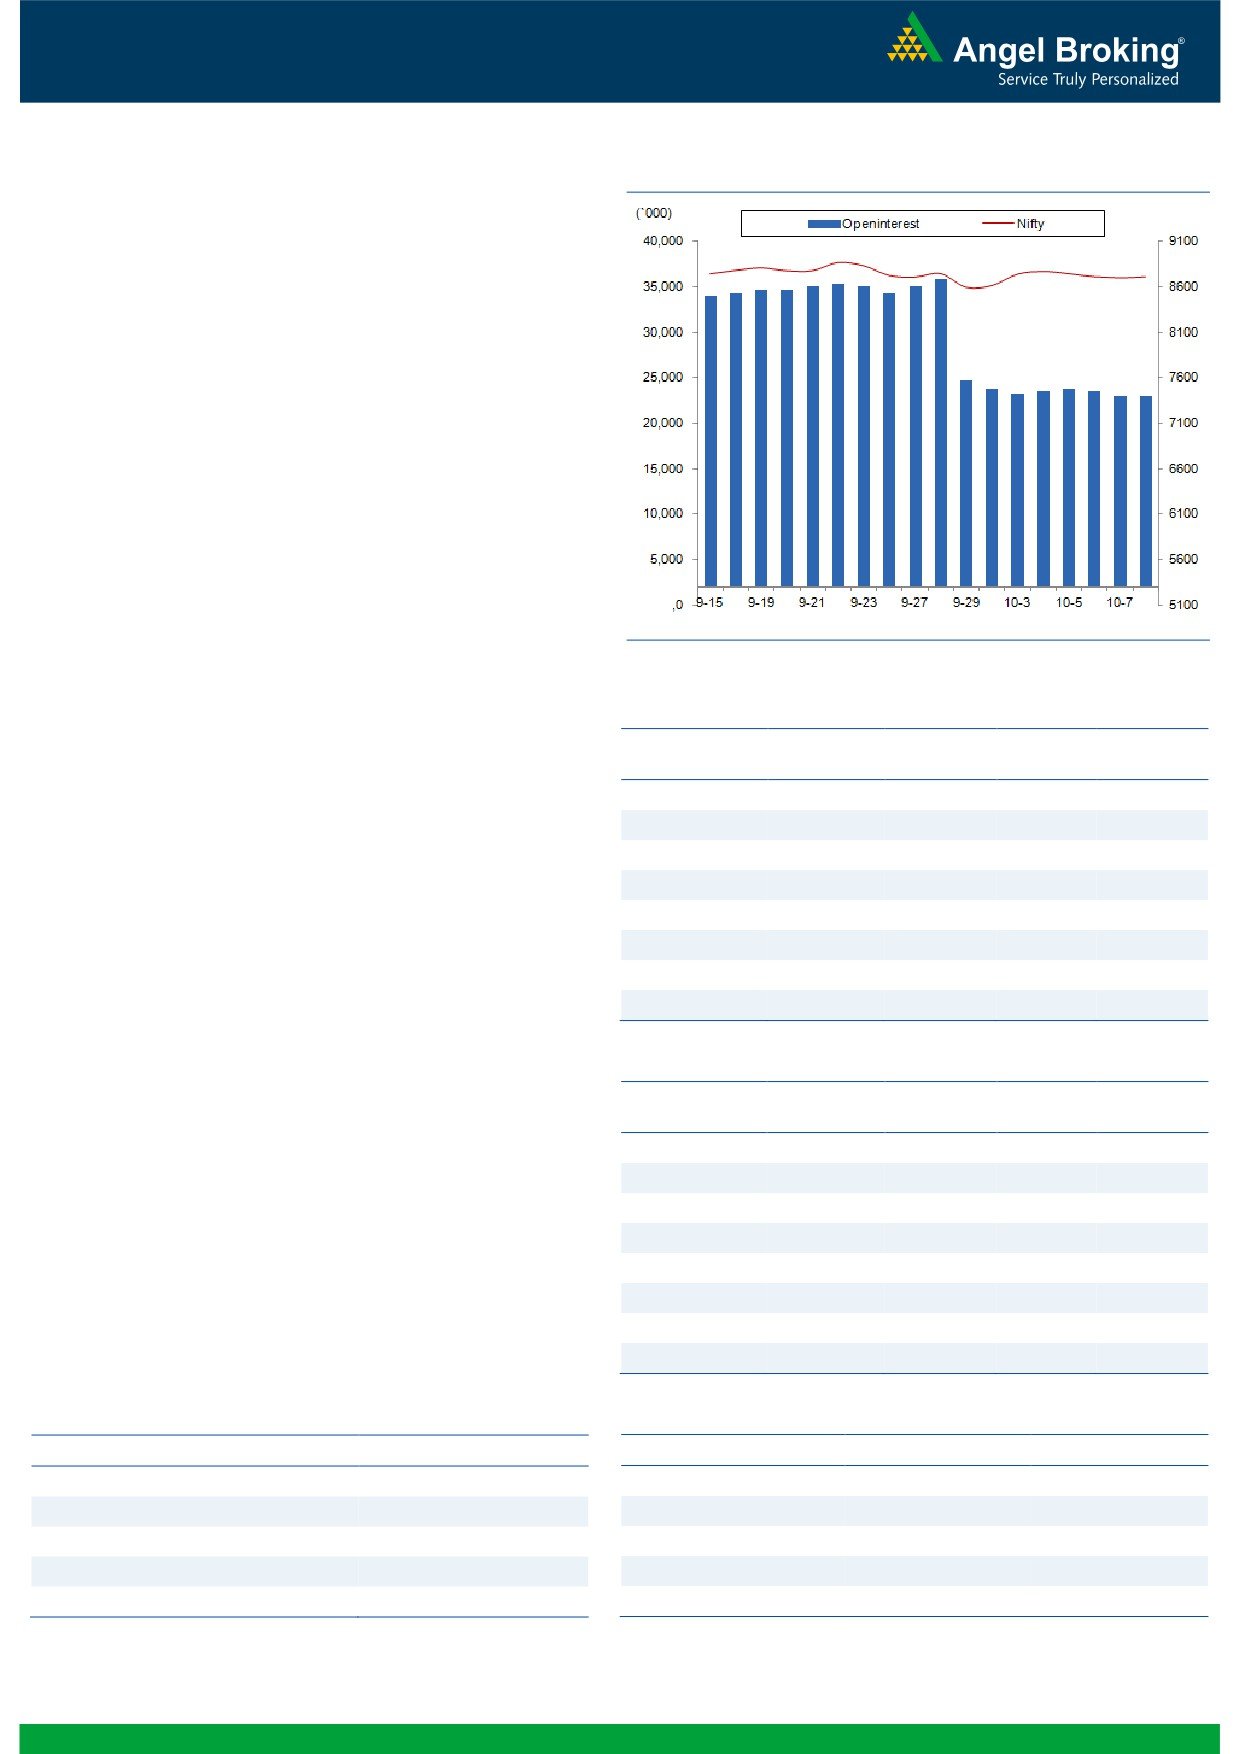
Exhibit 2: Nifty Bank Daily Chart
Nifty Bank Outlook - (19379)
The Nifty Bank index opened with marginal gains on Monday and
consolidated in a narrow range as traders remained cautious of
taking aggressive positions ahead of two days holiday for our
market. Eventually, the banking index ended the session on a flat
note.
Due to the range-bound trading sessions, there has been no
further development on the charts. Hence, we reiterate our view to
remain cautious on the index untill we see the index crossing the
resistance of 19800 or any reversal sign on the charts. Traders
are advised to stay light on positions and trade with proper risk
management. The intraday support for the Nifty Bank index are
placed around 19300 and 19220 whereas resistance is seen in
range of 19525 - 19570.
Key Levels
Support 1 - 19300
Resistance 1 - 19525
Support 2 - 19220
Resistance 2 - 19570
1
Technical & Derivatives Report
October 13, 2016
Comments
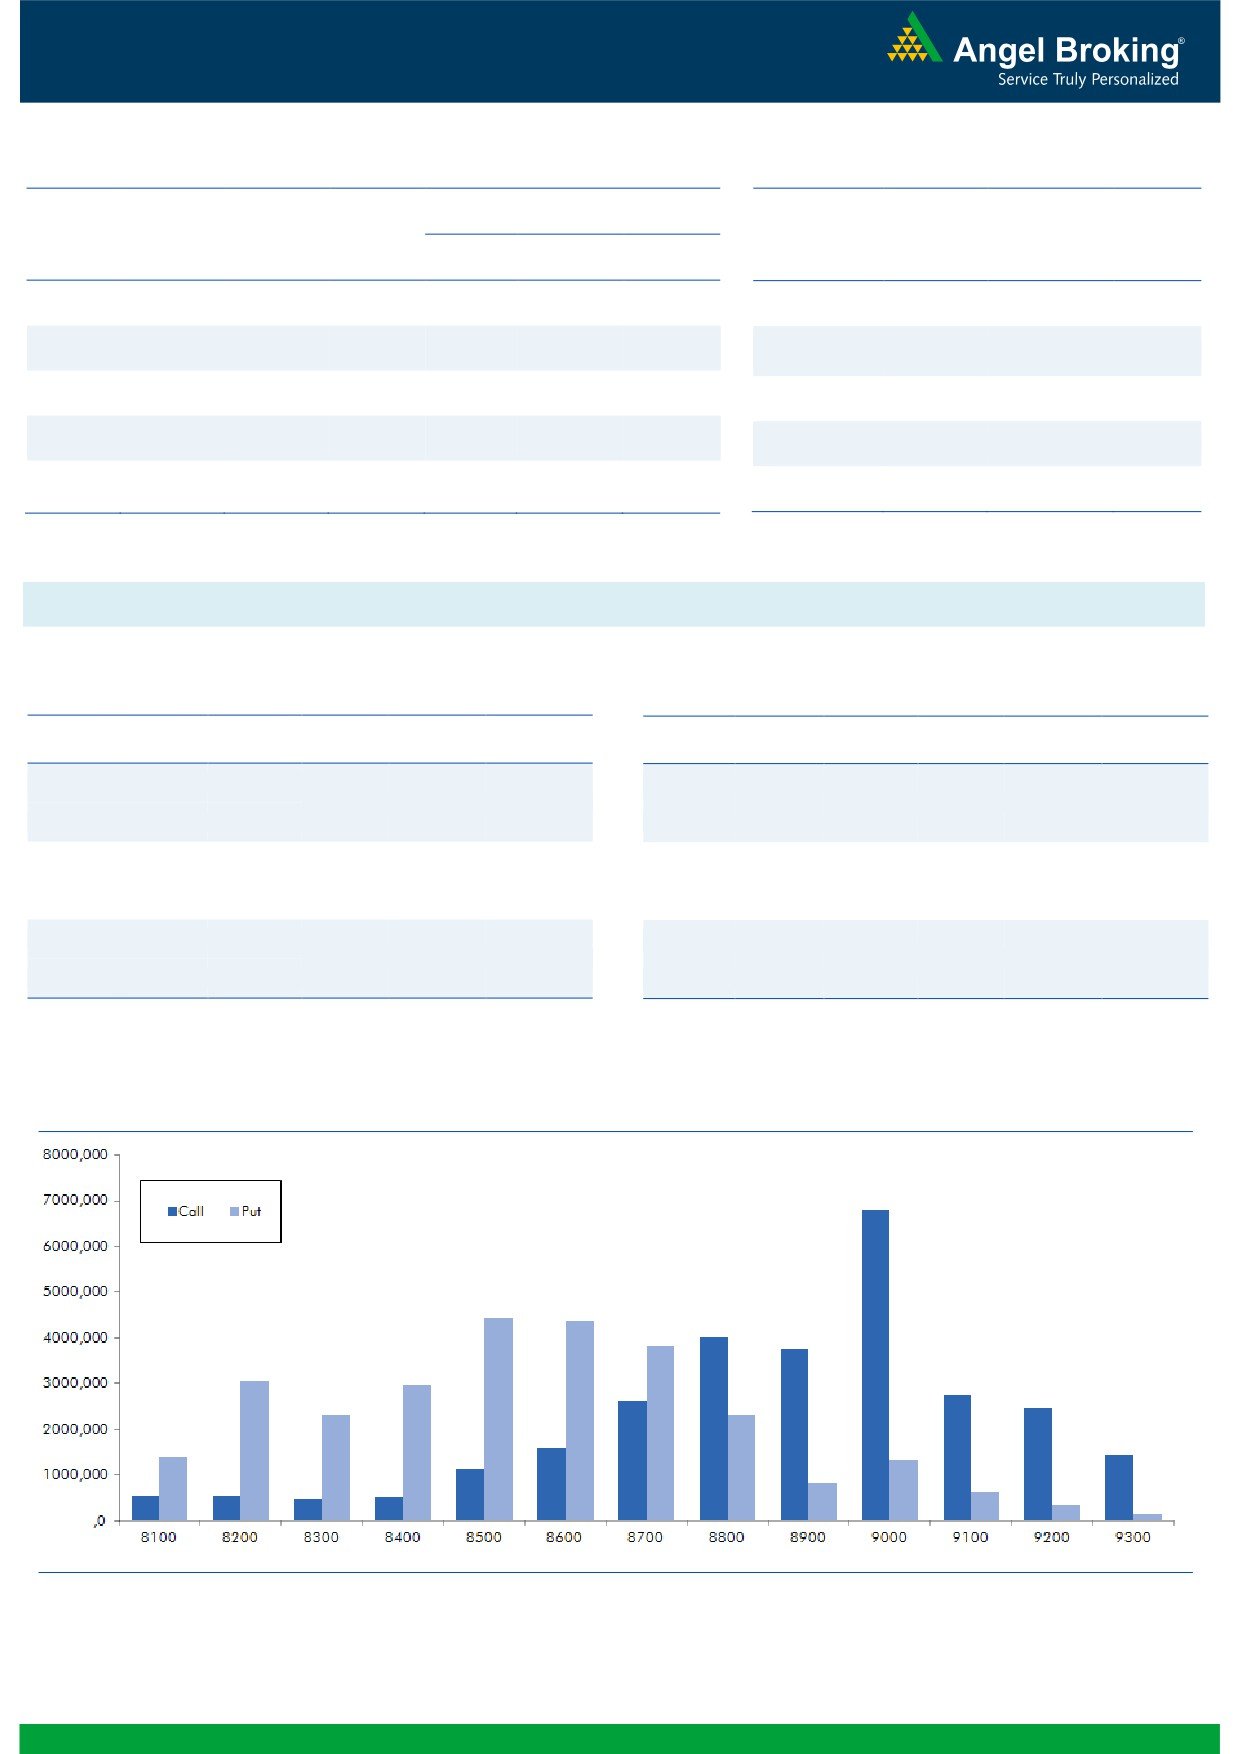
Nifty Vs OI
The Nifty futures open interest has decreased by 0.13%
BankNifty futures open interest has increased by 3.40%
as market closed at 8708.80 levels.
The Nifty October future closed with a premium of 31.15
against the premium of 25.15 points in last trading
session. The November series closed at a premium of
69.70 points.
The Implied Volatility of at the money options has
decreased from 12.55% to 12.35%. At the same time,
the PCR-OI of Nifty has remained unchanged 0.96.
The total OI of the market is Rs. 2,59,320/- cr. and the
stock futures OI is Rs. 79,842/- cr.
Few of the liquid counters where we have seen high cost
of carry are GMRINFRA, CROMPGREAV, MINDTREE,
ALBK and AJANTPHARM.
Views
OI Gainers
FIIs were net sellers in both cash market segment and
OI
PRICE
SCRIP
OI
PRICE
index futures. They sold equities to the tune of Rs. 547
CHG. (%)
CHG. (%)
crores. While, in index future, they were net sellers of
PCJEWELLER
1066500
45.70
522.75
7.35
Rs.152 crores with marginal change in OI, indicating
HINDZINC
6604800
13.34
252.50
-0.24
blend of long unwinding and some fresh short formation
TORNTPOWER
1071000
13.33
180.45
-0.06
www.angelbroking.com
in last trading session.
UNIONBANK
12668000
12.99
146.45
-2.27
On Index Options front, FIIs sold of worth Rs. 185 crores
DHFL
13506000
12.66
293.10
-0.32
with fall in OI. In call options,
9000-8900 strikes
ULTRACEMCO
875400
12.37
3998.50
1.09
remained active and they also added some positions. On
DISHTV
30156000
11.52
99.00
2.54
the other hand, some build-up was visible in 8500 put
KSCL
2784000
10.67
427.80
2.26
options.Highest OI in October series is placed at 9000
call and of put options has been shifted from 8600 to
OI Losers
8500 strike price.
OI
PRICE
SCRIP
OI
PRICE
From start of October series, we hardly saw any
CHG. (%)
CHG. (%)
meaningful directional build-up in Index Futures by FIIs.
APOLLOHOSP
496400
-5.98
1347.45
1.58
However, good amount of long unwinding with some
SUNTV
8596000
-4.57
558.75
-0.92
fresh shorts are visible since last couple of days. At
DABUR
4912500
-4.10
286.75
0.39
current juncture, 8800-8850 remains a strong hurdle for
SRF
480000
-3.71
1906.70
0.10
Nifty. Looking at the overall data we don’t see Nifty
GRASIM
9849750
-3.03
1019.60
-0.88
breaking this resistance level any time soon. Thus, we
AMBUJACEM
11270000
-2.38
257.70
1.46
suggest trades to avoid any aggressive positions in Index
JINDALSTEL
53001000
-2.19
79.50
-1.00
Futures and opt for stock specific trades.
TATAMOTORS
26077500
-2.05
564.05
-0.50
Historical Volatility
Put-Call Ratio
SCRIP
HV
SCRIP
PCR-OI
PCR-VOL
PCJEWELLER
56.83
NIFTY
0.96
1.05
ACC
29.96
BANKNIFTY
0.80
0.75
ASIANPAINT
27.94
INFY
0.63
0.69
TATACOMM
63.92
RELIANCE
0.51
0.45
INFY
21.75
AXISBANK
0.37
0.41
2
Technical & Derivatives Report
October 13, 2016
FII Statistics for 10, October 2016
Turnover on 10, October 2016
Open Interest
No. of
Turnover
Change
Detail
Buy
Sell
Net
Instrument
Value
Change
Contracts
( in Cr. )
(%)
Contracts
(in Cr.)
(%)
INDEX
INDEX
759.34
910.96
(151.62)
268853
18029.34
0.15
119994
8416.46
-34.00
FUTURES
FUTURES
INDEX
INDEX
18270.95
18455.56
(184.61)
962731
64172.94
(0.68)
2130287
154833.78
-13.66
OPTIONS
OPTIONS
STOCK
4605.80
4914.53
(308.73)
864748
57723.42
0.38
STOCK
FUTURES
382088
28600.09
-24.71
FUTURES
STOCK
STOCK
2772.15
2829.93
(57.77)
80868
5521.87
5.18
OPTIONS
229025
17049.25
-21.07
OPTIONS
TOTAL
26408.25
27110.98
(702.73)
2177200
145447.56
0.05
TOTAL
2861394
208899.59
-16.99
Nifty Spot = 8708.80
Lot Size = 75
Bull-Call Spreads
Bear-Put Spreads
Action
Strike
Price
Risk
Reward
BEP
Action
Strike
Price
Risk
Reward
BEP
Buy
8700
114.95
Buy
8700
76.60
51.10
48.90
8751.10
29.75
70.25
8670.25
Sell
8800
63.85
Sell
8600
46.85
Buy
8700
114.95
Buy
8700
76.60
84.20
115.80
8784.20
47.75
152.25
8652.25
Sell
8900
30.75
Sell
8500
28.85
Buy
8800
63.85
Buy
8600
46.85
33.10
66.90
8833.10
18.00
82.00
8582.00
Sell
8900
30.75
Sell
8500
28.85
Note: Above mentioned Bullish or Bearish Spreads in Nifty (October Series) are given as an information and not as a recommendation.
Nifty Put-Call Analysis
3
Technical & Derivatives Report
October 13, 2016
Daily Pivot Levels for Nifty Constituents
Scrips
S2
S1
PIVOT
R1
R2
ACC
1,605
1,637
1,655
1,687
1,706
ADANIPORTS
260
262
265
268
271
AMBUJACEM
252
254
256
259
261
ASIANPAINT
1,177
1,195
1,207
1,225
1,237
AUROPHARMA
842
849
857
864
871
AXISBANK
525
528
534
537
542
BAJAJ-AUTO
2,829
2,853
2,880
2,903
2,930
BANKBARODA
159
161
163
164
167
BHEL
133
134
135
136
138
BPCL
646
652
659
665
673
BHARTIARTL
312
314
317
319
322
INFRATEL
366
372
375
381
385
BOSCH
22,927
23,014
23,117
23,205
23,308
CIPLA
564
572
578
587
593
COALINDIA
316
317
320
321
323
DRREDDY
3,012
3,046
3,072
3,105
3,132
EICHERMOT
25,563
25,684
25,883
26,004
26,203
GAIL
407
413
419
425
430
GRASIM
995
1,005
1,021
1,031
1,047
HCLTECH
796
805
810
819
824
HDFCBANK
1,275
1,279
1,284
1,289
1,293
HDFC
1,371
1,381
1,397
1,407
1,422
HEROMOTOCO
3,457
3,473
3,491
3,507
3,526
HINDALCO
157
159
161
163
165
HINDUNILVR
868
872
879
883
890
ICICIBANK
247
248
251
252
255
IDEA
79
79
80
81
81
INDUSINDBK
1,207
1,214
1,223
1,230
1,239
INFY
1,002
1,016
1,024
1,038
1,046
ITC
238
239
241
242
244
KOTAKBANK
775
778
782
784
788
LT
1,436
1,443
1,454
1,461
1,473
LUPIN
1,490
1,505
1,515
1,530
1,540
M&M
1,367
1,372
1,380
1,385
1,393
MARUTI
5,676
5,694
5,714
5,733
5,753
NTPC
144
145
147
149
151
ONGC
260
264
267
270
273
POWERGRID
176
177
178
179
180
RELIANCE
1,076
1,086
1,104
1,114
1,132
SBIN
253
255
258
259
262
SUNPHARMA
746
751
754
759
762
TCS
2,342
2,361
2,374
2,393
2,406
TATAMTRDVR
360
363
368
370
375
TATAMOTORS
554
558
565
568
575
TATAPOWER
80
80
81
82
82
TATASTEEL
404
411
416
423
428
TECHM
413
418
421
425
429
ULTRACEMCO
3,909
3,943
3,969
4,003
4,029
WIPRO
474
475
478
479
481
YESBANK
1,268
1,274
1,282
1,288
1,296
ZEEL
556
562
569
575
581
4
Technical & Derivatives Report
October 13, 2016
Research Team Tel: 022 - 39357800
For Technical Queries
For Derivatives Queries
DISCLAIMER
Angel Broking Private Limited (hereinafter referred to as “Angel”) is a registered Member of National Stock Exchange of India Limited,
Bombay Stock Exchange Limited and Metropolitan Stock Exchange Limited. It is also registered as a Depository Participant with CDSL
and Portfolio Manager with SEBI. It also has registration with AMFI as a Mutual Fund Distributor. Angel Broking Private Limited is a
registered entity with SEBI for Research Analyst in terms of SEBI (Research Analyst) Regulations, 2014 vide registration number
INH000000164. Angel or its associates has not been debarred/ suspended by SEBI or any other regulatory authority for accessing
/dealing in securities Market. Angel or its associates/analyst has not received any compensation / managed or co-managed public
offering of securities of the company covered by Analyst during the past twelve months.
This document is solely for the personal information of the recipient, and must not be singularly used as the basis of any investment
decision. Nothing in this document should be construed as investment or financial advice. Each recipient of this document should
make such investigations as they deem necessary to arrive at an independent evaluation of an investment in the securities of the
companies referred to in this document (including the merits and risks involved), and should consult their own advisors to determine
the merits and risks of such an investment.
Reports based on technical and derivative analysis center on studying charts of a stock's price movement, outstanding positions and
trading volume, as opposed to focusing on a company's fundamentals and, as such, may not match with a report on a company's
fundamentals. Investors are advised to refer the Fundamental and Technical Research Reports available on our website to evaluate the
contrary view, if any.
The information in this document has been printed on the basis of publicly available information, internal data and other reliable
sources believed to be true, but we do not represent that it is accurate or complete and it should not be relied on as such, as this
document is for general guidance only. Angel Broking Pvt. Limited or any of its affiliates/ group companies shall not be in any way
responsible for any loss or damage that may arise to any person from any inadvertent error in the information contained in this report.
Angel Broking Pvt. Limited has not independently verified all the information contained within this document. Accordingly, we cannot
testify, nor make any representation or warranty, express or implied, to the accuracy, contents or data contained within this document.
While Angel Broking Pvt. Limited endeavors to update on a reasonable basis the information discussed in this material, there may be
regulatory, compliance, or other reasons that prevent us from doing so.
This document is being supplied to you solely for your information, and its contents, information or data may not be reproduced,
redistributed or passed on, directly or indirectly.
Neither Angel Broking Pvt. Limited, nor its directors, employees or affiliates shall be liable for any loss or damage that may arise from
or in connection with the use of this information.
5