October 13, 2015
Sensex (26904) / Nifty (8144)
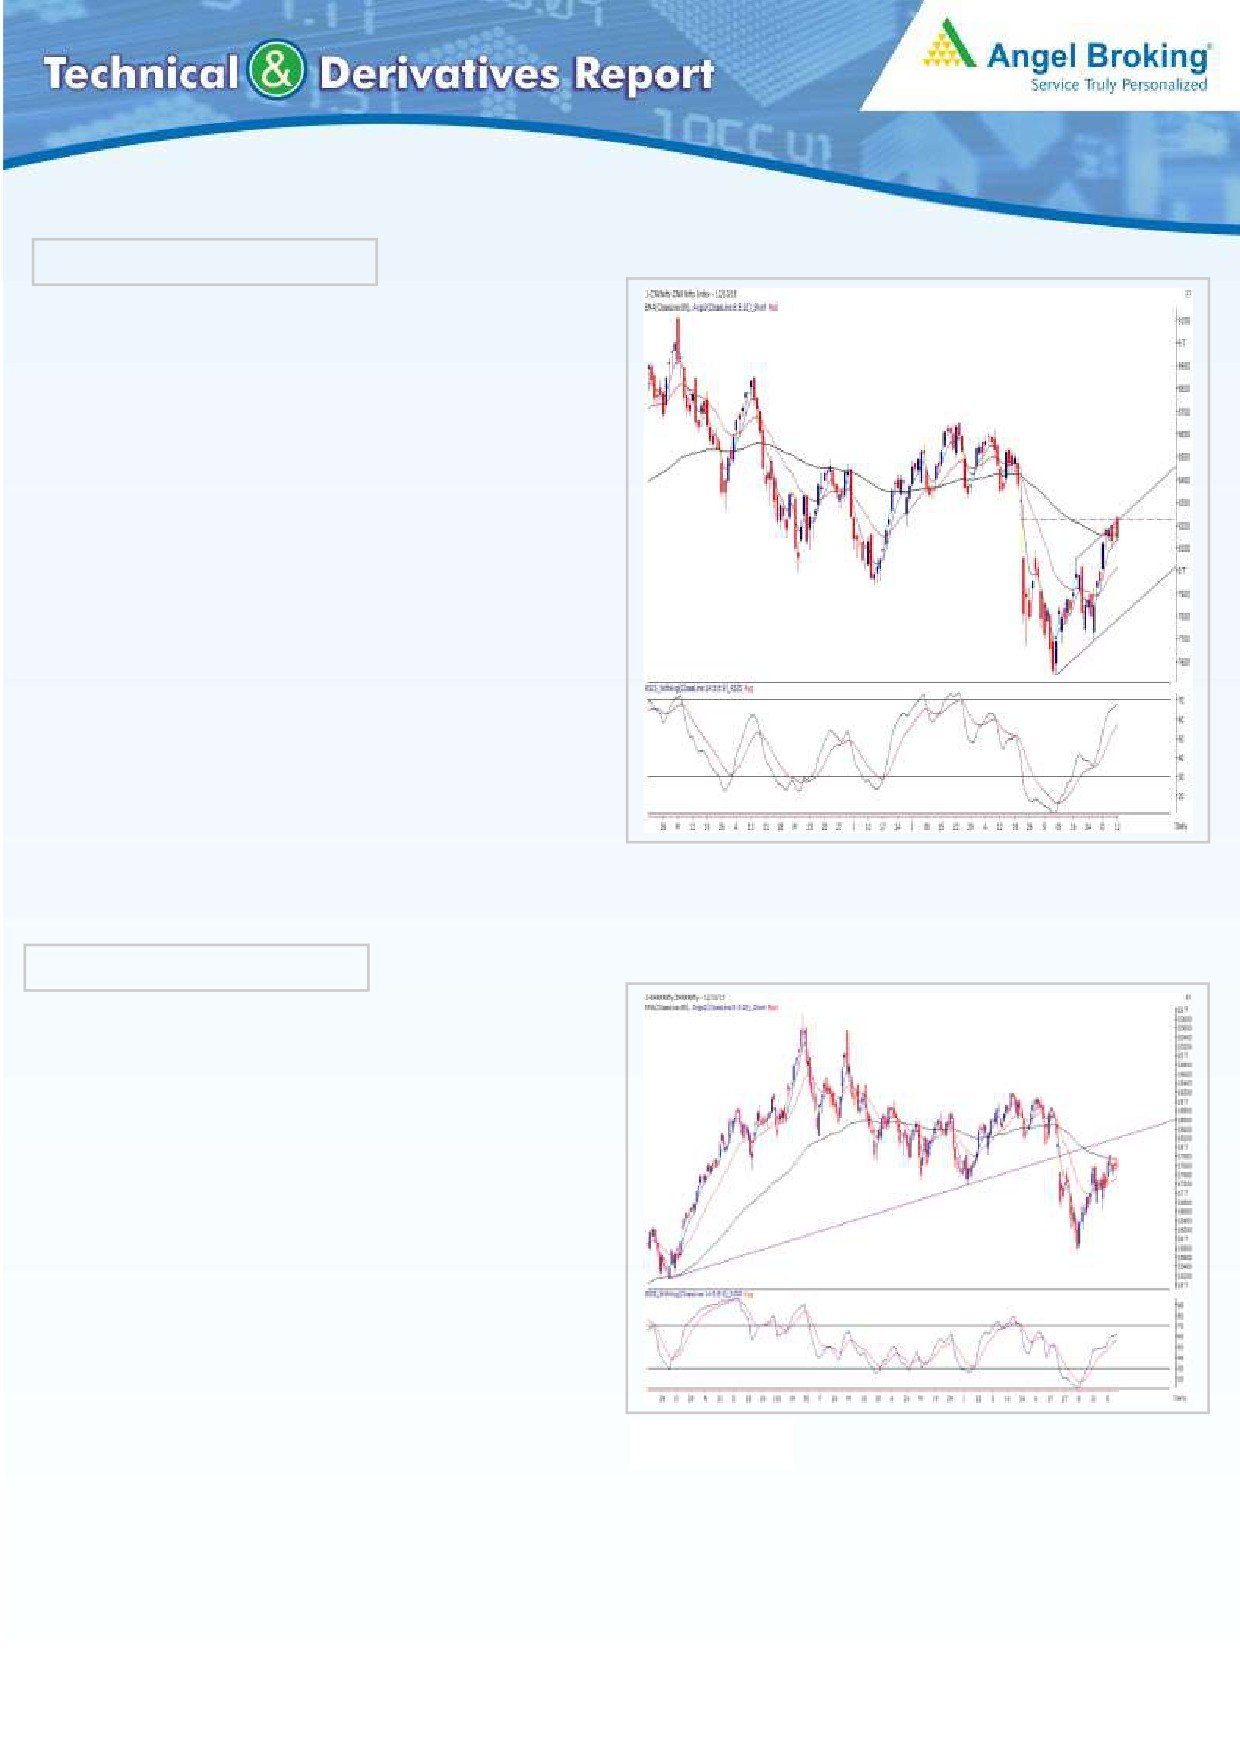
Exhibit 1: Nifty Daily Chart
Trading for the week started with a marginal upside gap owing to
favorable global cues. The index then extended this lead in the
initial trade on the back of IT giant, Infosys, 2QFY2016 numbers.
However, we witnessed a complete nosedive from day's high in
the counter post the initial hour. This profit booking had a rub off
effect on the broader market in the second half of the session and
as a result, we witnessed a decent correction to close almost at
the lowest point of the day.
If we look at yesterday's high then it can be concluded that the
Nifty is clearly struggling to cross the mentioned resistance level of
8250. Going forward, we expect this level to act as a major
hurdle for the bulls and thus, we would continue to advise a profit
booking and lighten up existing long positions in the index. On
the flipside, if the index manages to sustain below yesterday's low
then we are likely to see an immediate correction towards 8050 -
8000 levels.
Source: Falcon
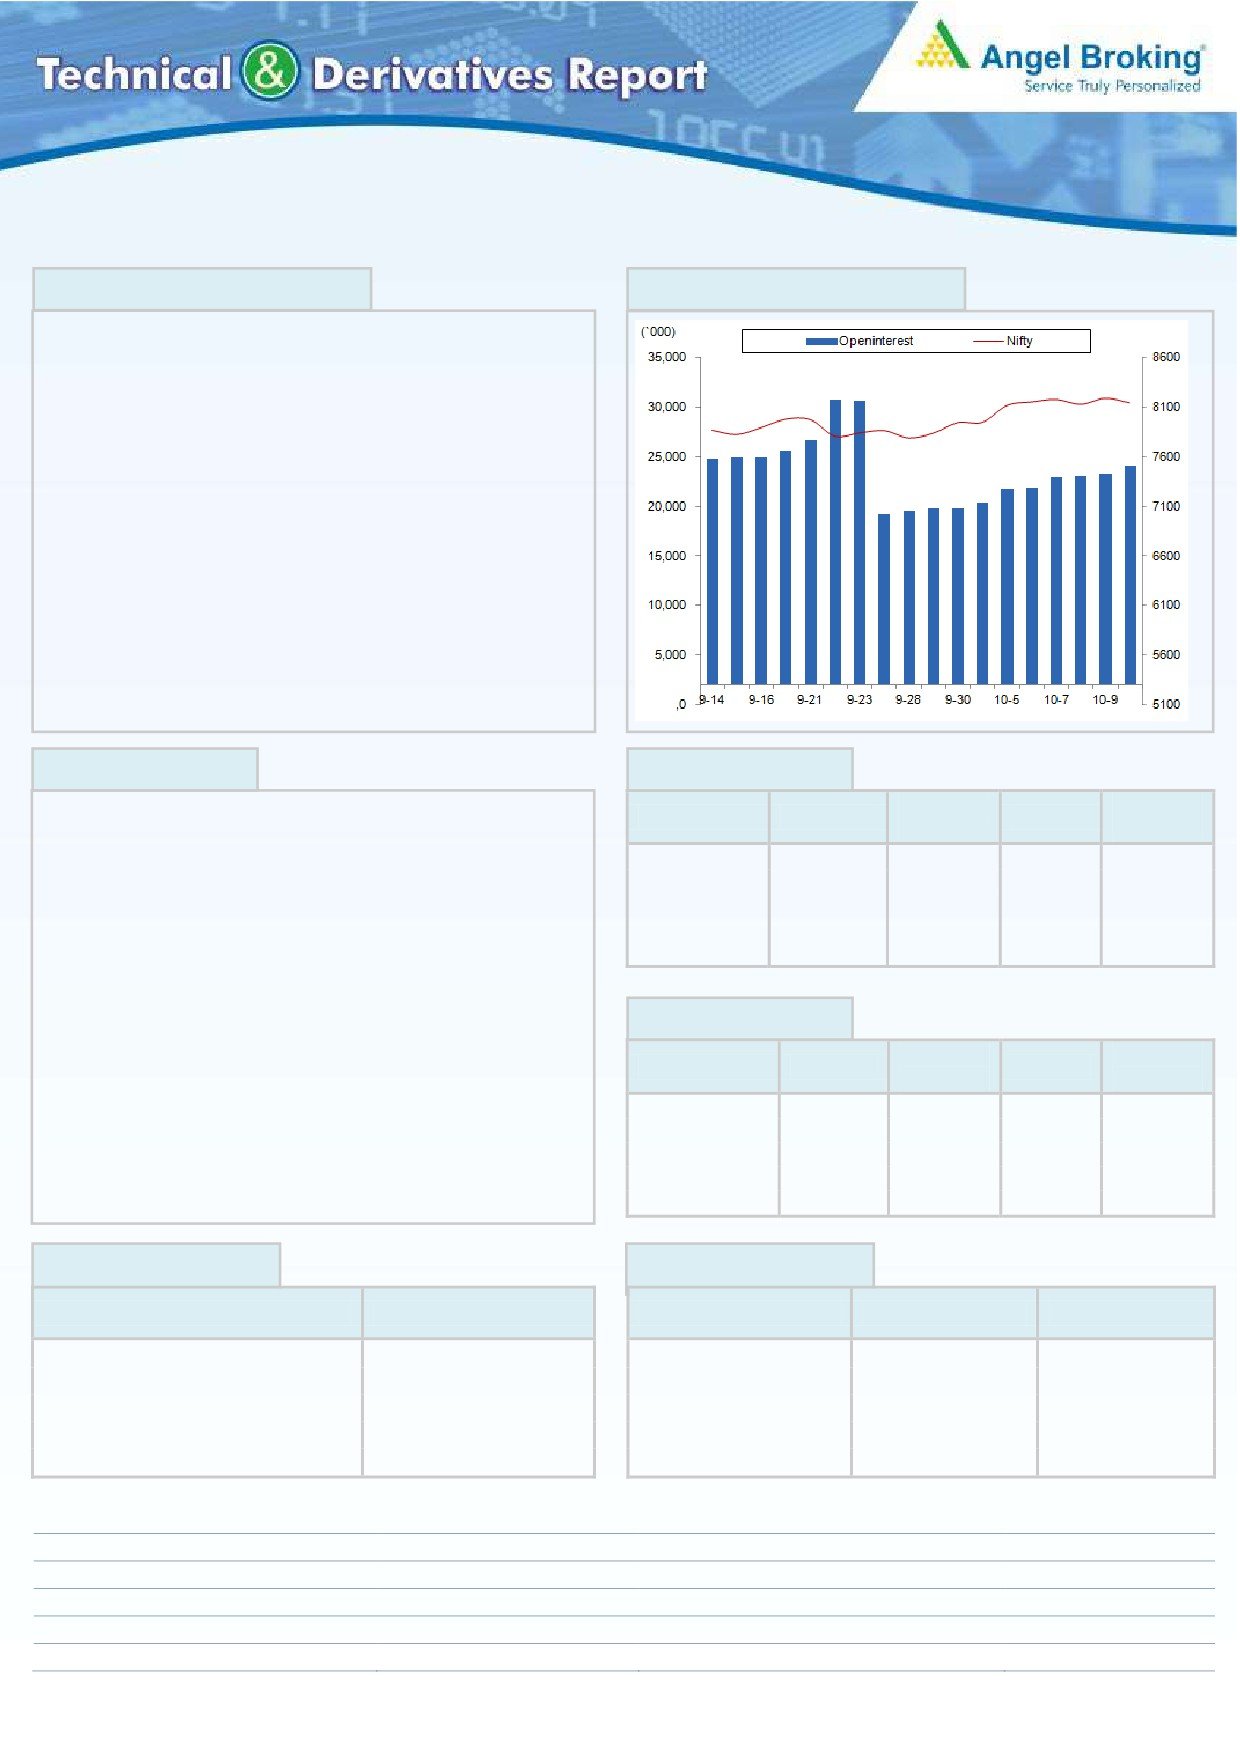
Bank Nifty Outlook - (17583)
Exhibit 2: Bank Nifty Daily Chart
Yesterday, the Bank Nifty opened with a marginal upside gap and
started moving higher from the initial trades. After seeing a good
traction in the first half of the session, the Bank Nifty took a bit of
knock along with the broader indices and eventually pared down
all morning gains. As a result, the index concluded the session
with a negligible loss of 0.04 percent over its previous close.
Looking at the daily chart, it can be clearly seen that the Bank
Nifty once again failed to cross the stiff hurdle of the daily ’89
EMA’. Going forward, intraday support levels are placed at
17400 and 17111. On the flipside, the resistance of higher end
of downside gap in weekly chart is still intact at 17842. While, the
61.80% retracement levels of the entire fall from 19229.05 to
15762.20 is also placed at 17905 levels. Thus, we expect the
Bank Nifty to remain within a range of 17100 to 17950 in
forthcoming sessions. At current juncture, we advise traders to
wait for further development to initiate directional trade in the
index.
Source: Falcon
1
October 13, 2015
Comments
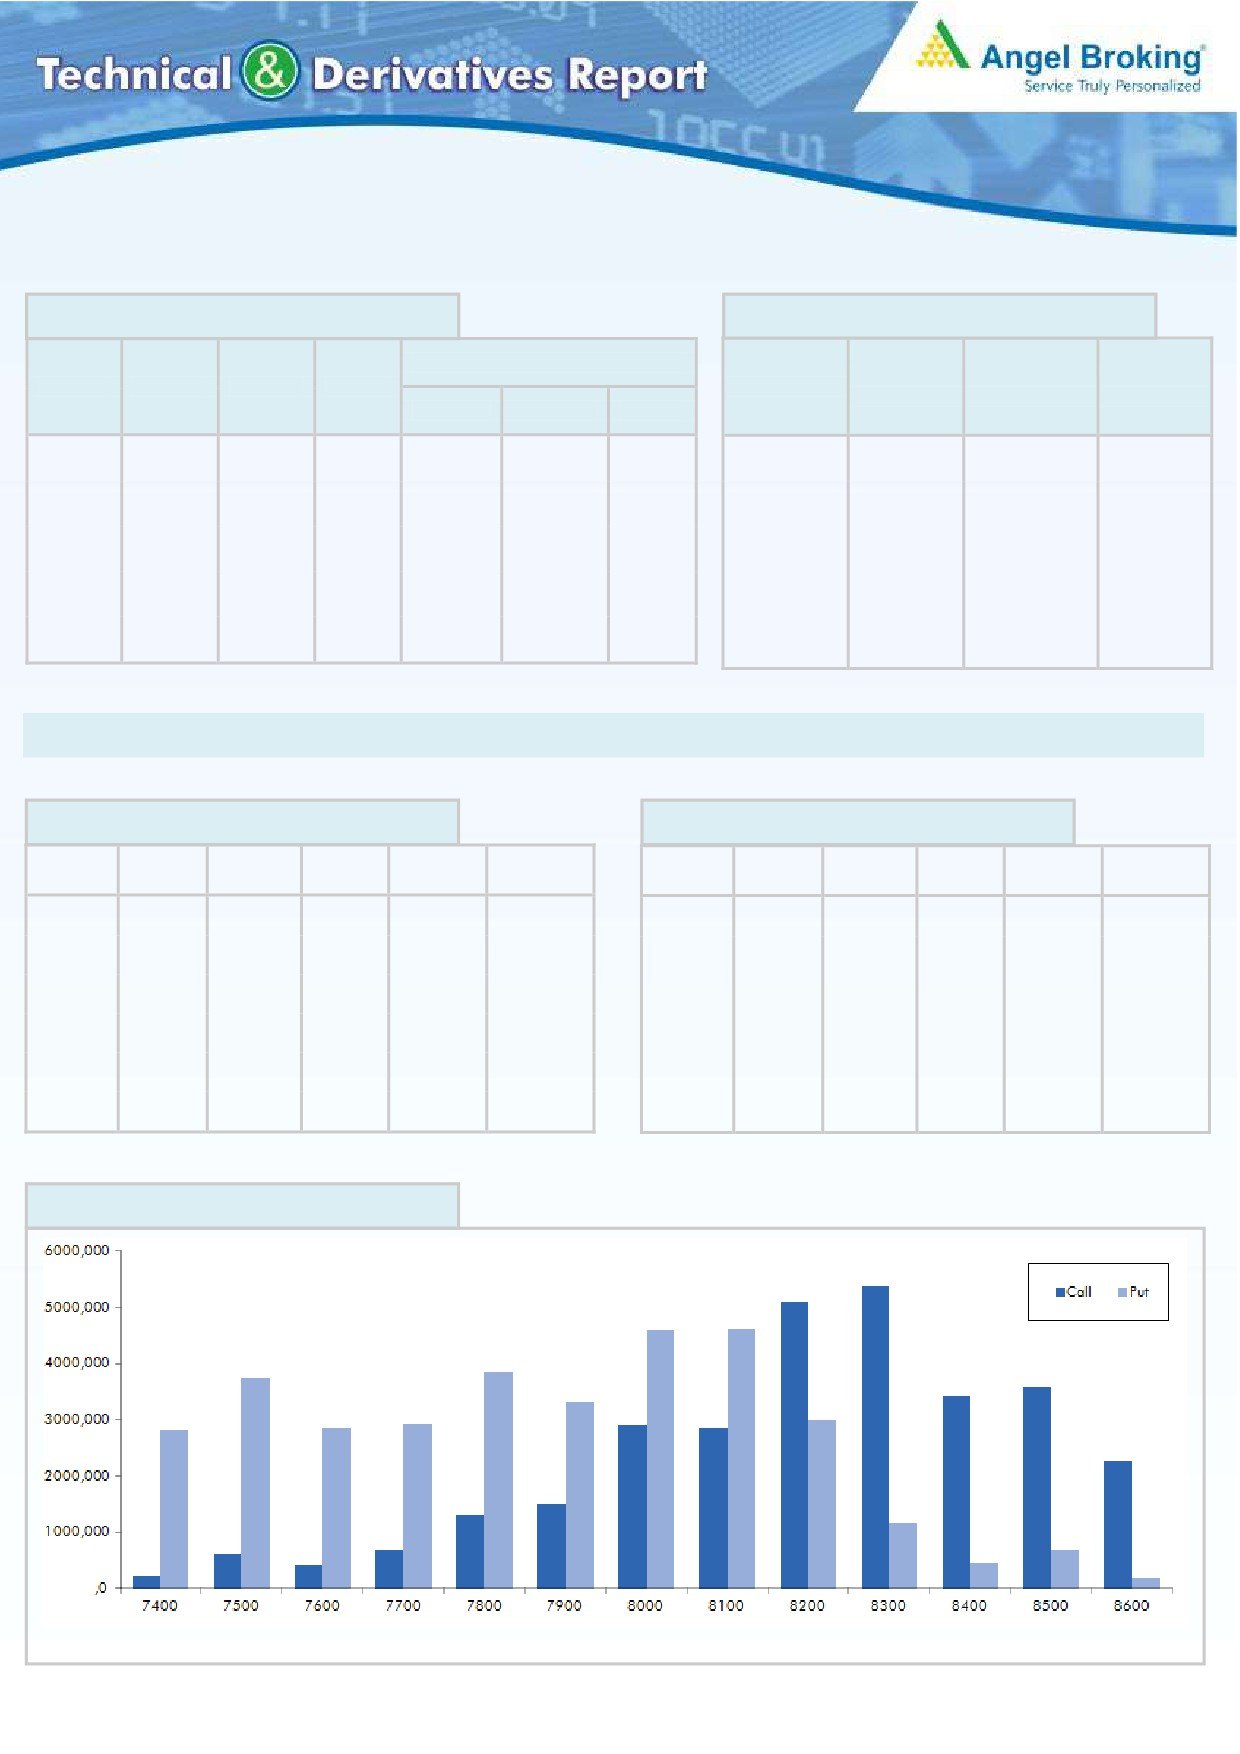
Nifty Vs OI
The Nifty futures open interest has increased by 3.78%
BankNifty futures open interest has increased by 3.07%
as market closed at 8143.60 levels.
The Nifty October future closed at a premium of 6.00
points against a premium of
15.65 points. The
November series closed at a premium of 44.30 points.
The Implied Volatility of at the money options has
increased from 16.35% to 16.93%.
The total OI of the market is Rs. 2,20,032/- cr. and the
stock futures OI is Rs. 59,117/- cr.
Few of the liquid counters where we have seen high cost
of carry are JPASSOCIAT, GMRINFRA, UNITECH,
FEDERALBNK and IBREALEST.
Views
OI Gainers
OI
PRICE
Yesterday, FIIs were net buyers in both cash market
SCRIP
OI
PRICE
CHG. (%)
CHG. (%)
segment and in Index Futures. They bought equities to
UCOBANK
11378000
17.18
49.65
2.27
the tune of Rs. 317 crores and Index Futures of Rs. 743
INFRATEL
1920100
9.90
388.10
-4.18
crores with rise in OI, suggesting long formation in last
MINDTREE
382600
9.52
1408.70
-2.37
trading session.
ANDHRABANK
13576000
8.82
70.45
1.37
TV18BRDCST
11917000
8.18
34.60
0.58
In Index Options front, FIIs sold of Rs. 888 crores with
rise in OI. In call options, we saw good amount of OI
addition in 8200-8300 strikes. While in put options,
OI Losers
decent build-up was visible in 8000 & 8100 strikes,
OI
PRICE
SCRIP
OI
PRICE
followed by unwinding in 7900 put option. Maximum OI
CHG. (%)
CHG. (%)
MOTHERSUMI
10725000
-8.74
254.30
5.04
is seen in 8300 call and 8100 put options. FIIs are
IGL
1136500
-7.03
468.50
-0.10
continuously forming longs in Index Futures but we don’t
PTC
12332000
-6.23
66.50
2.15
see buying interest in heavy weight large cap stocks. We
NMDC
14865000
-5.40
97.60
3.17
will suggest being light in Nifty and trade stock specific.
JINDALSTEL
32599000
-5.34
73.00
4.66
Historical Volatility
Put-Call Ratio
SCRIP
HV
SCRIP
PCR-OI
PCR-VOL
ADANIPOWER
74.43
NIFTY
1.01
0.89
INFY
39.49
BANKNIFTY
1.05
0.95
FEDERALBNK
37.97
INFY
0.39
0.49
MOTHERSUMI
67.49
TATAMOTORS
1.09
0.76
NHPC
31.25
SBIN
0.46
0.39
Strategy Date
Symbol
Strategy
Status
September 28, 2015
NIFTY
Long Strangle
Active
October 05, 2015
SBIN
Ratio Bear Put Spread
Active
October 12, 2015
LT
Long Put Ladder
Active
2
October 13, 2015
FII Statistics for 12-October 2015
Turnover on 12-October 2015
Open Interest
No. of
Turnover
Change
Detail
Buy
Sell
Net
Instrument
Contracts
( in Cr. )
(%)
Contracts
Value
Change
INDEX
INDEX
1765.07
1022.40
742.67
1023802
23151.61
2.45
544015
14706.46
-17.87
FUTURES
FUTURES
INDEX
INDEX
9469.05
10356.62
(887.57)
2212580
69205.77
2.05
5423645
123085.34
-9.26
OPTIONS
OPTIONS
STOCK
2433.43
2498.91
(65.49)
1797010
47200.06
(0.18)
STOCK
FUTURES
878492
23451.29
-1.42
FUTURES
STOCK
STOCK
2704.49
2864.75
(160.26)
119361
3216.42
4.65
OPTIONS
668957
18474.33
28.10
OPTIONS
TOTAL
16372.04
16742.69
(370.65)
5152753
142773.87
1.40
TOTAL
7515109
179717.42
-6.28
Nifty Spot = 8143.60
Lot Size = 25
Bull-Call Spreads
Bear-Put Spreads
Action
Strike
Price
Risk
Reward
BEP
Action
Strike
Price
Risk
Reward
BEP
Buy
Buy
8100
144.55
8200
140.85
58.15
41.85
8158.15
39.60
60.40
8160.40
Sell
Sell
8200
86.40
8100
101.25
Buy
Buy
8100
144.55
8200
140.85
99.20
100.80
8199.20
68.60
131.40
8131.40
Sell
Sell
8300
45.35
8000
72.25
Buy
Buy
8200
86.40
8100
101.25
41.05
58.95
8241.05
29.00
71.00
8071.00
Sell
Sell
8300
45.35
8000
72.25
Note: Above mentioned Bullish or Bearish Spreads in Nifty (Oct. Series) are given as an information and not as a recommendation.
Nifty Put-Call Analysis
3
October 13, 2015
Daily Pivot Levels for Nifty 50 Stocks
Scrips
S2
S1
PIVOT
R1
R2
SENSEX
26,572
26,738
27,022
27,188
27,471
NIFTY
8,056
8,100
8,172
8,216
8,288
BANKNIFTY
17,417
17,500
17,630
17,713
17,843
ACC
1,330
1,339
1,349
1,358
1,369
AMBUJACEM
207
209
210
211
212
ASIANPAINT
836
845
855
864
874
AXISBANK
477
482
490
495
503
BAJAJ-AUTO
2,385
2,417
2,438
2,470
2,491
BANKBARODA
165
171
175
181
186
BHARTIARTL
345
346
349
351
354
BHEL
198
202
205
209
212
BOSCHLTD
20,898
21,085
21,217
21,404
21,537
BPCL
833
841
847
855
861
CAIRN
163
166
169
172
175
CIPLA
664
670
681
688
699
COALINDIA
327
331
335
339
343
DRREDDY
4,105
4,181
4,232
4,309
4,360
GAIL
302
307
313
318
325
GRASIM
3,569
3,596
3,642
3,669
3,715
HCLTECH
817
836
849
867
880
HDFC
1,250
1,271
1,283
1,304
1,316
HDFCBANK
1,067
1,074
1,085
1,091
1,102
HEROMOTOCO
2,512
2,532
2,564
2,585
2,617
HINDALCO
81
85
89
93
96
HINDUNILVR
800
807
815
822
830
ICICIBANK
282
285
288
291
294
IDEA
155
156
158
159
161
INDUSINDBK
930
937
948
955
966
INFY
1,040
1,081
1,151
1,192
1,261
ITC
333
337
343
346
352
KOTAKBANK
649
656
663
669
676
LT
1,540
1,547
1,557
1,564
1,573
LUPIN
1,973
2,014
2,043
2,085
2,113
M&M
1,250
1,262
1,272
1,285
1,295
MARUTI
4,151
4,191
4,257
4,298
4,363
NMDC
95
97
99
101
103
NTPC
124
126
127
129
131
ONGC
259
261
264
267
270
PNB
134
136
138
140
142
POWERGRID
131
132
133
134
135
RELIANCE
880
886
894
900
907
SBIN
239
242
244
246
248
VEDL
101
106
112
118
124
SUNPHARMA
865
878
897
910
928
TATAMOTORS
351
357
362
367
373
TATAPOWER
69
69
70
71
72
TATASTEEL
242
246
254
259
266
TCS
2,552
2,591
2,626
2,664
2,699
TECHM
552
557
564
569
576
ULTRACEMCO
2,784
2,815
2,842
2,872
2,900
WIPRO
573
583
591
601
609
YESBANK
711
717
727
733
743
ZEEL
394
398
402
405
409
4
October 13, 2015
Research Team Tel: 022 - 39357800
For Technical Queries
For Derivatives Queries
DISCLAIMER
Angel Broking Private Limited (hereinafter referred to as “Angel”) is a registered Member of National Stock Exchange of India Limited,
Bombay Stock Exchange Limited and MCX Stock Exchange Limited. It is also registered as a Depository Participant with CDSL and
Portfolio Manager with SEBI. It also has registration with AMFI as a Mutual Fund Distributor. Angel Broking Private Limited is a
registered entity with SEBI for Research Analyst in terms of SEBI (Research Analyst) Regulations, 2014 vide registration number
INH000000164. Angel or its associates has not been debarred/ suspended by SEBI or any other regulatory authority for accessing
/dealing in securities Market. Angel or its associates including its relatives/analyst do not hold any financial interest/beneficial
ownership of more than 1% in the company covered by Analyst. Angel or its associates/analyst has not received any compensation /
managed or co-managed public offering of securities of the company covered by Analyst during the past twelve months. Angel/analyst
has not served as an officer, director or employee of company covered by Analyst and has not been engaged in market making activity
of the company covered by Analyst.
This document is solely for the personal information of the recipient, and must not be singularly used as the basis of any investment
decision. Nothing in this document should be construed as investment or financial advice. Each recipient of this document should
make such investigations as they deem necessary to arrive at an independent evaluation of an investment in the securities of the
companies referred to in this document (including the merits and risks involved), and should consult their own advisors to determine
the merits and risks of such an investment.
Reports based on technical and derivative analysis center on studying charts of a stock's price movement, outstanding positions and
trading volume, as opposed to focusing on a company's fundamentals and, as such, may not match with a report on a company's
fundamentals.
The information in this document has been printed on the basis of publicly available information, internal data and other reliable
sources believed to be true, but we do not represent that it is accurate or complete and it should not be relied on as such, as this
document is for general guidance only. Angel Broking Pvt. Limited or any of its affiliates/ group companies shall not be in any way
responsible for any loss or damage that may arise to any person from any inadvertent error in the information contained in this report.
Angel Broking Pvt. Limited has not independently verified all the information contained within this document. Accordingly, we cannot
testify, nor make any representation or warranty, express or implied, to the accuracy, contents or data contained within this document.
While Angel Broking Pvt. Limited endeavors to update on a reasonable basis the information discussed in this material, there may be
regulatory, compliance, or other reasons that prevent us from doing so.
This document is being supplied to you solely for your information, and its contents, information or data may not be reproduced,
redistributed or passed on, directly or indirectly.
Neither Angel Broking Pvt. Limited, nor its directors, employees or affiliates shall be liable for any loss or damage that may arise from
or in connection with the use of this information.
Note: Please refer to the important ‘Stock Holding Disclosure' report on the Angel website (Research Section). Also, please refer to the
latest update on respective stocks for the disclosure status in respect of those stocks. Angel Broking Pvt. Limited and its affiliates may
5