Technical & Derivatives Report
June 13, 2016
Sensex (26636) / Nifty (8170)
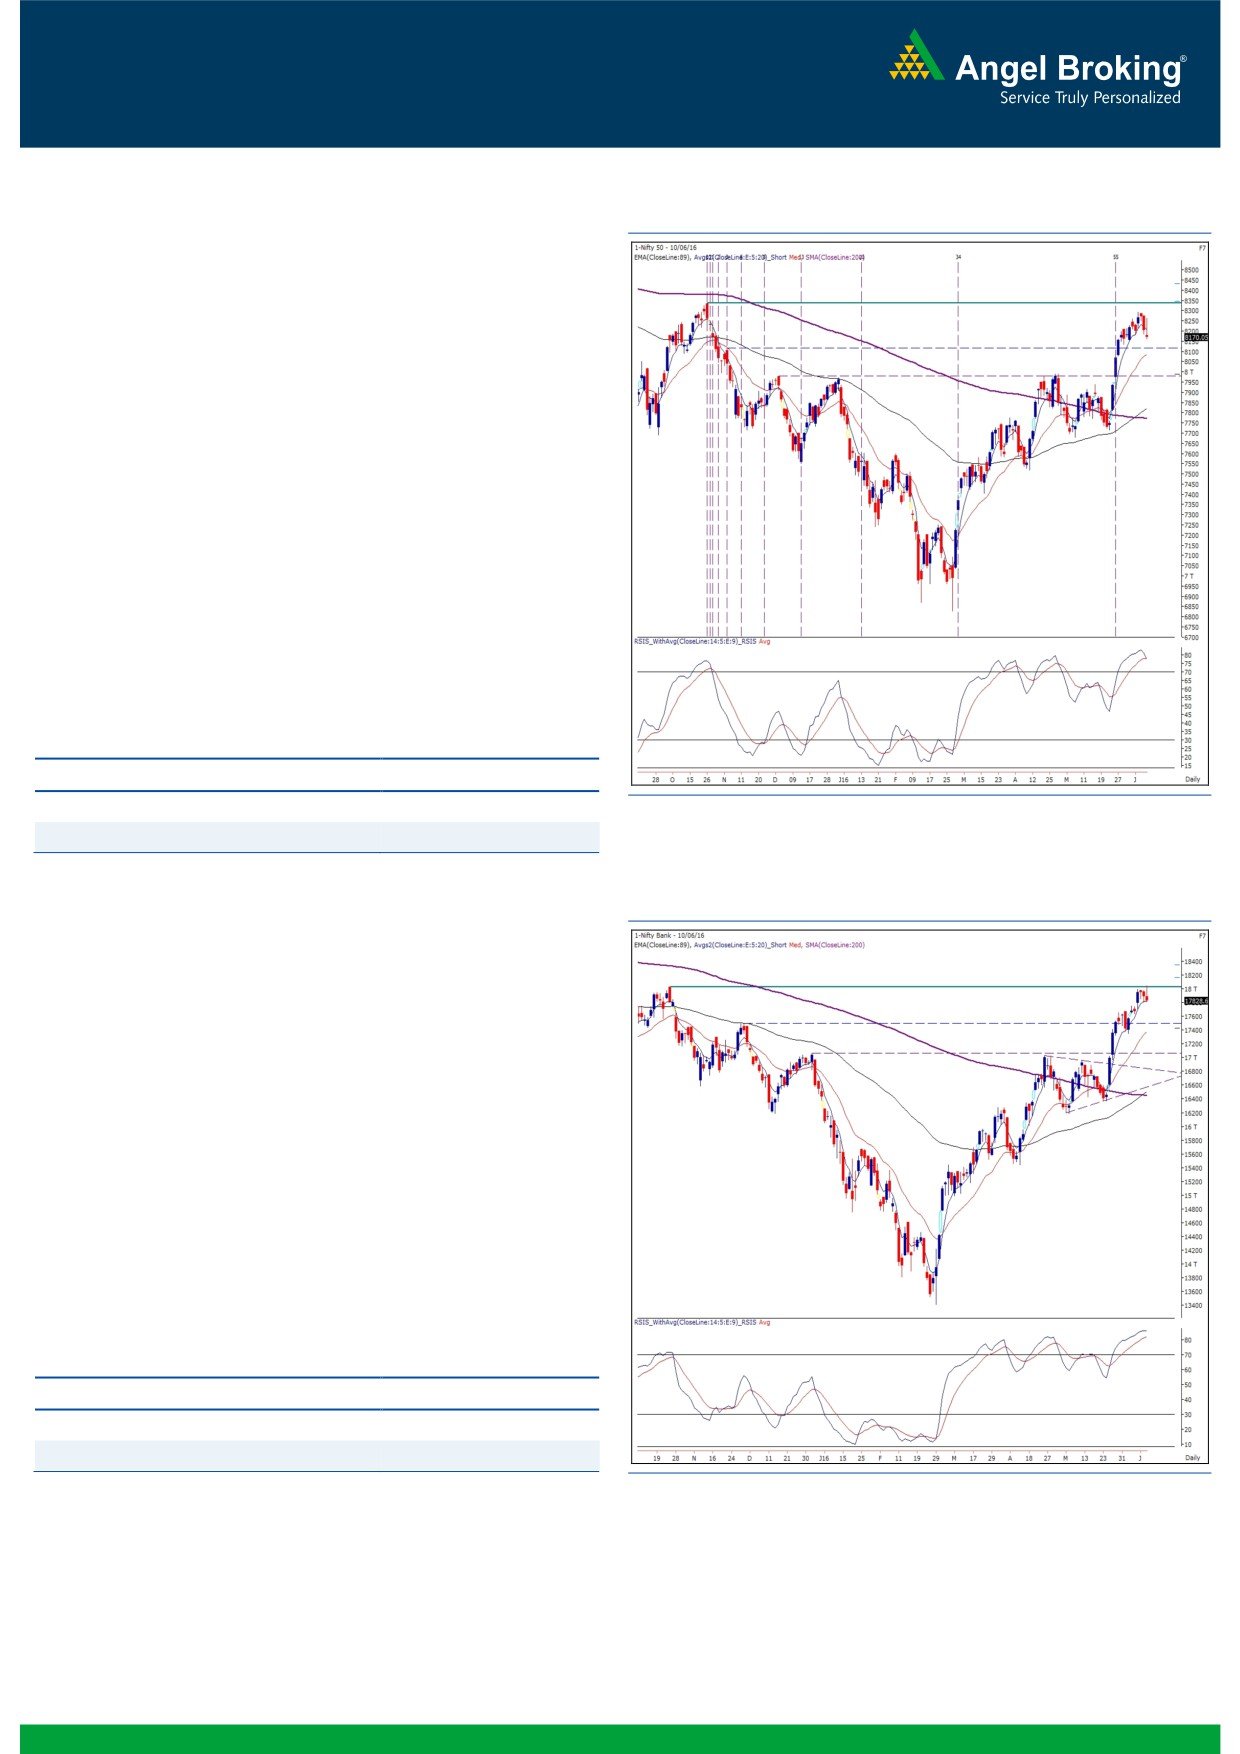
Exhibit 1: Nifty Daily Chart
We clearly witnessed a tug of war between the bulls and the bears
as both the counterparties made their presence felt in the
concluded week’s trading. In technical terms, this development
can be termed as a ‘Consolidation Phase’ after a strong rally.
Since the last few days, we have been mentioning about the
immediate support level of ‘5 Day EMA’. The Nifty has now
closed a tad below this short term moving average, which
generally indicates weakness. But considering multiple supportive
technical evidences at a gap of every 40 - 50 points on the lower
side, we do not expect any major correction in the index. Firstly, a
support in the form of the ‘Parabolic SAR’ stands at 8147 which
coincides with hourly ’89 EMA’. It is followed by the Daily ’20
EMA’ as well as the ‘Super Trend’ indicator at 8080. Thus, traders
are advised not to create fresh short positions for such a limited
downside; in fact, we suggest towards using these dips as a
buying opportunity. On the flipside, 8265 - 8336 are seen as
immediate hurdles for the index.
Key Levels
Support 1 - 8147
Resistance 1 - 8210
Support 2 - 8080
Resistance 2 - 8265
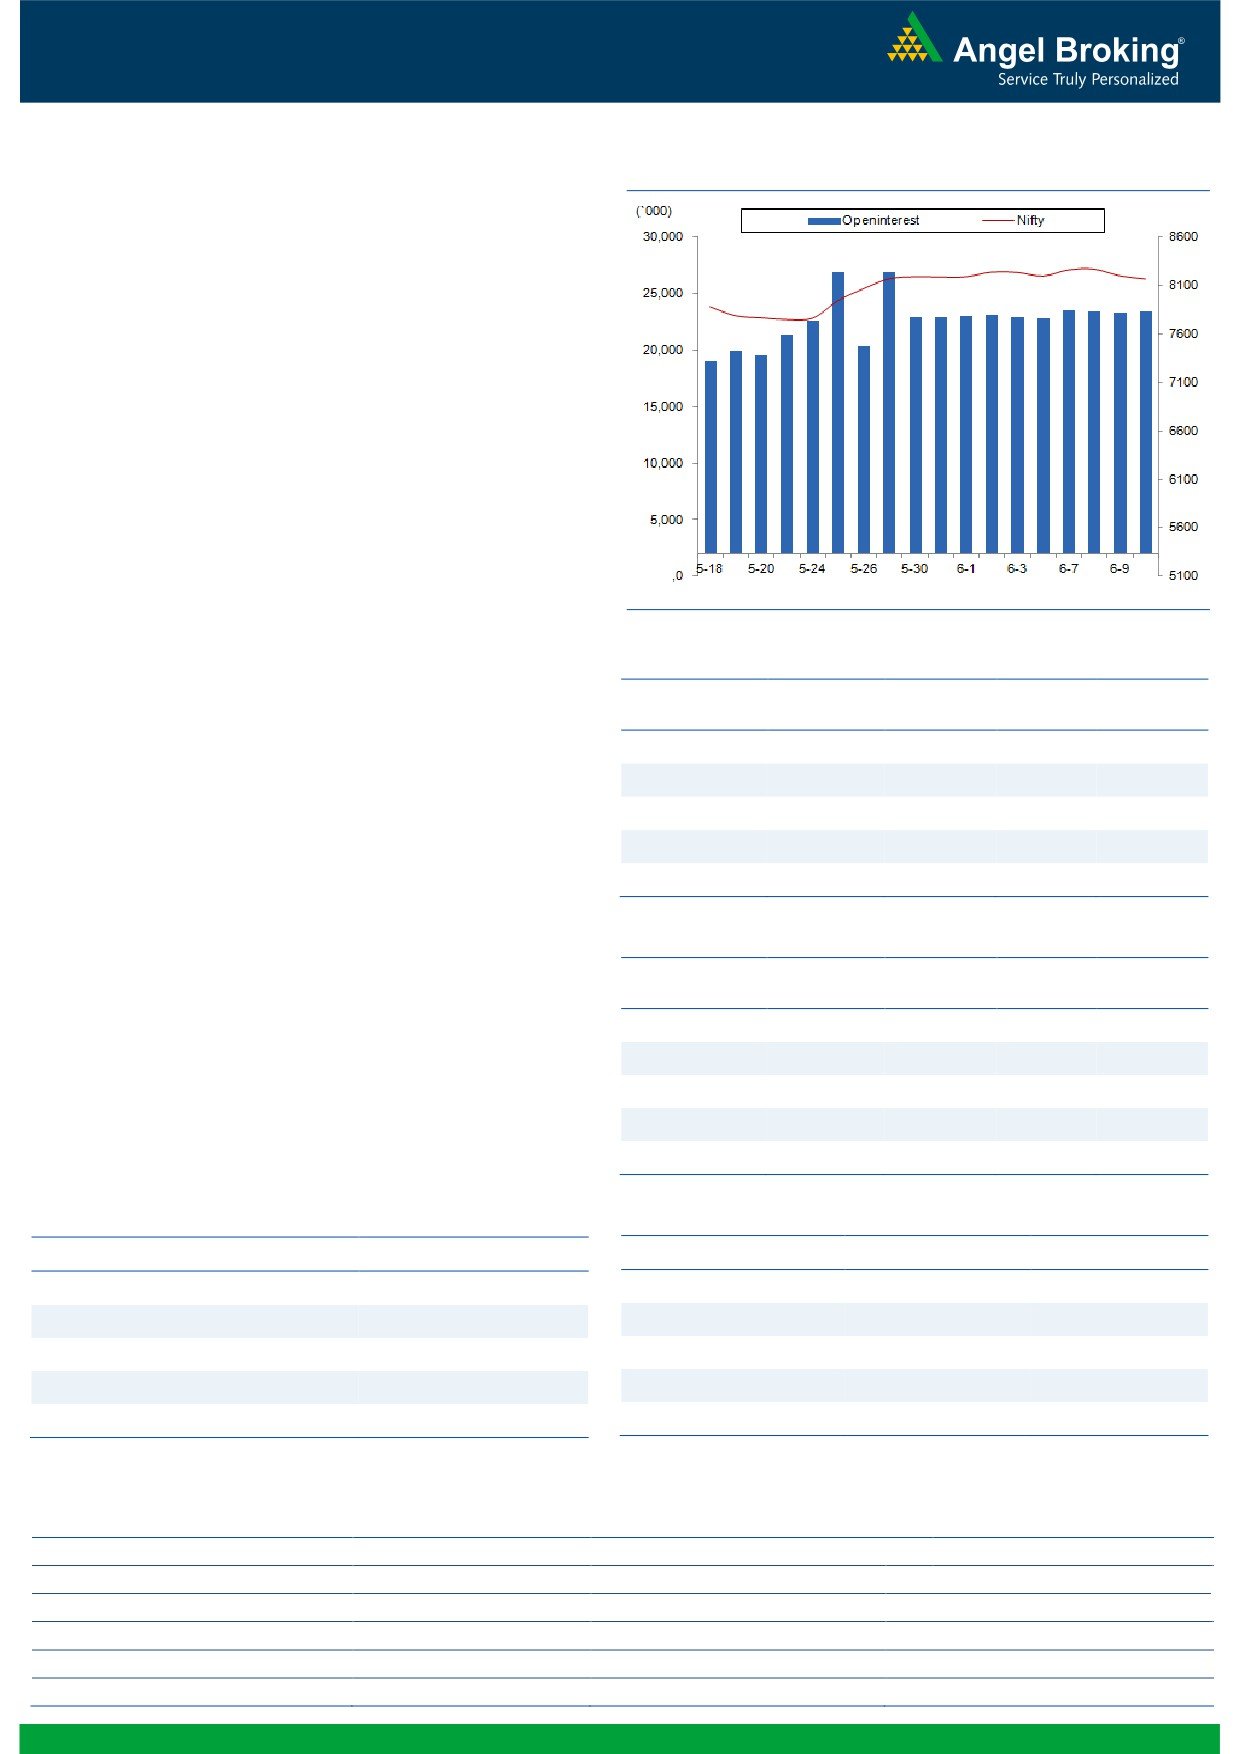
Exhibit 2: Nifty Bank Daily Chart
Nifty Bank Outlook - (17829)
In Friday's trading session, although the Nifty Bank index rallied
during the day, the index corrected from our mentioned
resistance zone if 18000 - 18175 and ended the session near the
day's low.
The intraday rally and sell off later on Friday has led to formation
of a 'Gravestone Doji' pattern on daily charts. The mentioned
pattern is a trend reversal pattern and formation of the same at
the resistance zone is a cautious sign. Traders should hence book
profits on long position in the index and remain light on positions.
The near term support in the index is placed around 17580 and
we expect the index to test this support zone. The intraday support
for the index is placed around 17780 and 17580 whereas
resistance is seen in range of 18000 - 18175.
Key Levels
Support 1 - 17780
Resistance 1 - 18000
Support 2 - 17580
Resistance 2 - 18175
1
Technical & Derivatives Report
June 13, 2016
Comments
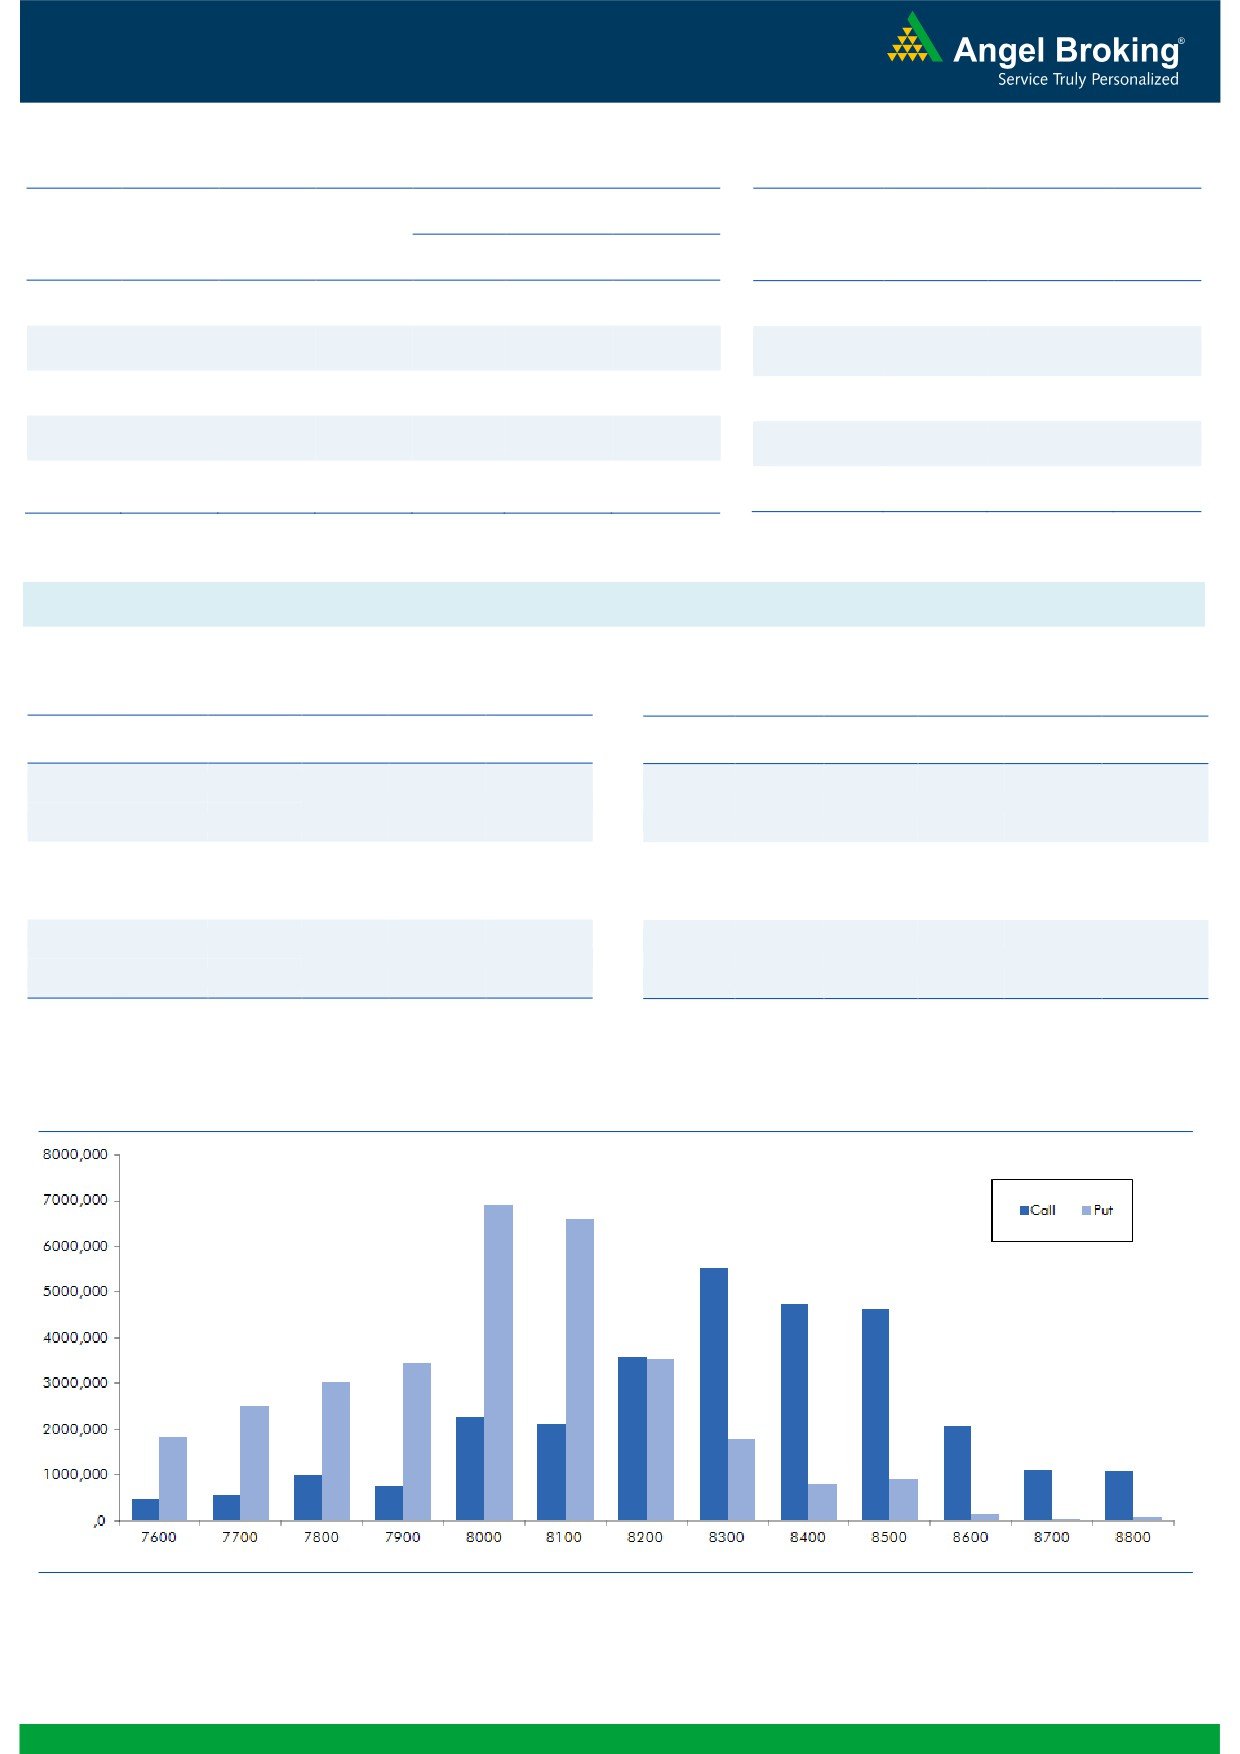
Nifty Vs OI
The Nifty futures open interest has increased by 0.19%
BankNifty futures open interest has decreased by 1.97%
as market closed at 8170.05 levels.
The Nifty June future closed with a premium of 20.35
points against a premium of 25.75 points in previous
session. The July series closed at a premium of 50.50
points.
The Implied Volatility of at the money options has
increased from 14.11% to 14.64%.
The total OI of the market is Rs. 2,35,754/- cr. and the
stock futures OI is Rs. 66,521/- cr.
Few of the liquid counters where we have seen high cost
of carry are UNITECH, GMRINFRA, JPASSOCIAT,
TATAMTRDVR and RPOWER.
Views
OI Gainers
FIIs were net buyers in both equity cash and index futures
OI
PRICE
segment on Friday. They bought equities worth Rs. 201
SCRIP
OI
PRICE
CHG. (%)
CHG. (%)
crores. While, in Index Futures, they were net buyers of
SUNTV
5040000
22.03
371.55
3.15
Rs.
323 crores with marginal fall in open interest,
KPIT
1376000
15.82
186.10
3.65
suggesting blend of long build-up and short covering in
JSWENERGY
14072000
12.00
80.40
2.03
last trading session.
On Index Options front, FIIs were seller to the tune of
PIDILITIND
1016000
9.48
699.85
-0.81
Rs. 254 crores with rise in OI. In Call options, 8200
DHFL
9573800
9.48
209.85
-1.53
strike was quite active and added fresh positions,
followed by some addition in 8300 strike. We believe
OI Losers
that most of them are shorts. While in put option, OI
OI
PRICE
SCRIP
OI
PRICE
addition was seen in 8000 strike. Maximum open interest
CHG. (%)
CHG. (%)
in current series is placed at 8300 call and 8000 put
AMBUJACEM
8906200
-8.40
235.60
0.99
option.
PETRONET
4995000
-7.04
276.90
0.38
Despite some correction seen in Nifty; we didn’t
AMARAJABAT
905400
-6.56
850.10
0.73
witnessed any meaningful activity from FIIs. Hence, we
FEDERALBNK
40322000
-6.44
58.50
0.34
advise traders to remain light on positions and wait for
TATAMOTORS
26760000
-5.09
459.25
-2.10
further development to initiate any positional trade.
Historical Volatility
Put-Call Ratio
SCRIP
HV
SCRIP
PCR-OI
PCR-VOL
JPASSOCIAT
58.14
NIFTY
1.12
1.19
UNITECH
53.88
BANKNIFTY
1.03
0.97
COLPAL
21.90
SBIN
0.90
0.71
IBULHSGFIN
39.22
RELIANCE
0.58
0.41
KPIT
46.16
SUNPHARMA
0.37
0.25
Strategy Date
Symbol
Strategy
Status
May 30, 2016
TCS
Ratio Bull Call Spread
Active
June 06, 2016
NIFTY
Long Call
Exited at Cost
2
Technical & Derivatives Report
June 13, 2016
FII Statistics for 10-June 2016
Turnover on 10-June 2016
Open Interest
No. of
Turnover
Change
Detail
Buy
Sell
Net
Instrument
Value
Contracts
( in Cr. )
(%)
Contracts
Change (%)
(in Cr.)
INDEX
INDEX
1815.94
1492.65
323.29
297207
17978.65
(0.69)
335141
19737.70
28.55
FUTURES
FUTURES
INDEX
INDEX
24525.17
24779.18
(254.01)
1047155
63585.22
2.01
3252565
195120.58
-9.02
OPTIONS
OPTIONS
STOCK
4560.84
5066.28
(505.44)
1055648
52189.35
(0.18)
STOCK
FUTURES
547821
28626.69
2.24
FUTURES
STOCK
STOCK
2965.14
3025.08
(59.94)
95074
4949.71
5.42
OPTIONS
315601
16510.46
9.84
OPTIONS
TOTAL
33867.08
34363.18
(496.10)
2495084
138702.94
0.87
TOTAL
4451128
259995.43
-4.71
Nifty Spot = 8170.05
Lot Size = 75
Bull-Call Spreads
Bear-Put Spreads
Action
Strike
Price
Risk
Reward
BEP
Action
Strike
Price
Risk
Reward
BEP
Buy
8200
105.05
Buy
8200
115.80
43.85
56.15
8243.85
38.85
61.15
8161.15
Sell
8300
61.20
Sell
8100
76.95
Buy
8200
105.05
Buy
8200
115.80
73.90
126.10
8273.90
65.55
134.45
8134.45
Sell
8400
31.15
Sell
8000
50.25
Buy
8300
61.20
Buy
8100
76.95
30.05
69.95
8330.05
26.70
73.30
8073.30
Sell
8400
31.15
Sell
8000
50.25
Note: Above mentioned Bullish or Bearish Spreads in Nifty (June Series) are given as an information and not as a recommendation.
Nifty Put-Call Analysis
3
Technical & Derivatives Report
June 13, 2016
Daily Pivot Levels for Nifty Constituents
Scrips
S2
S1
PIVOT
R1
R2
ACC
1,519
1,537
1,549
1,567
1,578
ADANIPORTS
199
201
203
205
208
AMBUJACEM
229
232
234
237
239
ASIANPAINT
984
988
994
998
1,003
AUROPHARMA
726
735
745
753
763
AXISBANK
532
537
543
547
554
BAJAJ-AUTO
2,531
2,555
2,590
2,614
2,648
BANKBARODA
142
144
147
150
153
BHEL
120
122
124
126
129
BPCL
972
979
992
999
1,012
BHARTIARTL
345
348
351
354
357
INFRATEL
367
371
375
379
383
BOSCH
21,097
21,295
21,597
21,795
22,097
CIPLA
467
472
479
484
491
COALINDIA
300
303
310
313
319
DRREDDY
3,027
3,046
3,070
3,089
3,113
EICHERMOT
18,319
18,469
18,585
18,735
18,851
GAIL
358
364
372
377
386
GRASIM
4,209
4,260
4,303
4,354
4,396
HCLTECH
740
745
752
757
764
HDFCBANK
1,147
1,154
1,163
1,171
1,180
HDFC
1,213
1,222
1,237
1,245
1,260
HEROMOTOCO
3,025
3,047
3,081
3,103
3,137
HINDALCO
108
112
114
117
119
HINDUNILVR
863
869
877
883
891
ICICIBANK
248
250
254
256
260
IDEA
102
103
104
105
106
INDUSINDBK
1,097
1,103
1,115
1,121
1,133
INFY
1,160
1,170
1,180
1,190
1,200
ITC
345
348
353
356
362
KOTAKBANK
736
744
751
758
765
LT
1,461
1,474
1,490
1,503
1,518
LUPIN
1,407
1,422
1,439
1,454
1,470
M&M
1,340
1,358
1,381
1,399
1,423
MARUTI
4,039
4,075
4,136
4,172
4,233
NTPC
149
150
151
153
154
ONGC
214
216
219
222
225
POWERGRID
152
153
154
155
156
RELIANCE
960
969
976
985
993
SBIN
201
204
208
210
214
SUNPHARMA
734
738
742
746
751
TCS
2,521
2,538
2,571
2,588
2,621
TATAMTRDVR
304
308
315
320
326
TATAMOTORS
447
452
459
464
472
TATAPOWER
75
76
76
77
77
TATASTEEL
326
330
337
341
348
TECHM
527
532
536
542
546
ULTRACEMCO
3,301
3,343
3,369
3,411
3,437
WIPRO
541
543
545
547
549
YESBANK
1,030
1,046
1,057
1,074
1,085
ZEEL
453
456
460
463
467
4
Technical & Derivatives Report
June 13, 2016
Research Team Tel: 022 - 39357800
For Technical Queries
For Derivatives Queries
DISCLAIMER
Angel Broking Private Limited (hereinafter referred to as “Angel”) is a registered Member of National Stock Exchange of India Limited,
Bombay Stock Exchange Limited and MCX Stock Exchange Limited. It is also registered as a Depository Participant with CDSL and
Portfolio Manager with SEBI. It also has registration with AMFI as a Mutual Fund Distributor. Angel Broking Private Limited is a
registered entity with SEBI for Research Analyst in terms of SEBI (Research Analyst) Regulations, 2014 vide registration number
INH000000164. Angel or its associates has not been debarred/ suspended by SEBI or any other regulatory authority for accessing
/dealing in securities Market. Angel or its associates including its relatives/analyst do not hold any financial interest/beneficial
ownership of more than 1% in the company covered by Analyst. Angel or its associates/analyst has not received any compensation /
managed or co-managed public offering of securities of the company covered by Analyst during the past twelve months. Angel/analyst
has not served as an officer, director or employee of company covered by Analyst and has not been engaged in market making activity
of the company covered by Analyst.
This document is solely for the personal information of the recipient, and must not be singularly used as the basis of any investment
decision. Nothing in this document should be construed as investment or financial advice. Each recipient of this document should
make such investigations as they deem necessary to arrive at an independent evaluation of an investment in the securities of the
companies referred to in this document (including the merits and risks involved), and should consult their own advisors to determine
the merits and risks of such an investment.
Reports based on technical and derivative analysis center on studying charts of a stock's price movement, outstanding positions and
trading volume, as opposed to focusing on a company's fundamentals and, as such, may not match with a report on a company's
fundamentals.
The information in this document has been printed on the basis of publicly available information, internal data and other reliable
sources believed to be true, but we do not represent that it is accurate or complete and it should not be relied on as such, as this
document is for general guidance only. Angel Broking Pvt. Limited or any of its affiliates/ group companies shall not be in any way
responsible for any loss or damage that may arise to any person from any inadvertent error in the information contained in this report.
Angel Broking Pvt. Limited has not independently verified all the information contained within this document. Accordingly, we cannot
testify, nor make any representation or warranty, express or implied, to the accuracy, contents or data contained within this document.
While Angel Broking Pvt. Limited endeavors to update on a reasonable basis the information discussed in this material, there may be
regulatory, compliance, or other reasons that prevent us from doing so.
This document is being supplied to you solely for your information, and its contents, information or data may not be reproduced,
redistributed or passed on, directly or indirectly.
Neither Angel Broking Pvt. Limited, nor its directors, employees or affiliates shall be liable for any loss or damage that may arise from
or in connection with the use of this information.
Note: Please refer to the important ‘Stock Holding Disclosure' report on the Angel website (Research Section). Also, please refer to the
latest update on respective stocks for the disclosure status in respect of those stocks. Angel Broking Pvt. Limited and its affiliates may
have investment positions in the stocks recommended in this report.
5