Technical & Derivatives Report
January 13, 2016
Sensex (24682) / Nifty (7510)
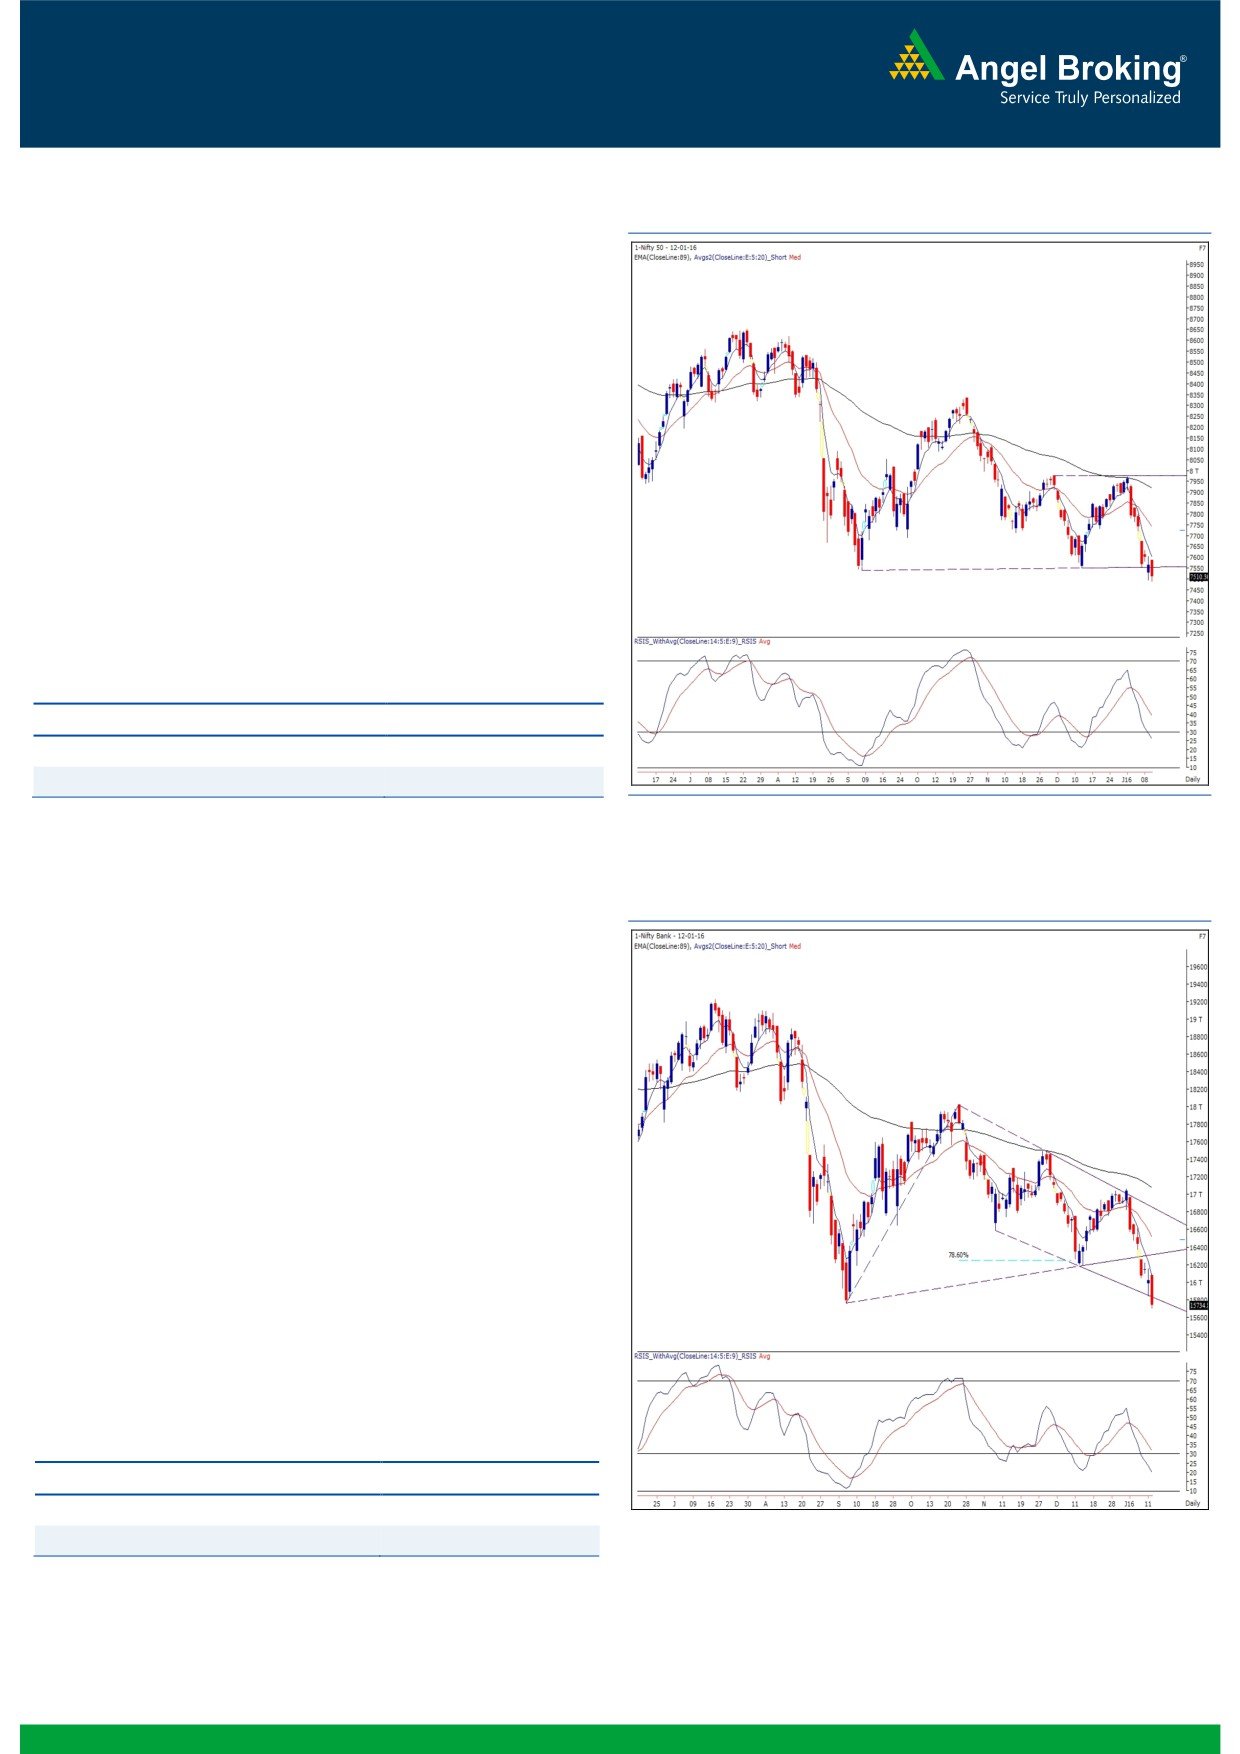
Exhibit 1: Nifty Daily Chart
Yesterday, our markets opened tad higher as indicated by the
SGX Nifty. However, we almost witnessed an ‘Open High’ in
the Nifty, which is generally considered as a negative sign (for
that day), if the early morning high remains intact. As a result,
the Nifty gradually descended to break the 7500 mark for the
second consecutive day. However, unlike the previous session,
yesterday Nifty closed at the new 18-month low.
At this juncture, we are observing a strong resistance zone
around 7600 - 7620 on a closing basis. The Nifty is likely to
continue this down move as long as it maintains its position
below the mentioned resistance zone. On the flipside, we have
been observing a strong support around 7490 on an intraday
basis. An hourly closing below this level may drag the index
7450 - 7420 levels.
Key Levels
Support 1 - 7450
Resistance 1 - 7600
Support 2 - 7420
Resistance 2 - 7620
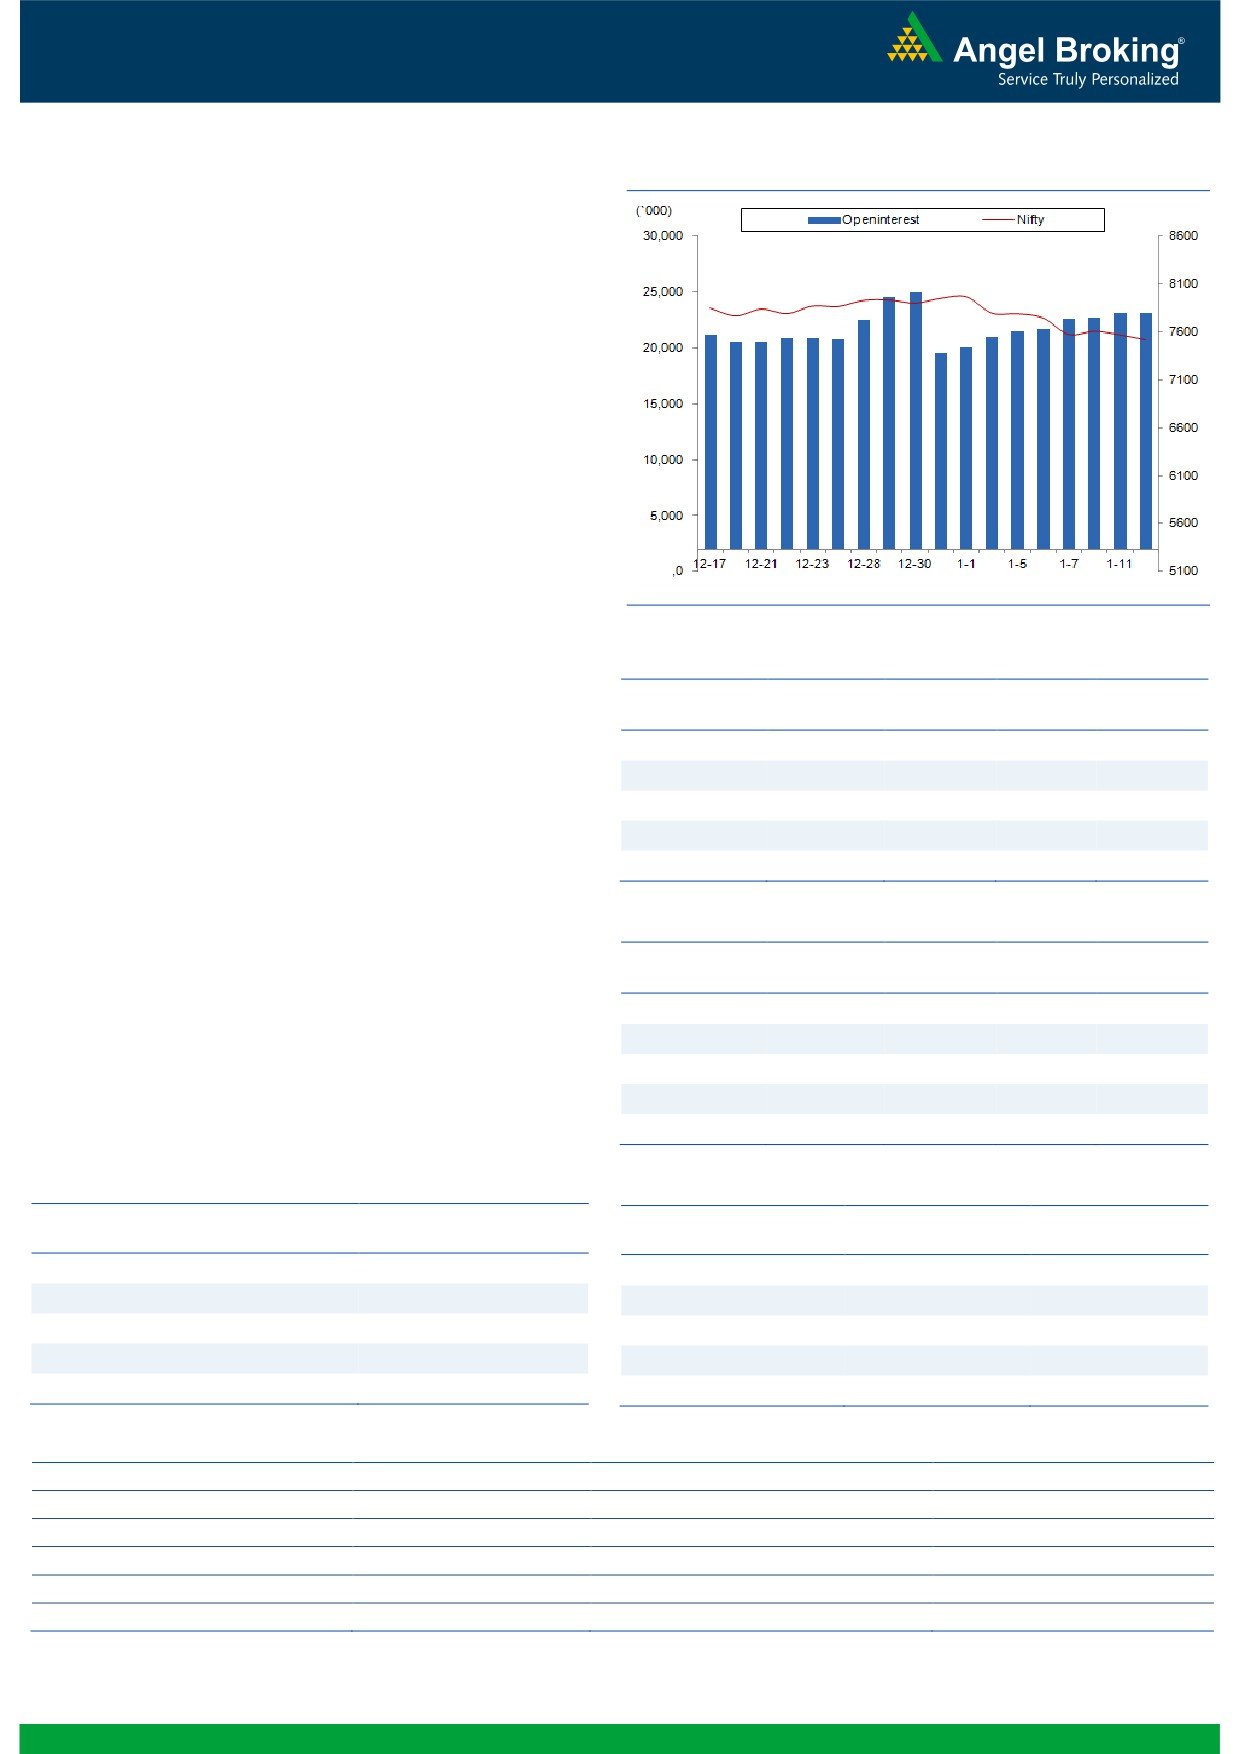
Exhibit 2: Bank Nifty Daily Chart
Bank Nifty Outlook - (15735)
In-line with the benchmark indices, the Nifty Bank index too
opened with marginal gains in yesterday’s session. Post the
gap up opening, the banking index started correcting from the
initial trades and continued to make lower lows throughout the
session. Eventually, the Nifty Bank index ended the session
with the deep cut of 1.76 percent over its previous close.
At current juncture, the Nifty Bank index is trading around the
lower end of the ‘Falling Channel’ in the daily chart. We are
also witnessing a formation of a ‘Bullish Three Drives Pattern’
in the daily chart, which indicates potential reversal in the
index. Thus, we advise positional traders to go long in the
BankNifty Future with the stoploss of 15480 levels. We may
see a rally towards 16400 - 16500 levels in upcoming
sessions. Going forward, intraday support for the Bank Nifty
index is placed at 15600 and 15500 levels; whereas, the
intraday resistance is placed at 15980 and 16170 levels.
Key Levels
Support 1 - 15600
Resistance 1 - 15980
Support 2 - 15500
Resistance 2 - 16170
1
Technical & Derivatives Report
January 13, 2016
Comments
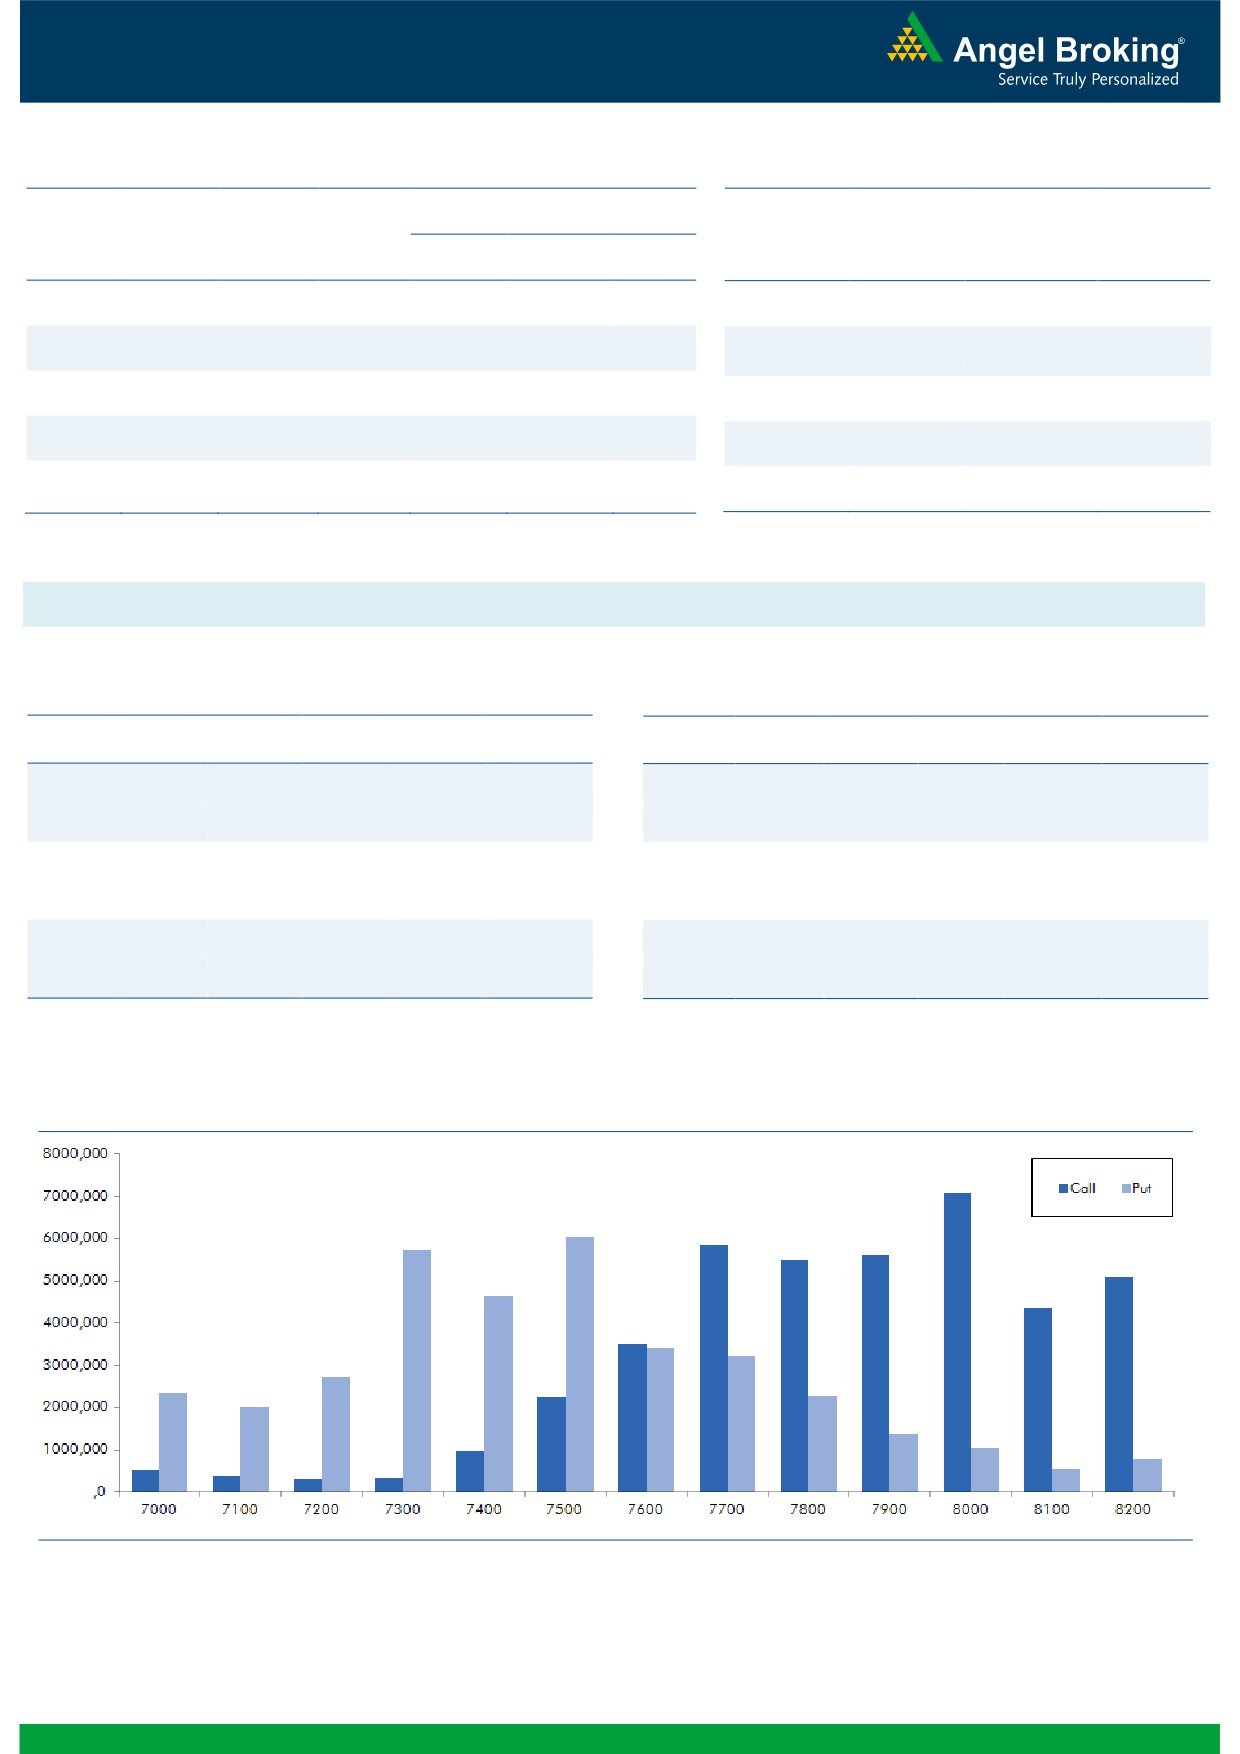
Nifty Vs OI
The Nifty futures open interest has decreased by 0.06%
BankNifty futures open interest has increased by 15.44%
as market closed at 7510.30 levels.
The Nifty January future closed at a premium of 23.75
points against a premium of 19.90 points. The February
series closed at a premium of 47.05 points.
The Implied Volatility of at the money options has
increased from 17.69% to 17.99 %.
The total OI of the market is Rs. 2,36,811/- cr. and the
stock futures OI is Rs. 64,840/- cr.
Few of the liquid counters where we have seen high cost
of carry are JPASSOCIAT, UNITECH, IFCI, JINDALSTEL
and JISLJALEQS.
OI Gainers
OI
PRICE
Views
SCRIP
OI
PRICE
CHG. (%)
CHG. (%)
In equity segment, FIIs continue sold to the tune of Rs.
DABUR
3632000
19.32
256.05
-3.16
540 crores. In Index Futures, they were net sellers of
UNITECH
305998000
15.73
6.30
-5.97
worth Rs. 248 with decent rise in OI, which suggest fresh
FEDERALBNK
23896000
15.42
48.35
-7.99
short formation in last trading session.
CONCOR
324000
13.13
1261.95
-1.44
In Index Options front, they sold marginally with good
ULTRACEMCO
1289400
12.36
2664.15
-2.14
amount of rise in open interest. In call options, 7600-
7700 strikes were active and they also added some
OI Losers
build-up. While in put options, 7300 strikes added some
OI
PRICE
OI. Maximum build-up in current series is visible in 8000
SCRIP
OI
PRICE
CHG. (%)
CHG. (%)
call and 7500 put options. In this correction, we are
GODREJCP
159200
-10.36
1271.05
2.74
hardly witnessing any meaningful short formation in
ABIRLANUVO
954750
-8.70
2185.00
-3.04
Nifty. We don’t expect major downside from current
CADILAHC
9586500
-6.86
321.00
1.45
levels, avoid forming shorts.
HDIL
19512000
-6.55
79.20
-3.06
HINDZINC
2022400
-6.37
141.50
0.96
Historical Volatility
Put-Call Ratio
SCRIP
HV
SCRIP
PCR-OI
PCR-VOL
FEDERALBNK
51.28
NIFTY
0.79
0.77
KTKBANK
39.88
BANKNIFTY
0.83
0.71
CANBK
38.93
SBIN
0.36
0.36
DABUR
28.74
TCS
1.21
1.02
BANKINDIA
44.48
LT
0.50
0.53
Strategy Date
Symbol
Strategy
Status
January 04, 2016
SBIN
Ratio Bear Put Spread
Active
January 11, 2016
TCS
Short Strangle
Active
2
Technical & Derivatives Report
January 13, 2016
FII Statistics for 12-January 2015
Turnover on 12-January 2015
Open Interest
No. of
Turnover
Change
Detail
Buy
Sell
Net
Instrument
Value
Change
Contracts
( in Cr. )
(%)
Contracts
(in Cr.)
(%)
INDEX
INDEX
1425.83
1674.29
(248.47)
285404
15579.84
2.58
283120
14932.02
-15.25
FUTURES
FUTURES
INDEX
INDEX
21850.91
21866.27
(15.36)
1251593
69627.19
4.03
2657316
149031.53
-19.81
OPTIONS
OPTIONS
STOCK
3500.69
3908.58
(407.89)
1066725
50343.34
1.19
STOCK
FUTURES
504841
25446.93
-3.12
FUTURES
STOCK
STOCK
2627.89
2613.22
14.67
66108
3119.15
7.17
OPTIONS
319392
16512.84
4.90
OPTIONS
TOTAL
29405.31
30062.36
(657.05)
2669830
138669.52
2.80
TOTAL
3764671
205923.48
-16.11
Nifty Spot = 7510.30
Lot Size = 75
Bull-Call Spreads
Bear-Put Spreads
Action
Strike
Price
Risk
Reward
BEP
Action
Strike
Price
Risk
Reward
BEP
Buy
7600
77.35
Buy
7500
98.15
35.70
64.30
7635.70
32.70
67.30
7467.30
Sell
7700
41.65
Sell
7400
65.45
Buy
7600
77.35
Buy
7500
98.15
56.45
143.55
7656.45
55.40
144.60
7444.60
Sell
7800
20.90
Sell
7300
42.75
Buy
7700
41.65
Buy
7400
65.45
20.75
79.25
7720.75
22.70
77.30
7377.30
Sell
7800
20.90
Sell
7300
42.75
Note: Above mentioned Bullish or Bearish Spreads in Nifty (Jan. Series) are given as an information and not as a recommendation.
Nifty Put-Call Analysis
3
Technical & Derivatives Report
January 13, 2016
Daily Pivot Levels for Nifty 50 Stocks
Scrips
S2
S1
PIVOT
R1
R2
ACC
1,259
1,270
1,285
1,296
1,311
ADANIPORTS
231
234
237
240
243
AMBUJACEM
191
193
196
198
201
ASIANPAINT
861
867
876
882
892
AXISBANK
390
398
409
418
429
BAJAJ-AUTO
2,313
2,329
2,353
2,369
2,393
BANKBARODA
130
132
136
139
143
BHARTIARTL
306
311
318
323
330
BHEL
147
149
151
153
155
BOSCHLTD
17,898
18,015
18,137
18,254
18,377
BPCL
874
882
891
899
908
CAIRN
124
126
127
129
130
CIPLA
600
606
611
617
623
COALINDIA
310
313
315
318
321
DRREDDY
2,866
2,895
2,919
2,947
2,971
GAIL
359
363
368
372
377
GRASIM
3,419
3,484
3,568
3,633
3,716
HCLTECH
788
799
809
820
830
HDFC
1,132
1,142
1,156
1,165
1,179
HDFCBANK
1,031
1,039
1,051
1,059
1,072
HEROMOTOCO
2,431
2,449
2,480
2,498
2,528
HINDALCO
73
74
76
78
80
HINDUNILVR
798
809
815
826
833
ICICIBANK
232
234
238
241
244
IDEA
120
123
127
130
134
INDUSINDBK
883
898
920
935
957
INFY
1,016
1,033
1,048
1,065
1,080
ITC
310
313
315
317
319
KOTAKBANK
676
684
692
700
709
LT
1,157
1,168
1,184
1,195
1,211
LUPIN
1,677
1,689
1,704
1,715
1,730
M&M
1,144
1,163
1,175
1,194
1,206
MARUTI
4,219
4,243
4,284
4,308
4,349
NTPC
141
143
145
146
148
ONGC
218
219
222
224
226
PNB
97
98
101
102
105
POWERGRID
139
141
144
146
149
RELIANCE
1,026
1,036
1,051
1,060
1,075
SBIN
195
197
201
203
207
VEDL
80
82
85
87
89
SUNPHARMA
779
783
789
793
799
TATAMOTORS
345
350
357
362
369
TATAPOWER
65
66
67
68
69
TATASTEEL
236
241
248
253
260
TCS
2,268
2,297
2,331
2,361
2,395
TECHM
494
501
505
512
516
ULTRACEMCO
2,613
2,642
2,687
2,715
2,760
WIPRO
524
536
544
556
564
YESBANK
649
661
680
692
711
ZEEL
401
404
408
411
415
4
Technical & Derivatives Report
January 13, 2016
Research Team Tel: 022 - 39357800
For Technical Queries
For Derivatives Queries
DISCLAIMER
Angel Broking Private Limited (hereinafter referred to as “Angel”) is a registered Member of National Stock Exchange of India Limited,
Bombay Stock Exchange Limited and MCX Stock Exchange Limited. It is also registered as a Depository Participant with CDSL and
Portfolio Manager with SEBI. It also has registration with AMFI as a Mutual Fund Distributor. Angel Broking Private Limited is a
registered entity with SEBI for Research Analyst in terms of SEBI (Research Analyst) Regulations, 2014 vide registration number
INH000000164. Angel or its associates has not been debarred/ suspended by SEBI or any other regulatory authority for accessing
/dealing in securities Market. Angel or its associates including its relatives/analyst do not hold any financial interest/beneficial
ownership of more than 1% in the company covered by Analyst. Angel or its associates/analyst has not received any compensation /
managed or co-managed public offering of securities of the company covered by Analyst during the past twelve months. Angel/analyst
has not served as an officer, director or employee of company covered by Analyst and has not been engaged in market making activity
of the company covered by Analyst.
This document is solely for the personal information of the recipient, and must not be singularly used as the basis of any investment
decision. Nothing in this document should be construed as investment or financial advice. Each recipient of this document should
make such investigations as they deem necessary to arrive at an independent evaluation of an investment in the securities of the
companies referred to in this document (including the merits and risks involved), and should consult their own advisors to determine
the merits and risks of such an investment.
Reports based on technical and derivative analysis center on studying charts of a stock's price movement, outstanding positions and
trading volume, as opposed to focusing on a company's fundamentals and, as such, may not match with a report on a company's
fundamentals.
The information in this document has been printed on the basis of publicly available information, internal data and other reliable
sources believed to be true, but we do not represent that it is accurate or complete and it should not be relied on as such, as this
document is for general guidance only. Angel Broking Pvt. Limited or any of its affiliates/ group companies shall not be in any way
responsible for any loss or damage that may arise to any person from any inadvertent error in the information contained in this report.
Angel Broking Pvt. Limited has not independently verified all the information contained within this document. Accordingly, we cannot
testify, nor make any representation or warranty, express or implied, to the accuracy, contents or data contained within this document.
While Angel Broking Pvt. Limited endeavors to update on a reasonable basis the information discussed in this material, there may be
regulatory, compliance, or other reasons that prevent us from doing so.
This document is being supplied to you solely for your information, and its contents, information or data may not be reproduced,
redistributed or passed on, directly or indirectly.
Neither Angel Broking Pvt. Limited, nor its directors, employees or affiliates shall be liable for any loss or damage that may arise from
or in connection with the use of this information.
Note: Please refer to the important ‘Stock Holding Disclosure' report on the Angel website (Research Section). Also, please refer to the
latest update on respective stocks for the disclosure status in respect of those stocks. Angel Broking Pvt. Limited and its affiliates may
have investment positions in the stocks recommended in this report.
5