Technical & Derivatives Report
September 12, 2016
Sensex (28797) / Nifty (8867)
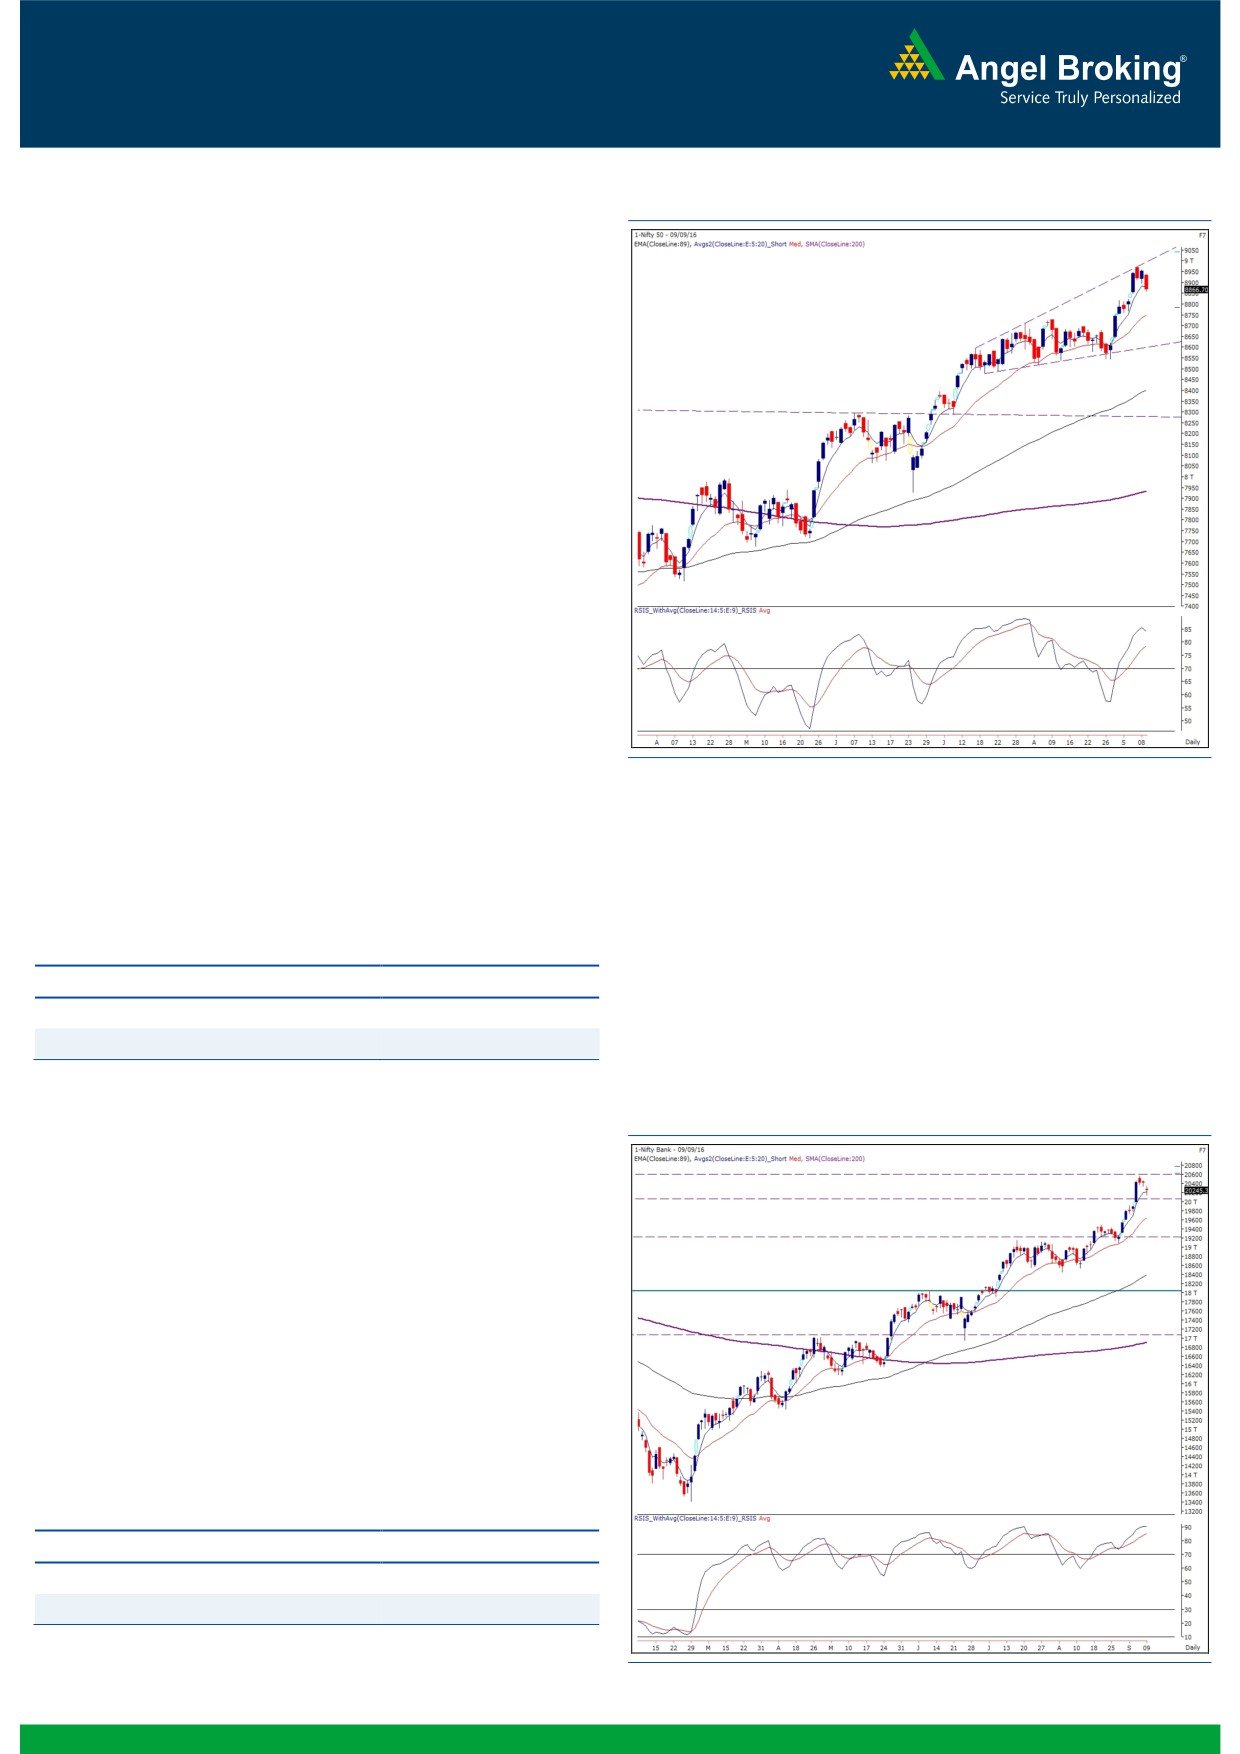
Exhibit 1: Nifty Daily Chart
After witnessing a strong up move from the lows of 8540, the
Nifty continued with its northbound journey targeting the 9000
mark. Despite strong momentum, we emphasized on lightening
up existing longs which we believe was a prudent strategy. The
key observation backing our view was the emergence of the
‘Megaphone’ pattern on the daily chart and the higher end of the
same was seen around 8960 - 8980 levels. Very much on our
expected lines, we saw some profit booking on Friday, which was
relatively more pronounced in banking and IT counters. Now, on
the daily chart, the Nifty has closed a tad below its ‘5 EMA’ while
on the lower degree (hourly) chart, there’s been a formation on
the ‘Lower Top Lower Bottom’ pattern. In addition, the ‘Shooting
Star’ pattern on the weekly chart is clearly visible. All these
evidences justify our cautious stance at higher levels.
Going ahead, we expect further profit booking to pan out,
thereby dragging the Nifty towards 8800 - 8750 levels if not
lower. Nevertheless, 8750 on the Nifty now stands as a strong
support in the upcoming week. Only a sustainable move below
this level could trigger further weakness in the market. On the
flipside, 8939 - 8970 are seen as immediate hurdles for the
index. To summarize, we expect the index to remain in a slightly
broader range of
8970 to
8750 before taking a decisive
direction.
Key Levels
Support 1 - 8800
Resistance 1 - 8939
Support 2 - 8750
Resistance 2 - 8970
Nifty Bank Outlook - (20245)
Exhibit 2: Nifty Bank Daily Chart
The Nifty Bank index opened gap down on Friday and started
correcting from initial trades. The banking index fell sharply in
first half of the session; however, we saw some buying interest
from lower levels in later half. Eventually, the Nifty Bank index
ended the session with loss of 0.84 percent.
The banking index has started correction from higher end of the
‘Rising Channel’ on daily chart. Going forward, ‘Gap area’ of
19911 - 19990 (formed on Sept 06, 2016) would act as strong
support of the Nifty Bank index and a sustainable move below
that may result into a fall towards 19600. On the flipside,
resistance is placed at 20380 and 20500 levels.
Key Levels
Support 1 - 19911
Resistance 1 - 20380
Support 2 - 19735
Resistance 2 - 20500
1
Technical & Derivatives Report
September 12, 2016
Comments
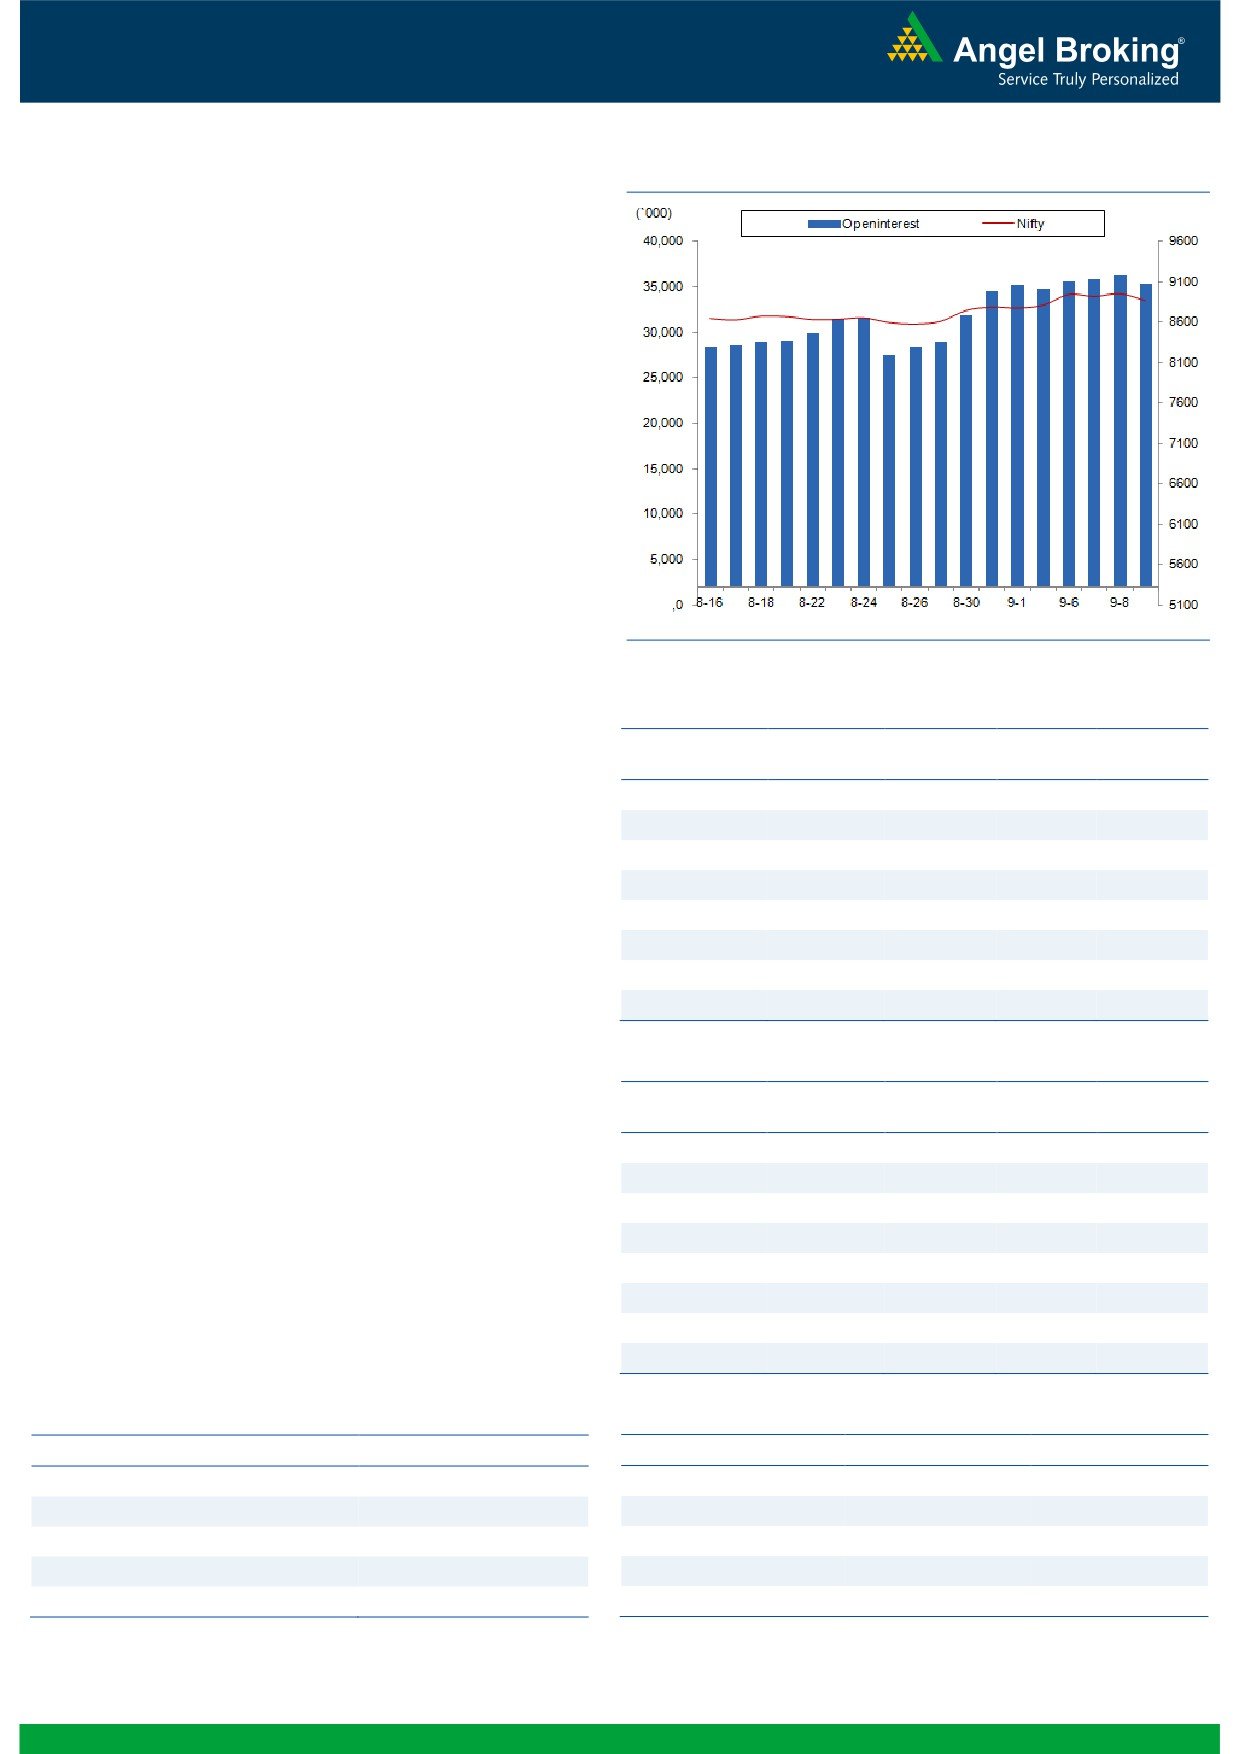
Nifty Vs OI
The Nifty futures open interest has decreased by 2.45%
BankNifty futures open interest has decreased by 5.23%
as market closed at 8866.70 levels.
The Nifty September future closed with a premium of
37.05 points against a premium of 30.05 points in
previous session. The October series closed at a
premium of 76.40 points.
The Implied Volatility of at the money options has
increased from 11.06% to 11.56%. At the same time, the
PCR-OI of Nifty has decreased from 1.23 to 1.18.
The total OI of the market is Rs. 2,96,658/- cr. and the
stock futures OI is Rs. 85,186/- cr.
Few of the liquid counters where we have seen high cost
of carry are JPASSOCIAT, ICIL, IFCI, ADANIPOWER and
GMRINFRA.
Views
OI Gainers
FIIs after long time were net sellers in both cash market
OI
PRICE
segment and Index Futures. On Friday, they sold equities
SCRIP
OI
PRICE
CHG. (%)
CHG. (%)
to the tune of Rs. 315 crores. While, they were net sellers
TORNTPHARM
373600
19.59
1669.20
-1.41
in index future of Rs. 372 crores with fall in OI, indicating
HINDPETRO
9987600
12.85
1247.40
-0.08
some profit booking in last trading session.
NCC
34496000
9.41
88.40
-0.95
On Index Options front, FIIs were net buyers of Rs. 964ng.com
BIOCON
4341700
8.11
912.75
-2.23
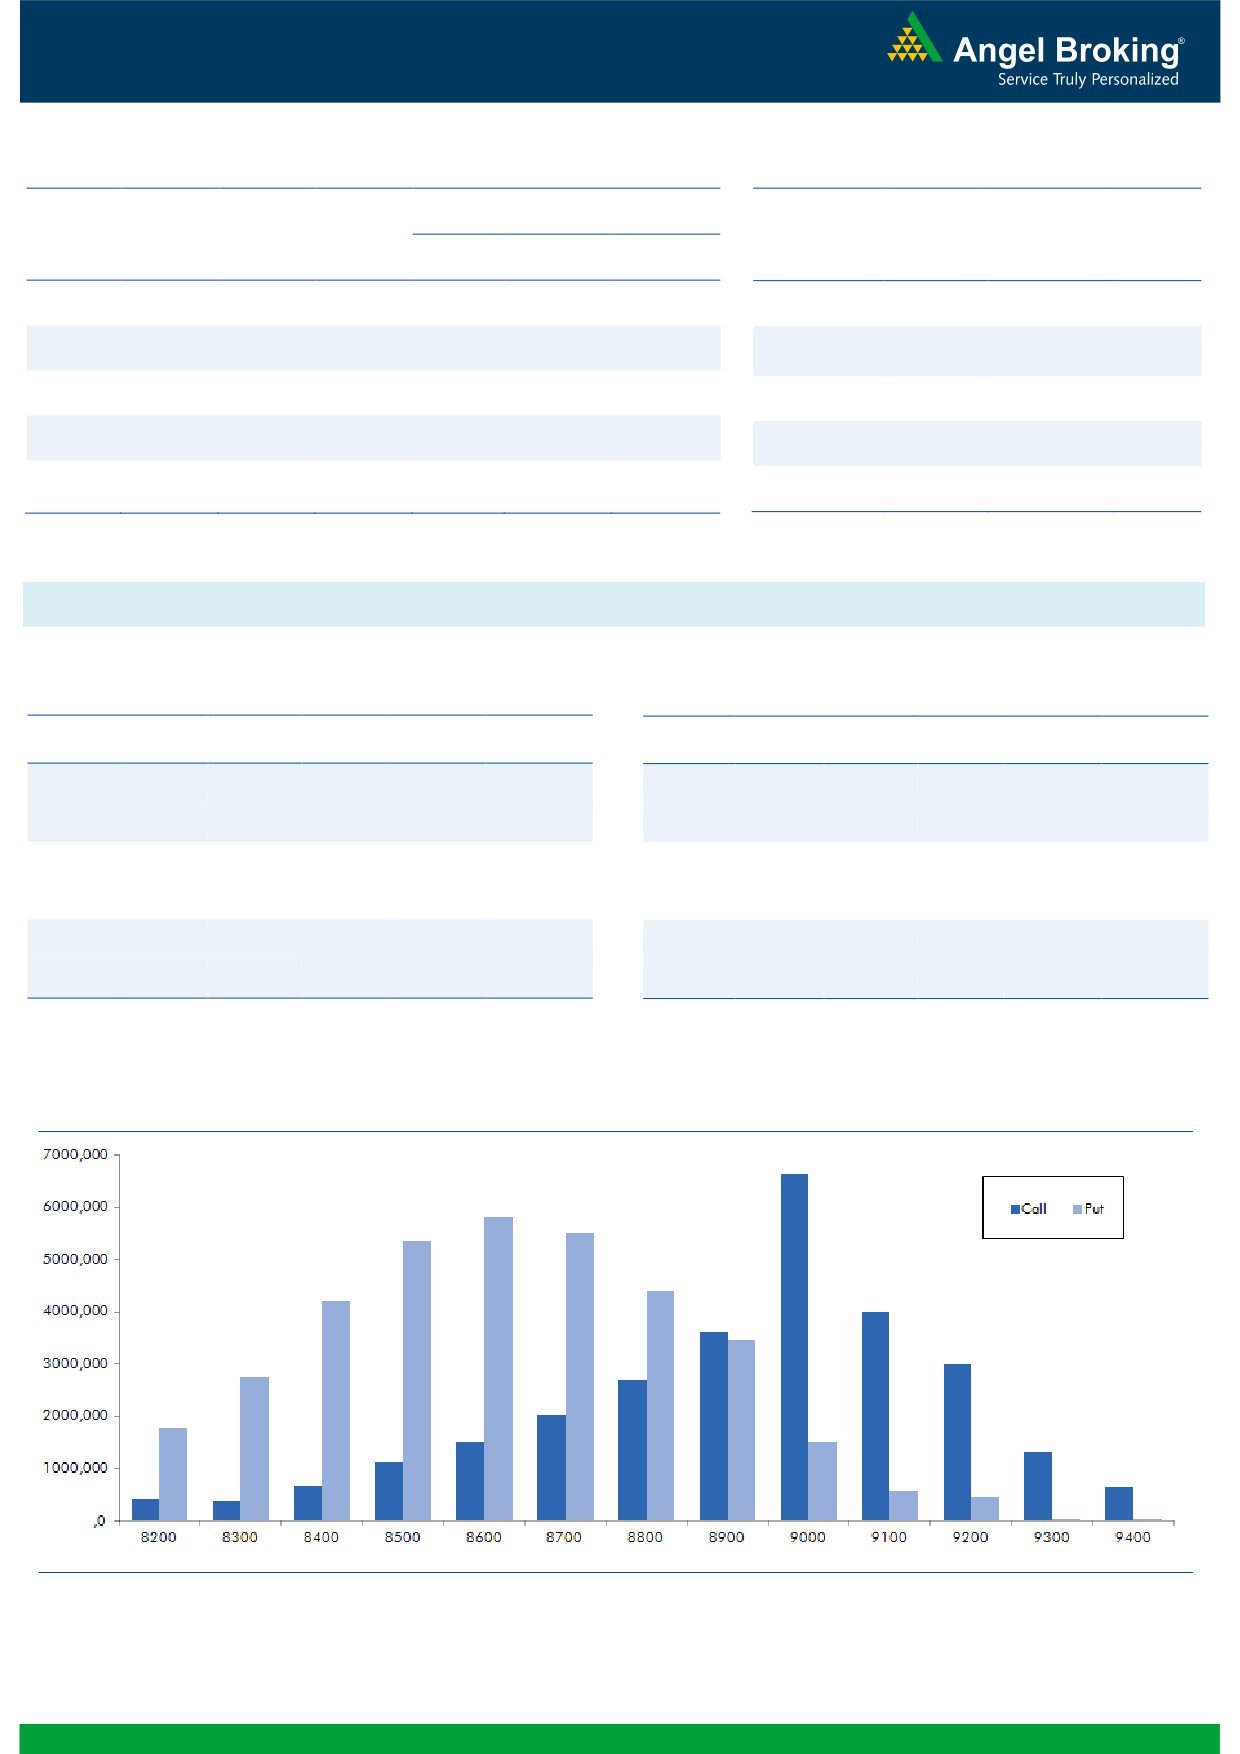
crores with rise in OI. In call options, 9000 and 9100
CADILAHC
3296000
7.80
390.90
-1.05
remained active and they also added good amount of
APOLLOHOSP
568800
7.56
1359.15
-0.89
positions. On the other hand, in put options, we hardly
HINDZINC
5577600
6.28
221.15
-1.60
saw any strikes adding meaningful OI. We witness some
RELCAPITAL
12552000
6.23
556.50
0.42
unwinding in 8800 put options. Highest OI in September
series is placed at 9000 call and 8600 put option.
On Friday, we saw some profit booking; but, the
OI Losers
OI
PRICE
quantum wasn’t significant. At current juncture, Nifty has
SCRIP
OI
PRICE
CHG. (%)
CHG. (%)
immediate support around 8750-8800 levels. Global
OIL
2040000
-12.09
392.15
0.97
clues are suggesting that Nifty may open gap down.
CENTURYTEX
7814400
-11.71
834.60
2.59
Traders should avoid taking positions aggressively in this
PCJEWELLER
493500
-11.56
484.65
-0.09
move as derivatives data is not showing any signs of
JSWENERGY
20064000
-11.16
82.35
3.00
reversal yet.
CESC
1331000
-8.95
643.30
-4.36
MRF
56385
-7.73
40250.50
0.27
AMBUJACEM
9747500
-7.03
273.75
-1.32
STAR
2701500
-6.25
984.20
0.71
Historical Volatility
Put-Call Ratio
SCRIP
HV
SCRIP
PCR-OI
PCR-VOL
CESC
29.02
NIFTY
1.18
1.08
ADANIPOWER
33.63
BANKNIFTY
1.09
0.83
ULTRACEMCO
34.27
RELIANCE
0.46
0.56
ONGC
28.78
YESBANK
0.54
0.53
SAIL
51.56
ICICIBANK
0.60
0.53
2
Technical & Derivatives Report
September 12, 2016
FII Statistics for 09, September 2016
Turnover on 09, September 2016
Open Interest
No. of
Turnover
Change
Detail
Buy
Sell
Net
Instrument
Value
Contracts
( in Cr. )
(%)
Contracts
Change (%)
(in Cr.)
INDEX
INDEX
2034.07
2406.22
(372.15)
456248
31091.54
(1.47)
232928
16783.25
41.46
FUTURES
FUTURES
INDEX
INDEX
43293.72
42329.74
963.98
1192999
81599.21
3.10
3291871
241212.85
-36.43
OPTIONS
OPTIONS
STOCK
7397.32
9040.56
(1643.25)
891513
60498.46
0.46
STOCK
FUTURES
661255
48463.46
4.66
FUTURES
STOCK
STOCK
6550.60
6555.21
(4.61)
108323
7664.75
5.50
OPTIONS
418912
31105.64
2.91
OPTIONS
TOTAL
59275.71
60331.73
(1056.02)
2649083
180853.96
1.49
TOTAL
4604966
337565.19
-27.84
Nifty Spot = 8866.70
Lot Size = 75
Bull-Call Spreads
Bear-Put Spreads
Action
Strike
Price
Risk
Reward
BEP
Action
Strike
Price
Risk
Reward
BEP
Buy
8900
97.15
Buy
8900
93.55
44.85
55.15
8944.85
36.75
63.25
8863.25
Sell
9000
52.30
Sell
8800
56.80
Buy
8900
97.15
Buy
8900
93.55
73.30
126.70
8973.30
59.80
140.20
8840.20
Sell
9100
23.85
Sell
8700
33.75
Buy
9000
52.30
Buy
8800
56.80
28.45
71.55
9028.45
23.05
76.95
8776.95
Sell
9100
23.85
Sell
8700
33.75
Note: Above mentioned Bullish or Bearish Spreads in Nifty (September Series) are given as an information and not as a recommendation.
Nifty Put-Call Analysis
3
Technical & Derivatives Report
September 12, 2016
Daily Pivot Levels for Nifty Constituents
Scrips
S2
S1
PIVOT
R1
R2
ACC
1,624
1,639
1,666
1,681
1,708
ADANIPORTS
267
270
273
275
278
AMBUJACEM
269
271
273
275
278
ASIANPAINT
1,160
1,166
1,174
1,180
1,188
AUROPHARMA
788
795
807
814
826
AXISBANK
604
608
617
621
630
BAJAJ-AUTO
2,964
3,000
3,054
3,090
3,144
BANKBARODA
169
171
173
174
176
BHEL
151
152
155
156
159
BPCL
580
584
590
594
599
BHARTIARTL
314
318
322
326
331
INFRATEL
340
346
355
361
370
BOSCH
23,848
24,006
24,228
24,386
24,608
CIPLA
567
574
585
591
602
COALINDIA
329
331
332
333
334
DRREDDY
3,142
3,168
3,196
3,222
3,251
EICHERMOT
22,408
22,666
23,120
23,378
23,832
GAIL
383
389
394
400
405
GRASIM
4,638
4,672
4,726
4,760
4,813
HCLTECH
765
773
781
789
798
HDFCBANK
1,272
1,281
1,288
1,297
1,304
HDFC
1,371
1,391
1,416
1,436
1,462
HEROMOTOCO
3,493
3,557
3,631
3,695
3,769
HINDALCO
148
152
157
160
166
HINDUNILVR
911
920
937
947
964
ICICIBANK
268
271
273
277
279
IDEA
82
83
84
85
86
INDUSINDBK
1,190
1,204
1,214
1,228
1,238
INFY
1,020
1,028
1,034
1,042
1,049
ITC
253
255
260
263
267
KOTAKBANK
801
810
818
827
834
LT
1,492
1,505
1,523
1,536
1,554
LUPIN
1,550
1,560
1,574
1,584
1,598
M&M
1,441
1,457
1,477
1,493
1,513
MARUTI
5,310
5,357
5,423
5,470
5,536
NTPC
157
158
159
160
162
ONGC
243
249
253
259
264
POWERGRID
181
183
185
186
188
RELIANCE
1,022
1,033
1,041
1,053
1,061
SBIN
260
262
265
267
270
SUNPHARMA
779
788
803
813
828
TCS
2,300
2,326
2,346
2,373
2,393
TATAMTRDVR
357
360
365
368
372
TATAMOTORS
565
569
576
580
587
TATAPOWER
76
77
78
78
79
TATASTEEL
385
390
398
403
412
TECHM
444
451
458
465
473
ULTRACEMCO
3,816
3,885
4,002
4,071
4,188
WIPRO
471
476
479
484
488
YESBANK
1,211
1,244
1,279
1,312
1,347
ZEEL
527
530
535
538
543
4
Technical & Derivatives Report
September 12, 2016
Research Team Tel: 022 - 39357800
For Technical Queries
For Derivatives Queries
DISCLAIMER
Angel Broking Private Limited (hereinafter referred to as “Angel”) is a registered Member of National Stock Exchange of India Limited,
Bombay Stock Exchange Limited and Metropolitan Stock Exchange Limited. It is also registered as a Depository Participant with CDSL
and Portfolio Manager with SEBI. It also has registration with AMFI as a Mutual Fund Distributor. Angel Broking Private Limited is a
registered entity with SEBI for Research Analyst in terms of SEBI (Research Analyst) Regulations, 2014 vide registration number
INH000000164. Angel or its associates has not been debarred/ suspended by SEBI or any other regulatory authority for accessing
/dealing in securities Market. Angel or its associates/analyst has not received any compensation / managed or co-managed public
offering of securities of the company covered by Analyst during the past twelve months.
This document is solely for the personal information of the recipient, and must not be singularly used as the basis of any investment
decision. Nothing in this document should be construed as investment or financial advice. Each recipient of this document should
make such investigations as they deem necessary to arrive at an independent evaluation of an investment in the securities of the
companies referred to in this document (including the merits and risks involved), and should consult their own advisors to determine
the merits and risks of such an investment.
Reports based on technical and derivative analysis center on studying charts of a stock's price movement, outstanding positions and
trading volume, as opposed to focusing on a company's fundamentals and, as such, may not match with a report on a company's
fundamentals. Investors are advised to refer the Fundamental and Technical Research Reports available on our website to evaluate the
contrary view, if any.
The information in this document has been printed on the basis of publicly available information, internal data and other reliable
sources believed to be true, but we do not represent that it is accurate or complete and it should not be relied on as such, as this
document is for general guidance only. Angel Broking Pvt. Limited or any of its affiliates/ group companies shall not be in any way
responsible for any loss or damage that may arise to any person from any inadvertent error in the information contained in this report.
Angel Broking Pvt. Limited has not independently verified all the information contained within this document. Accordingly, we cannot
testify, nor make any representation or warranty, express or implied, to the accuracy, contents or data contained within this document.
While Angel Broking Pvt. Limited endeavors to update on a reasonable basis the information discussed in this material, there may be
regulatory, compliance, or other reasons that prevent us from doing so.
This document is being supplied to you solely for your information, and its contents, information or data may not be reproduced,
redistributed or passed on, directly or indirectly.
Neither Angel Broking Pvt. Limited, nor its directors, employees or affiliates shall be liable for any loss or damage that may arise from
or in connection with the use of this information.
5