Technical & Derivatives Report
July 12, 2016
Sensex (27627) / Nifty (8468)
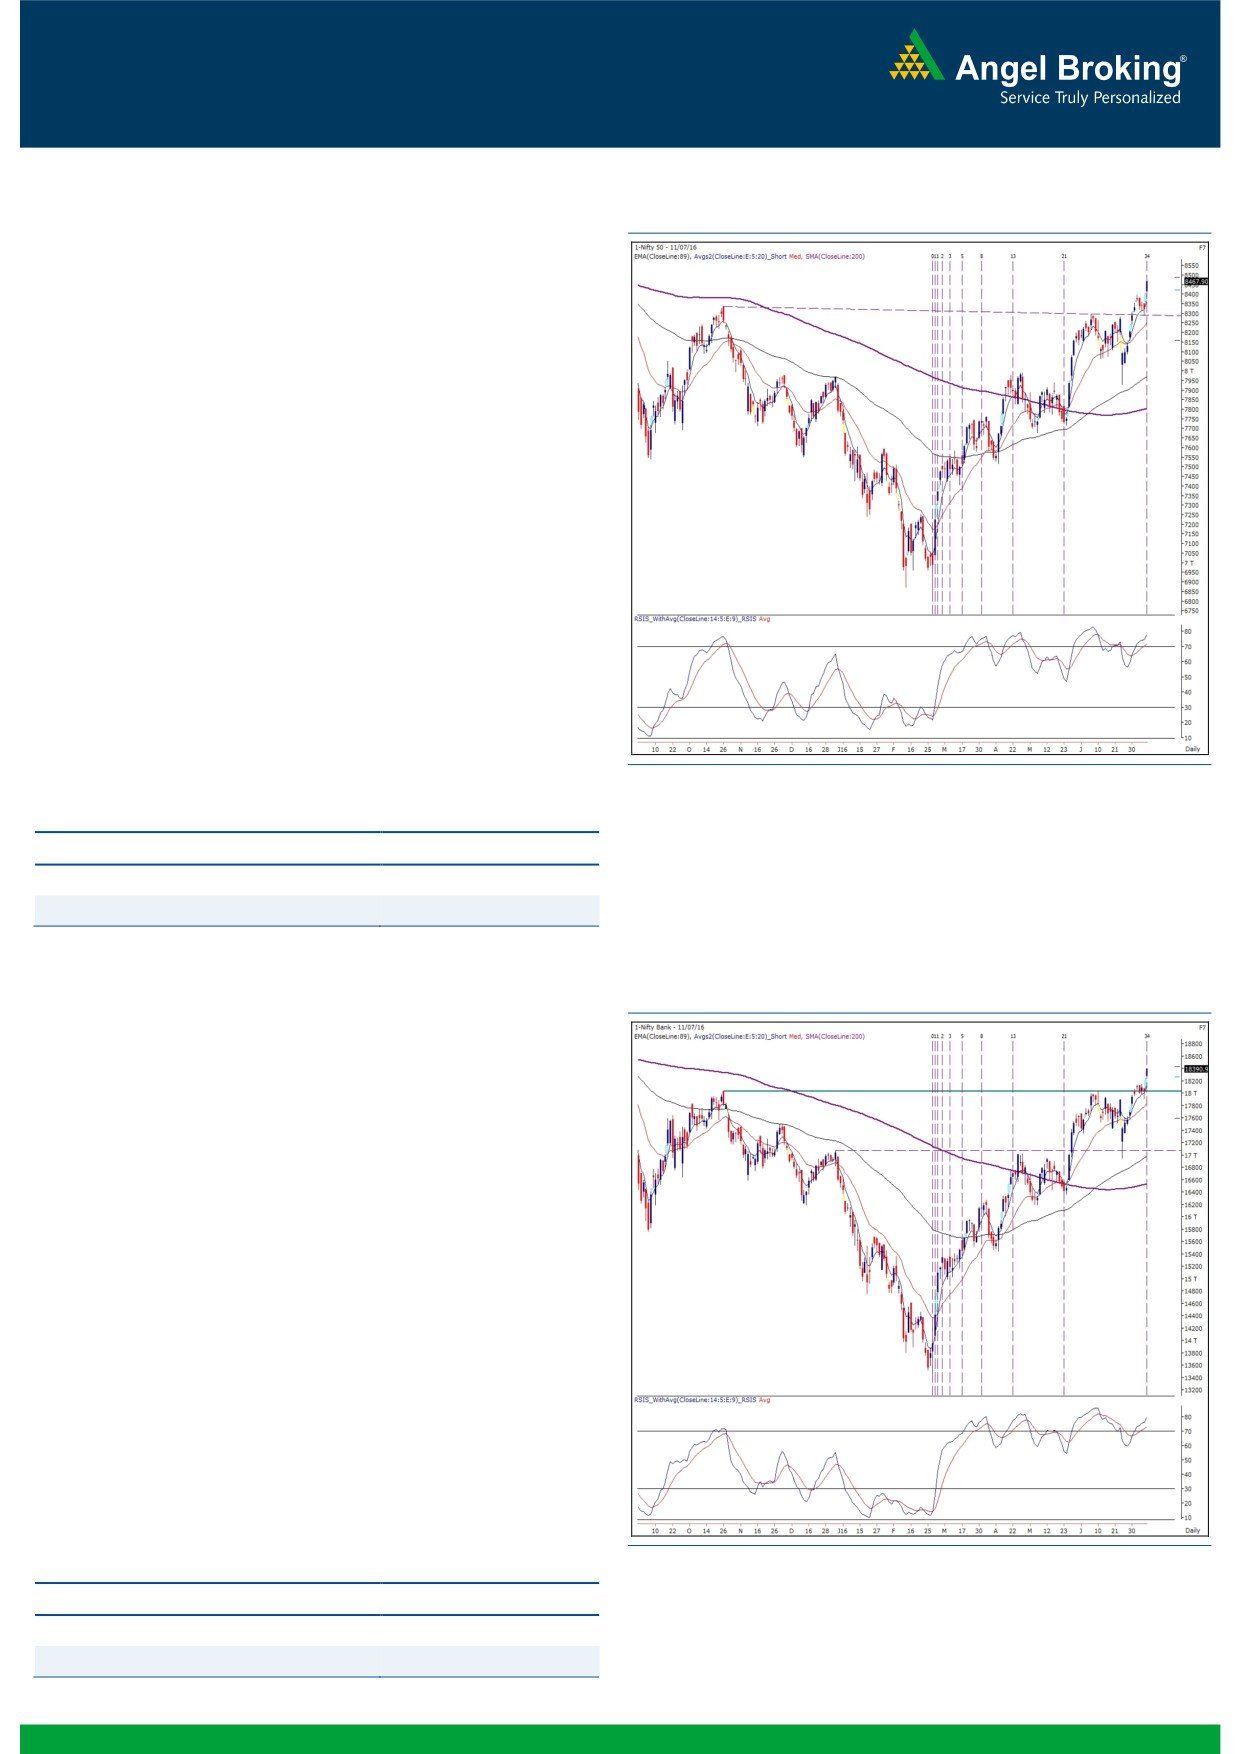
Exhibit 1: Nifty Daily Chart
Trading for the week kick started on a cheerful note mirroring to
strong cues from the global peers. In fact, the index managed to
extend this lead as we witnessed a gradual march to end the
session with smart gains of 1.74% over its previous close.
Yesterday, the benchmark index opened well above the 8400
mark and kept the momentum going throughout the session. This
move was clearly a broad-based rally as the advance-decline
ratio was clearly in favor of the bulls. If we refer to our previous
report, we had mentioned a possibility of a bullish momentum as
the index was about to enter a new ‘Time Zone’ (of 55 sessions)
as per the ‘Fibonacci Time Series’. Very much on our expected
lines, this development provided impetus to the move. We
maintain our view that the market is in a strong up trend and
thus, traders should stay with the flow rather than taking
contradictory positions in the opposite direction. We expect this
momentum to continue first towards 8540 and then 8654.75
(July 2015 high). On the flipside, yesterday’s low of 8407 would
now be seen as an immediate support for the index.
Key Levels
Support 1 - 8407
Resistance 1 - 8540
Support 2 - 8350
Resistance 2 - 8600
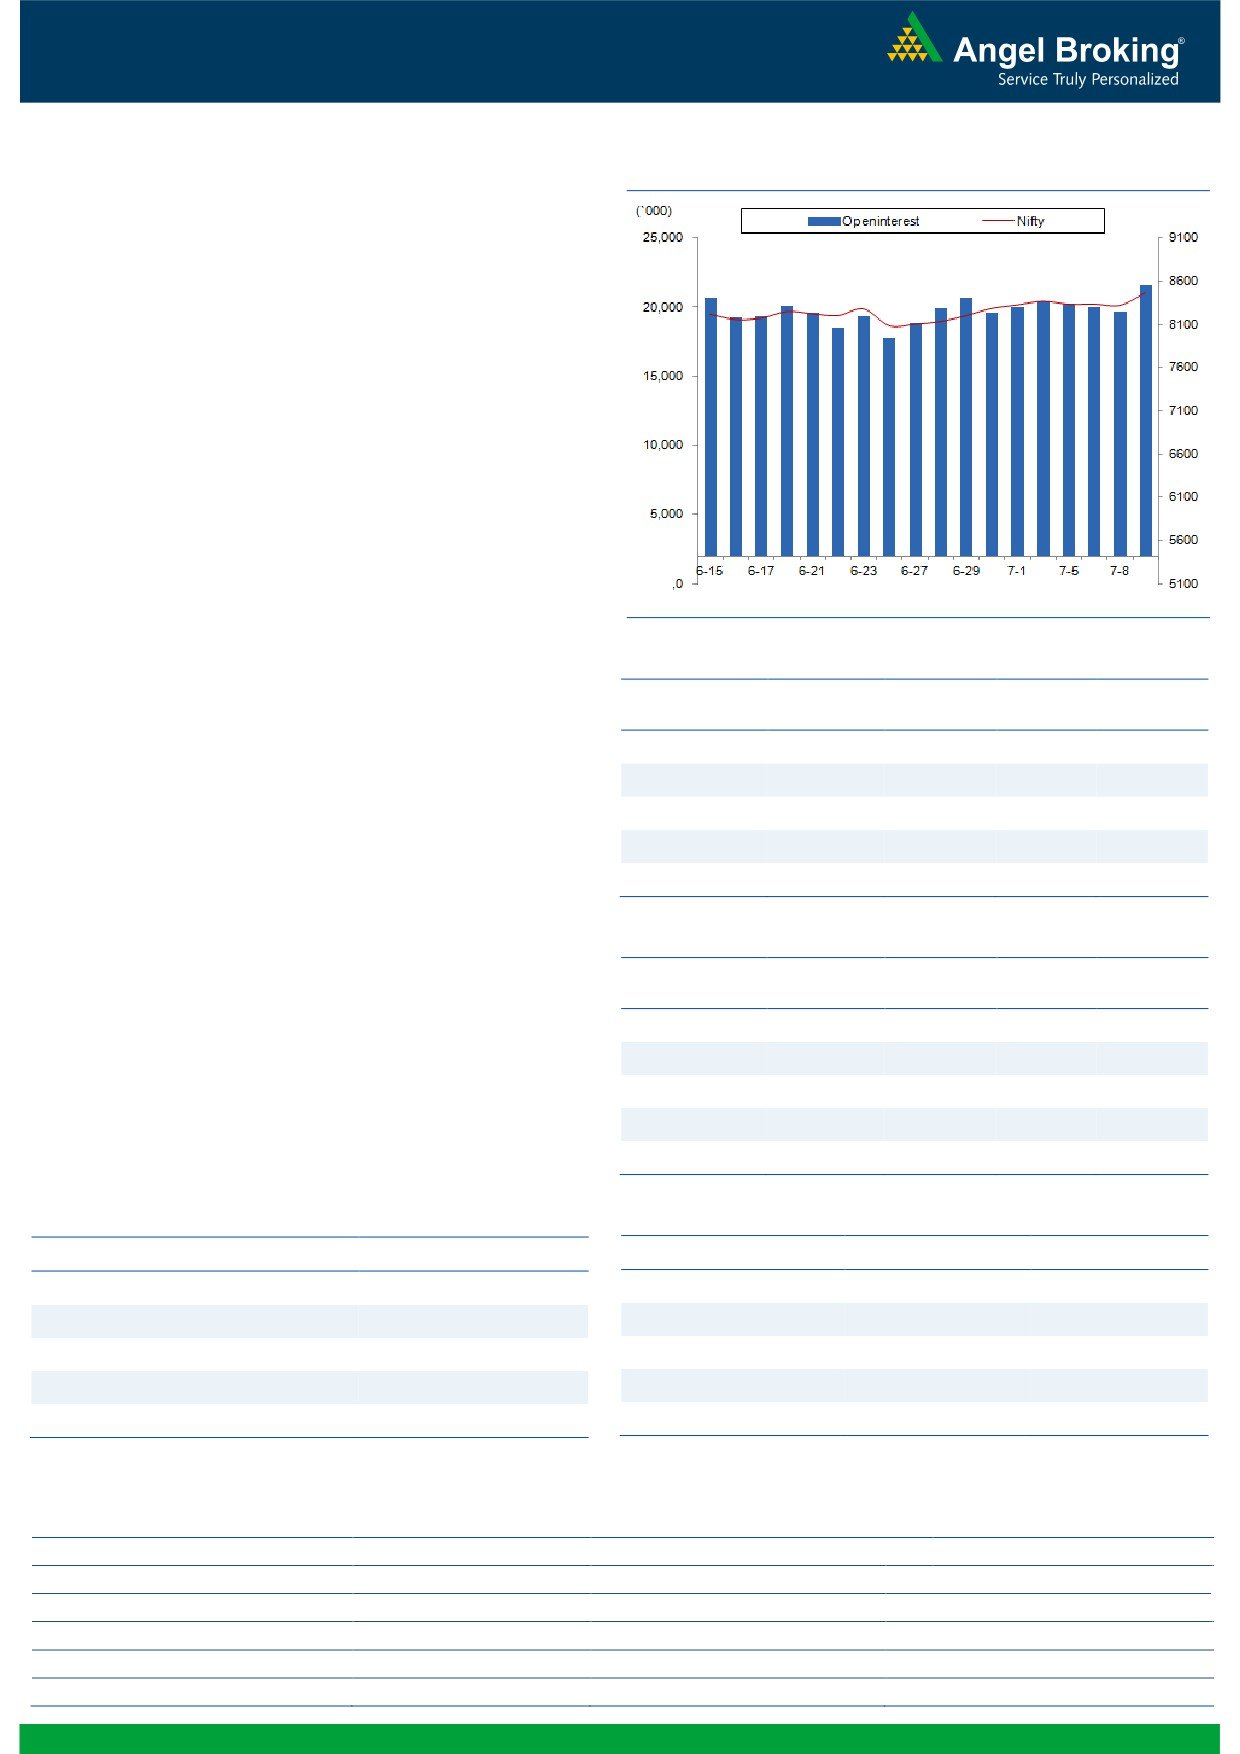
Nifty Bank Outlook - (18391)
Exhibit 2: Nifty Bank Daily Chart
The Nifty Bank index began the week on a positive note by
opening with an upside gap of around 250 points. Post the gap
up opening, the banking index continued to move higher
throughout the session and ended the session with gains of 2.08
percent over its previous close.
The Nifty Bank index has breached its yet another hurdle of
18050 - 18200 with a gap and managed to sustain above the
same. A long bullish candle after a consolidation of four sessions
certainly bodes well for the bulls. Considering the current
placement of momentum oscillator (RSI - smoothened) and key
moving averages, the banking index should continue its
northward journey towards
18800
- 18900 in forthcoming
sessions. Going forward, the earlier resistance of 18050 - 18200
would now act as strong support for the banking index; whereas,
intraday resistance is placed at 18570 - 18740. Traders are
advised to trade with a positive bias and use dips to initiate long
positions.
Key Levels
Support 1 - 18200
Resistance 1 - 18570
Support 2 - 18050
Resistance 2 - 18740
1
Technical & Derivatives Report
July 12, 2016
Comments
Nifty Vs OI
The Nifty futures open interest has increased by 9.58%
BankNifty futures open interest has increased by 11.31%
as market closed at 8467.90 levels.
The Nifty July future closed with a premium of 21.50
points against a premium of 13.25 points in previous
session. The August series closed at a premium of 56.65
points.
The Implied Volatility of at the money options has
decreased from 13.79% to 13.15%.
The total OI of the market is Rs. 2,30,344/- cr. and the
stock futures OI is Rs. 65,051/- cr.
Few of the liquid counters where we have seen high cost
of carry are GMRINFRA, UNITECH, IFCI, ADANIPOWER
and ADANIENT.
Views
OI Gainers
FIIs were net buyers in both cash market segment and in
OI
PRICE
Index Futures. They bought equities to the tune of Rs.
SCRIP
OI
PRICE
CHG. (%)
CHG. (%)
1056 crores. While in Index Futures, they were net buyers
CONCOR
479000
24.09
1460.15
-0.69
of Rs. 1126 crores with good amount of rise in open
INDUSINDBK
4387200
20.88
1130.60
0.11
interest, indicating fresh long formation.
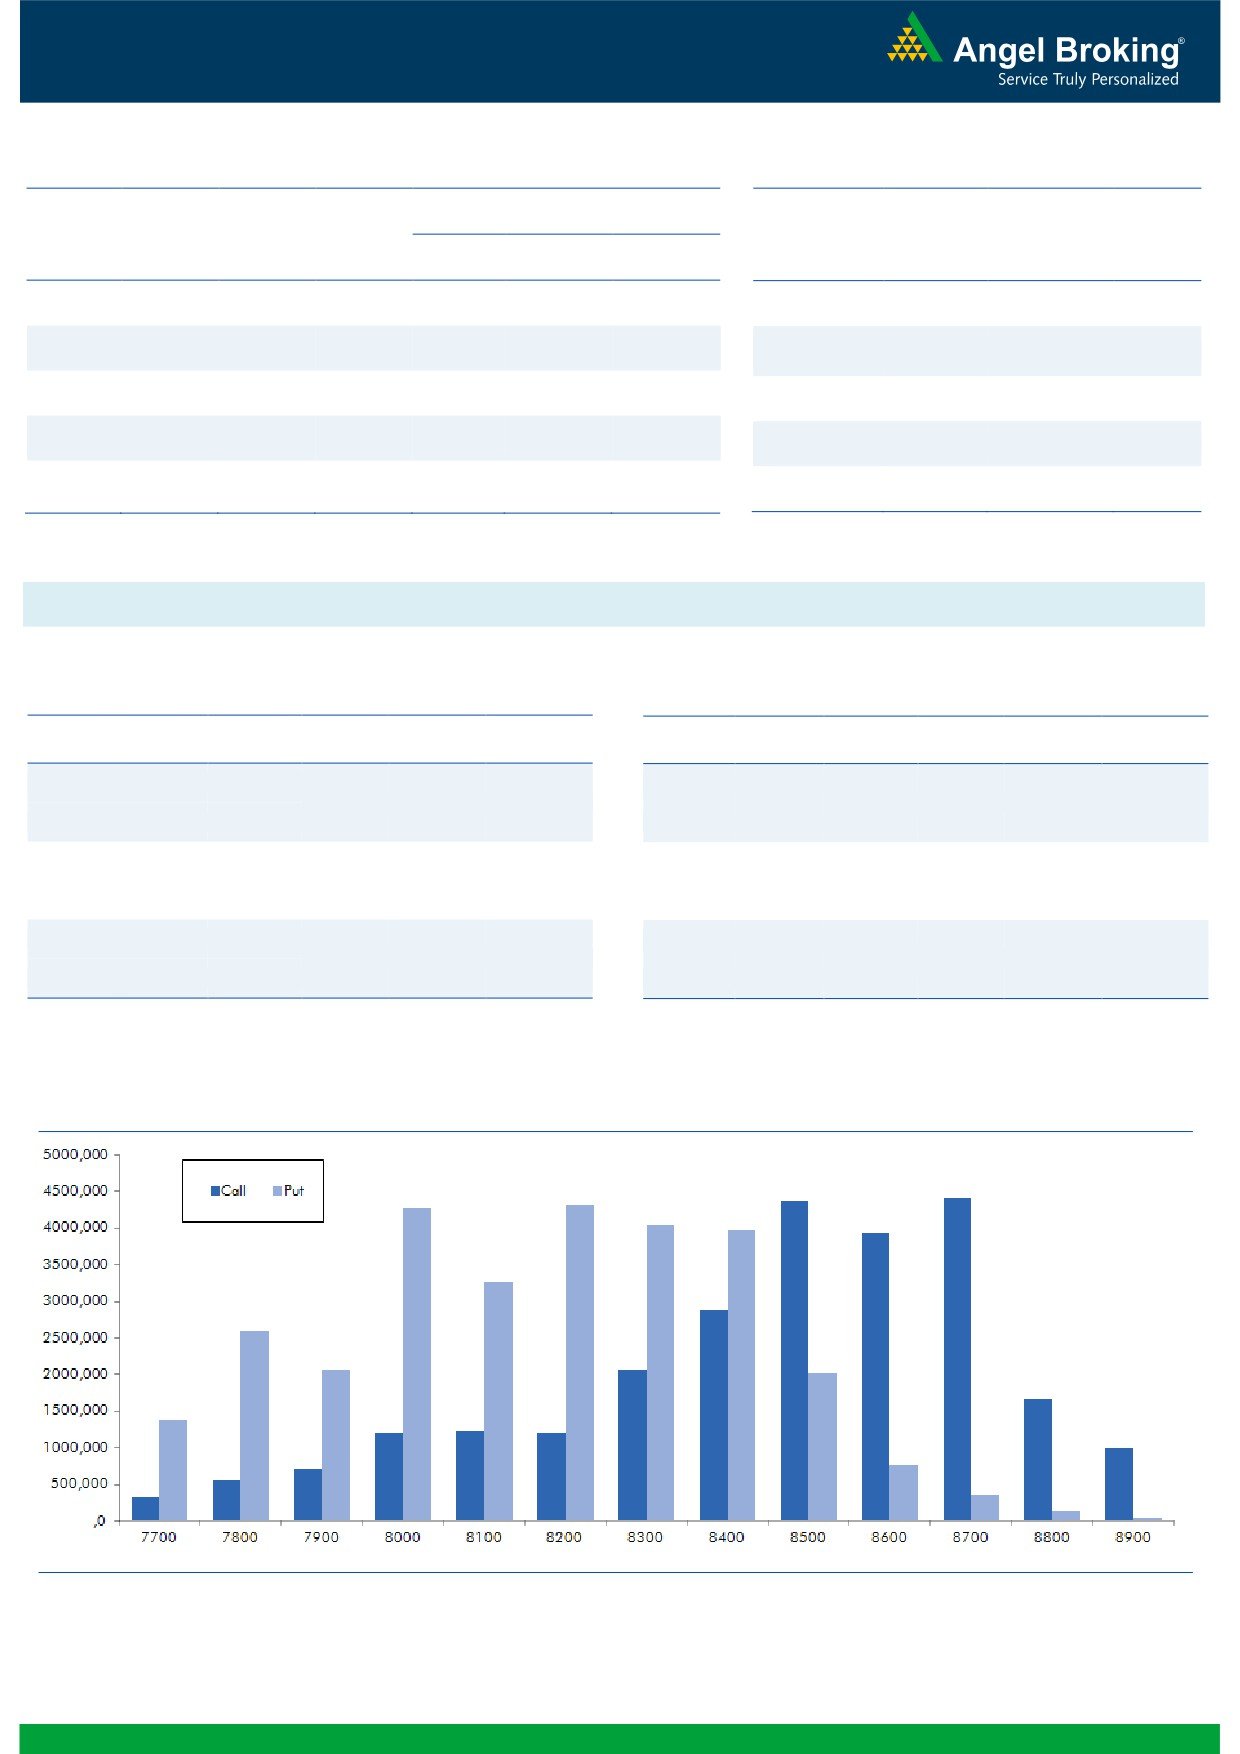
On Index Options front, FIIs bought significantly of worth
BPCL
10243800
17.62
1127.10
1.79
Rs. 1593 crores with rise in open interest. In call options,
ALBK
14760000
15.22
82.60
6.65
8600-8700 strikes added decent buil
up, followed by
ONGC
29072500
13.81
226.25
0.67
unwinding in 8300-8400 call options. On the other hand
in put options, 8300-8400 strikes added huge open
OI Losers
interest. While some unwinding was visible in 8100-
OI
PRICE
SCRIP
OI
PRICE
8200 put options. Maximum open interest in current
CHG. (%)
CHG. (%)
series has shifted from 8500 to 8700 call options and of
IBULHSGFIN
5830400
-7.97
716.10
3.61
put is placed at 8200 strike.
TATASTEEL
23384000
-7.15
320.55
2.81
FIIs have been continuously forming longs in Index
HINDZINC
4736000
-5.91
191.00
1.79
Futures, while highest OI has also shifted to 8700 call
IGL
2284700
-5.25
610.65
1.47
options. This suggests continuation of upward move in
TORNTPHARM
244400
-4.98
1450.60
1.54
Nifty; thus traders are suggested to trade with positively.
Historical Volatility
Put-Call Ratio
SCRIP
HV
SCRIP
PCR-OI
PCR-VOL
BAJFINANCE
35.23
NIFTY
1.08
1.10
SRTRANSFIN
44.73
BANKNIFTY
1.29
0.97
PNB
61.24
SBIN
0.71
0.50
HDFCBANK
20.99
RELIANCE
0.48
0.42
GRANULES
32.26
INFY
0.90
0.72
Strategy Date
Symbol
Strategy
Status
04-07-2016
RCOM
Ratio Bull Call Spread
Active
11-07-2016
BANKNIFTY
Bull Call Spread
Didn’t trigger
2
Technical & Derivatives Report
July 12, 2016
FII Statistics for 11-July 2016
Turnover on 11-July 2016
Open Interest
No. of
Turnover
Change
Detail
Buy
Sell
Net
Instrument
Value
Contracts
( in Cr. )
(%)
Contracts
Change (%)
(in Cr.)
INDEX
INDEX
2497.82
1371.49
1126.34
258444
16754.85
8.71
225277
14986.20
14.97
FUTURES
FUTURES
INDEX
INDEX
22822.51
21229.63
1592.88
860648
55064.53
3.95
2910603
191745.39
36.92
OPTIONS
OPTIONS
STOCK
4234.56
4783.31
(548.75)
802796
51000.81
1.16
STOCK
FUTURES
500469
33079.85
12.60
FUTURES
STOCK
STOCK
2798.21
2860.62
(62.40)
63798
4125.43
10.04
OPTIONS
295981
19916.08
26.00
OPTIONS
TOTAL
32353.10
30245.04
2108.06
1985686
126945.62
3.57
TOTAL
3932330
259727.52
31.00
Nifty Spot = 8467.90
Lot Size = 75
Bull-Call Spreads
Bear-Put Spreads
Action
Strike
Price
Risk
Reward
BEP
Action
Strike
Price
Risk
Reward
BEP
Buy
8500
88.25
Buy
8500
100.40
42.45
57.55
8542.45
37.60
62.40
8462.40
Sell
8600
45.80
Sell
8400
62.80
Buy
8500
88.25
Buy
8500
100.40
67.55
132.45
8567.55
62.80
137.20
8437.20
Sell
8700
20.70
Sell
8300
37.60
Buy
8600
45.80
Buy
8400
62.80
25.10
74.90
8625.10
25.20
74.80
8374.80
Sell
8700
20.70
Sell
8300
37.60
Note: Above mentioned Bullish or Bearish Spreads in Nifty (July Series) are given as an information and not as a recommendation.
Nifty Put-Call Analysis
3
Technical & Derivatives Report
July 12, 2016
Daily Pivot Levels for Nifty Constituents
Scrips
S2
S1
PIVOT
R1
R2
ACC
1,598
1,607
1,616
1,625
1,633
ADANIPORTS
204
211
215
221
225
AMBUJACEM
258
260
261
262
263
ASIANPAINT
1,011
1,019
1,026
1,034
1,041
AUROPHARMA
774
781
786
793
798
AXISBANK
535
540
546
551
558
BAJAJ-AUTO
2,612
2,631
2,644
2,663
2,676
BANKBARODA
156
159
161
164
166
BHEL
137
138
140
141
143
BPCL
1,105
1,119
1,134
1,149
1,164
BHARTIARTL
353
357
361
364
369
INFRATEL
345
348
351
354
356
BOSCH
22,608
22,995
23,238
23,626
23,868
CIPLA
515
519
523
527
532
COALINDIA
311
316
319
324
327
DRREDDY
3,548
3,587
3,613
3,652
3,678
EICHERMOT
19,392
19,469
19,557
19,634
19,722
GAIL
374
376
380
383
387
GRASIM
4,516
4,540
4,574
4,598
4,632
HCLTECH
708
712
719
724
731
HDFCBANK
1,173
1,187
1,194
1,207
1,215
HDFC
1,287
1,301
1,311
1,325
1,335
HEROMOTOCO
3,168
3,206
3,228
3,266
3,288
HINDALCO
127
128
129
130
131
HINDUNILVR
915
922
929
936
942
ICICIBANK
245
247
249
252
253
IDEA
102
103
103
104
104
INDUSINDBK
1,097
1,111
1,129
1,142
1,160
INFY
1,153
1,164
1,171
1,183
1,190
ITC
244
247
249
252
254
KOTAKBANK
741
751
757
767
773
LT
1,545
1,553
1,562
1,569
1,579
LUPIN
1,640
1,655
1,664
1,679
1,688
M&M
1,452
1,462
1,471
1,481
1,489
MARUTI
4,153
4,213
4,249
4,309
4,345
NTPC
154
156
157
159
161
ONGC
221
223
225
227
229
POWERGRID
163
165
168
170
173
RELIANCE
982
987
991
996
1,000
SBIN
221
223
224
226
228
SUNPHARMA
776
782
788
795
801
TCS
2,410
2,437
2,454
2,482
2,499
TATAMTRDVR
295
301
305
311
315
TATAMOTORS
466
476
481
490
496
TATAPOWER
73
74
74
74
75
TATASTEEL
315
321
325
331
336
TECHM
500
504
508
512
516
ULTRACEMCO
3,396
3,425
3,449
3,478
3,501
WIPRO
559
564
568
572
576
YESBANK
1,123
1,133
1,141
1,151
1,159
ZEEL
445
450
454
459
463
4
Technical & Derivatives Report
July 12, 2016
Research Team Tel: 022 - 39357800
For Technical Queries
For Derivatives Queries
DISCLAIMER
Angel Broking Private Limited (hereinafter referred to as “Angel”) is a registered Member of National Stock Exchange of India Limited,
Bombay Stock Exchange Limited and MCX Stock Exchange Limited. It is also registered as a Depository Participant with CDSL and
Portfolio Manager with SEBI. It also has registration with AMFI as a Mutual Fund Distributor. Angel Broking Private Limited is a
registered entity with SEBI for Research Analyst in terms of SEBI (Research Analyst) Regulations, 2014 vide registration number
INH000000164. Angel or its associates has not been debarred/ suspended by SEBI or any other regulatory authority for accessing
/dealing in securities Market. Angel or its associates including its relatives/analyst do not hold any financial interest/beneficial
ownership of more than 1% in the company covered by Analyst. Angel or its associates/analyst has not received any compensation /
managed or co-managed public offering of securities of the company covered by Analyst during the past twelve months. Angel/analyst
has not served as an officer, director or employee of company covered by Analyst and has not been engaged in market making activity
of the company covered by Analyst.
This document is solely for the personal information of the recipient, and must not be singularly used as the basis of any investment
decision. Nothing in this document should be construed as investment or financial advice. Each recipient of this document should
make such investigations as they deem necessary to arrive at an independent evaluation of an investment in the securities of the
companies referred to in this document (including the merits and risks involved), and should consult their own advisors to determine
the merits and risks of such an investment.
Reports based on technical and derivative analysis center on studying charts of a stock's price movement, outstanding positions and
trading volume, as opposed to focusing on a company's fundamentals and, as such, may not match with a report on a company's
fundamentals.
The information in this document has been printed on the basis of publicly available information, internal data and other reliable
sources believed to be true, but we do not represent that it is accurate or complete and it should not be relied on as such, as this
document is for general guidance only. Angel Broking Pvt. Limited or any of its affiliates/ group companies shall not be in any way
responsible for any loss or damage that may arise to any person from any inadvertent error in the information contained in this report.
Angel Broking Pvt. Limited has not independently verified all the information contained within this document. Accordingly, we cannot
testify, nor make any representation or warranty, express or implied, to the accuracy, contents or data contained within this document.
While Angel Broking Pvt. Limited endeavors to update on a reasonable basis the information discussed in this material, there may be
regulatory, compliance, or other reasons that prevent us from doing so.
This document is being supplied to you solely for your information, and its contents, information or data may not be reproduced,
redistributed or passed on, directly or indirectly.
Neither Angel Broking Pvt. Limited, nor its directors, employees or affiliates shall be liable for any loss or damage that may arise from
or in connection with the use of this information.
Note: Please refer to the important ‘Stock Holding Disclosure' report on the Angel website (Research Section). Also, please refer to the
latest update on respective stocks for the disclosure status in respect of those stocks. Angel Broking Pvt. Limited and its affiliates may
have investment positions in the stocks recommended in this report.
5