Technical & Derivatives Report
May 12, 2016
Sensex (25597) / Nifty (7849)
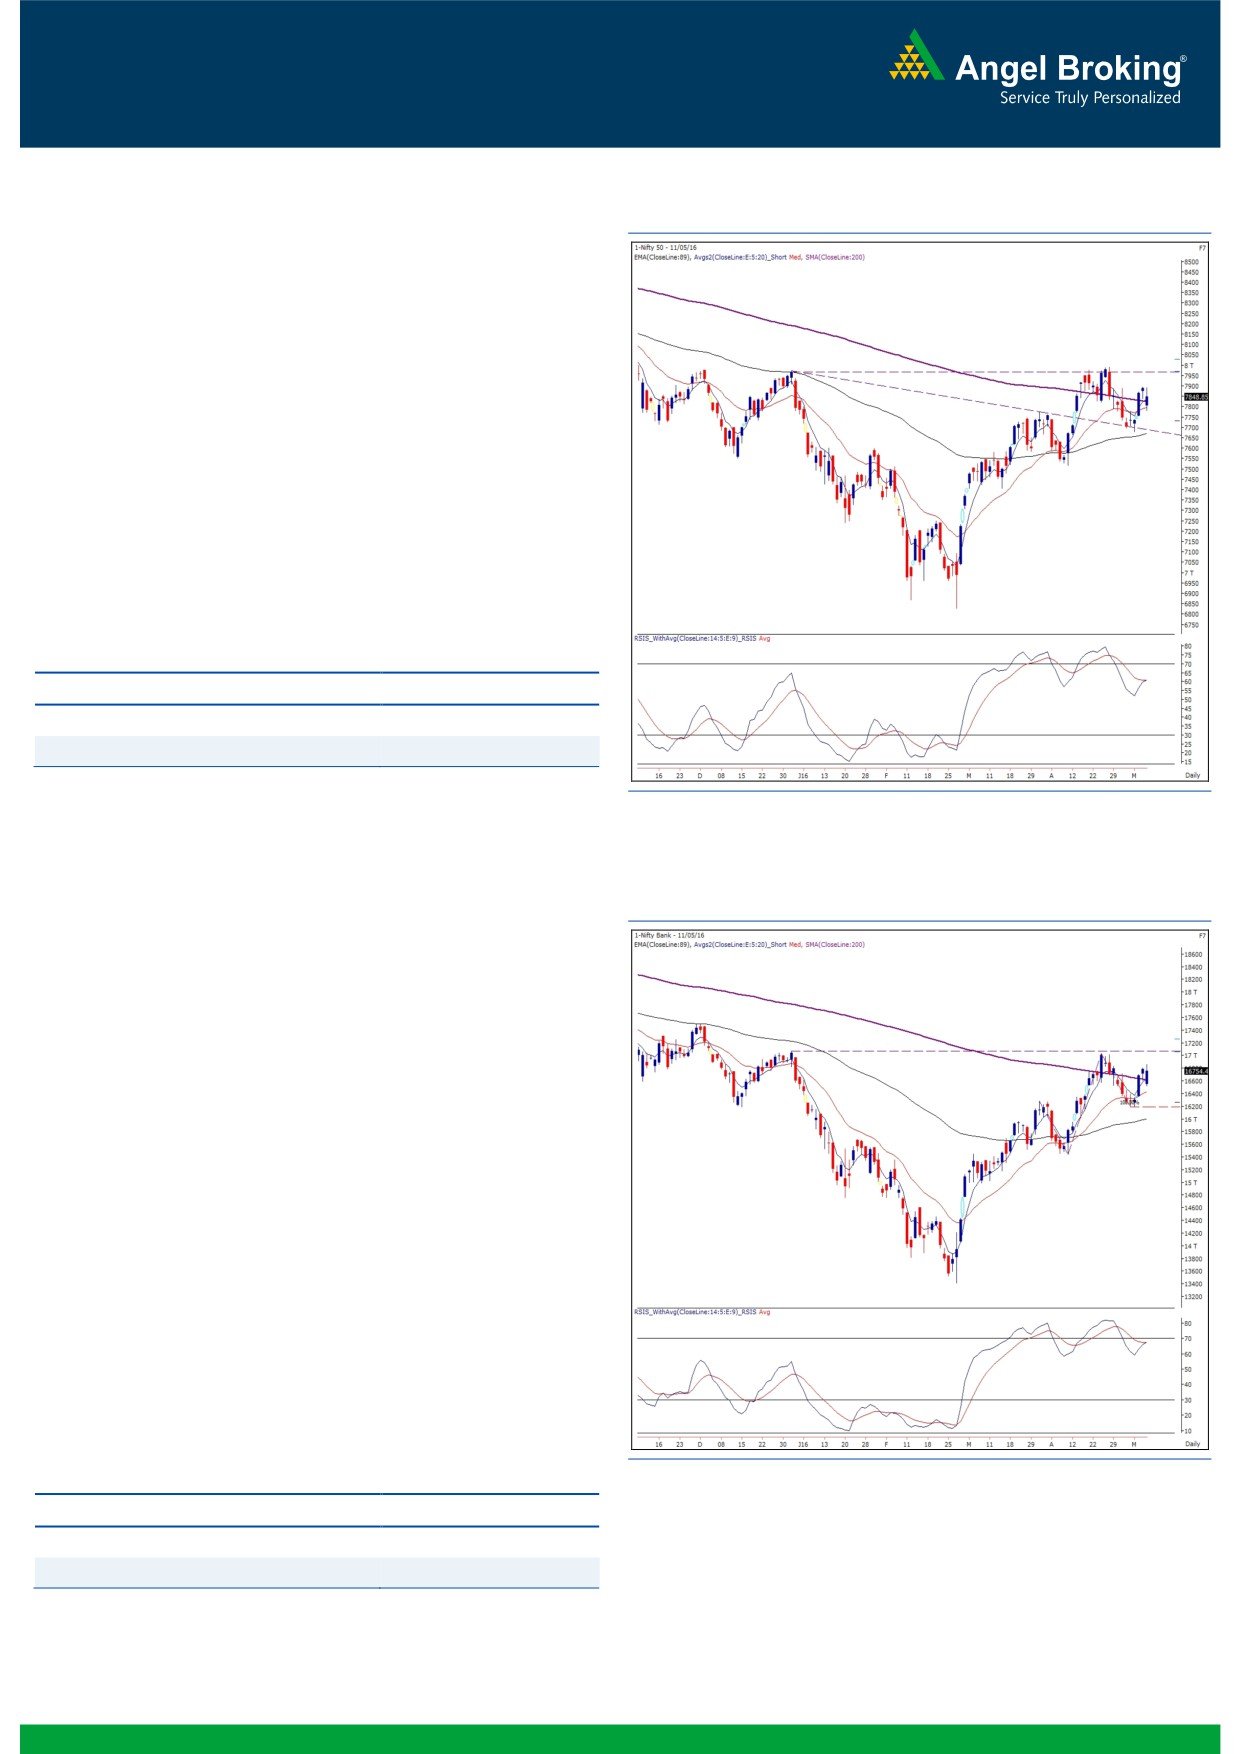
Exhibit 1: Nifty Daily Chart
Yesterday morning, most of the traders stood shell-shocked after
seeing the SGX Nifty down over 100 points on the back of
Mauritius Treaty announcement. However, we saw a complete
roller coaster ride in the market as the Nifty recovered
immediately from day’s low and then kept on oscillating within a
broad range with a negative bias.
Considering yesterday’s session, the range is set for the upcoming
sessions. 7900 has become an immediate hurdle on the upside;
whereas, the 7810 would be seen as a crucial support. Any
sustainable move on either side beyond these levels would dictate
the direction for the market. Thus, traders need to keep a close
tab on these levels and should ideally avoid aggressive trades in
the market.
Key Levels
Support 1 - 7810
Resistance 1 - 7900
Support 2 - 7780
Resistance 2 - 7940
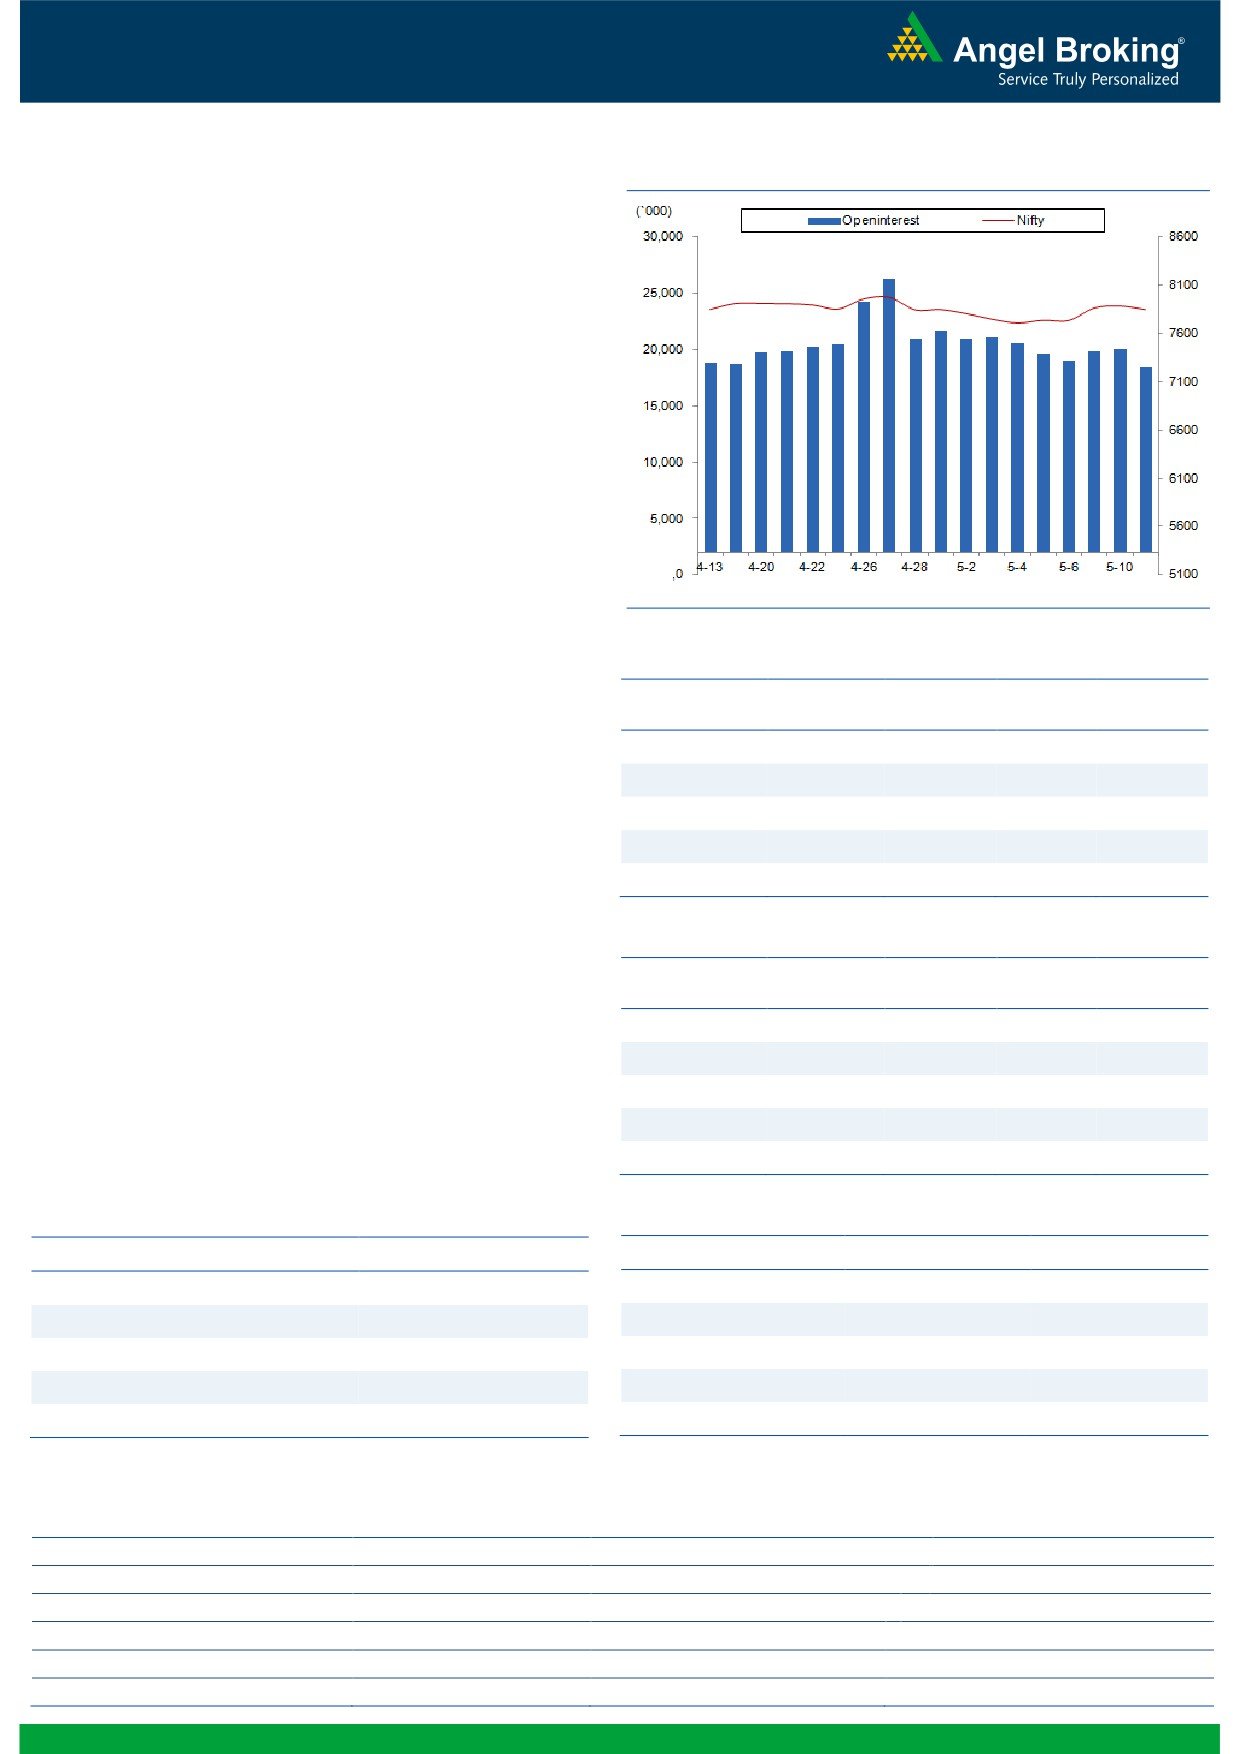
Exhibit 2: Nifty Bank Daily Chart
Nifty Bank Outlook - (16754)
In yesterday's trading session, the Nifty Bank index traded with
high volatility before ending the session with marginal loss of
0.18%.
Post gap down opening of about 240 points, the index rallied
higher and recovered all the losses during the day. The upmove
was led by the private sector banks, on which we have been
maintaining positive stance on basis of their short term uptrend.
Although the positive momentum continues with formation of
large body bullish candles, the index has crucial resistance
around 17020-17070 range. Yesterday's high coincides with
78.6% retracement resistance of the recent corrective move from
17030 to 16193 and hence a move above yesterday's high will
lead the index higher upto the mentioned resistance zone. At
higher levels, traders are advised to book profits on long positions
and wait for further developments on the charts. The intraday
support for the index is placed around 16655 and 16518 wheres
resistances are seen around 16862 and 17020.
Key Levels
Support 1 - 16655
Resistance 1 - 16862
Support 2 - 16518
Resistance 2 - 17020
1
Technical & Derivatives Report
May 12, 2016
Comments
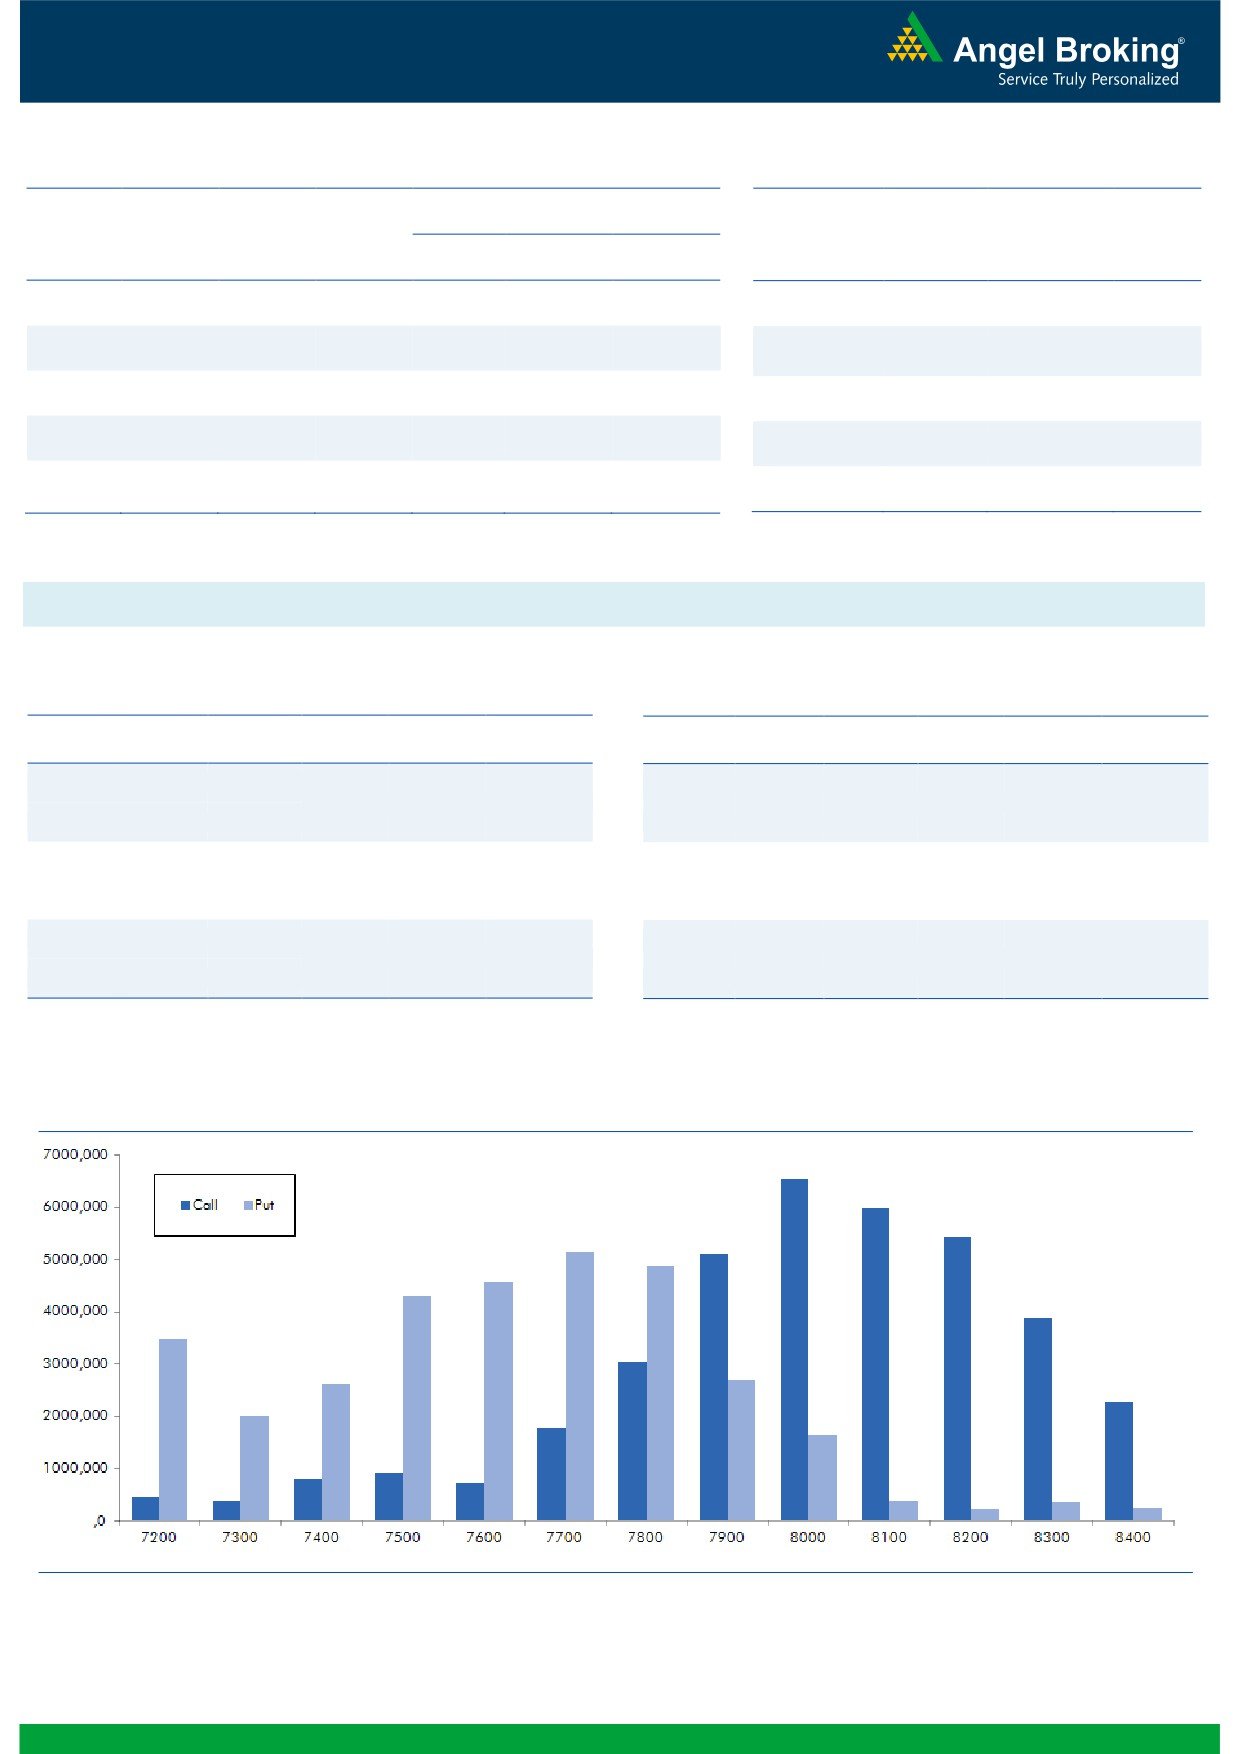
Nifty Vs OI
The Nifty futures open interest has decreased by 8.47%
BankNifty futures open interest has decreased by 1.02%
as market closed at 7848.85 levels.
The Nifty May future closed at a premium of 17.00
points against a premium of 31.95 points. The June
series closed at a premium of 29.60 points.
The Implied Volatility of at the money options has
increased from 14.58% to 15.25%.
The total OI of the market is Rs. 2,20,375/- cr. and the
stock futures OI is Rs. 60,260/- cr.
Few of the liquid counters where we have seen high cost
of carry are UNITECH, JPASSOCIAT, ADANIPOWER,
TATAPOWER and L&TFH.
Views
OI Gainers
Yesterday, the FIIs were net seller in both equity and
OI
PRICE
Index Futures segment. They sold equities worth Rs. 362
SCRIP
OI
PRICE
CHG. (%)
CHG. (%)
crores. While, they sold Index Future to the tune of 962
ZEEL
9938500
17.92
449.50
7.07
crores with fall in OI, indicating long unwinding in
HAVELLS
4020000
16.18
342.05
-1.58
yesterday’s session.
VOLTAS
5202800
12.06
320.40
3.64
In Index Options front, FIIs bought worth Rs. 1145 crores
UNITECH
206184000
8.44
4.15
-7.78
with rise in OI. In call options, 7900 strike has addedng.com
BAJFINANCE
274000
8.03
7486.25
0.86
some amount of fresh positions; while, unwinding was
seen in 7800 call option. Whereas in put options, we
OI Losers
witnessed rise in OI in 7400 strike. Maximum OI in
OI
PRICE
current series is visible at 8000 call and 7700 put
SCRIP
OI
PRICE
CHG. (%)
CHG. (%)
options. In BankNifty; 16500 put options was quite active
KPIT
1624000
-14.88
164.80
0.03
and added fresh positions. Overall derivative data
ENGINERSIN
2453000
-8.98
184.45
1.26
suggests that the Nifty has strong support around 7670 -
M&M
3143600
-6.89
1350.75
-0.31
7700 zone and till the time it holds this support zone,
traders should trade with positive bias.
TCS
3689500
-6.76
2523.70
-0.41
ACC
838575
-6.48
1469.65
0.14
Historical Volatility
Put-Call Ratio
SCRIP
HV
SCRIP
PCR-OI
PCR-VOL
ZEEL
48.68
NIFTY
0.92
0.97
ABIRLANUVO
37.62
BANKNIFTY
1.01
0.79
UNITECH
66.80
ICICIBANK
0.40
0.47
DISHTV
46.64
RELIANCE
0.37
0.29
PNB
45.66
SBIN
0.52
0.51
Strategy Date
Symbol
Strategy
Status
02-05-2016
NIFTY
Long Strangle
Active
09-05-2016
RELIANCE
Long Put
Active
2
Technical & Derivatives Report
May 12, 2016
FII Statistics for 11-May 2016
Turnover on 11-May 2016
Open Interest
No. of
Turnover
Change
Detail
Buy
Sell
Net
Instrument
Value
Contracts
( in Cr. )
(%)
Contracts
Change (%)
(in Cr.)
INDEX
INDEX
1185.68
2147.75
(962.07)
232994
13390.26
(3.54)
313630
22128.24
66.29
FUTURES
FUTURES
INDEX
INDEX
40189.83
39044.39
1145.44
1127559
65722.83
3.04
2885567
223556.92
63.92
OPTIONS
OPTIONS
STOCK
4963.08
3891.05
1072.04
1010257
48617.68
(0.31)
STOCK
FUTURES
515157
29583.02
22.98
FUTURES
STOCK
STOCK
2836.70
2879.93
(43.23)
71922
3507.64
7.85
OPTIONS
286718
16725.03
26.05
OPTIONS
TOTAL
49175.29
47963.12
1212.17
2442732
131238.41
1.11
TOTAL
4001072
291993.21
56.13
Nifty Spot = 7848.85
Lot Size = 75
Bull-Call Spreads
Bear-Put Spreads
Action
Strike
Price
Risk
Reward
BEP
Action
Strike
Price
Risk
Reward
BEP
Buy
7900
81.15
Buy
7800
73.00
37.40
62.60
7937.40
28.90
71.10
7771.10
Sell
8000
43.75
Sell
7700
44.10
Buy
7900
81.15
Buy
7800
73.00
59.80
140.20
7959.80
46.70
153.30
7753.30
Sell
8100
21.35
Sell
7600
26.30
Buy
8000
43.75
Buy
7700
44.10
22.40
77.60
8022.40
17.80
82.20
7682.20
Sell
8100
21.35
Sell
7600
26.30
Note: Above mentioned Bullish or Bearish Spreads in Nifty (May Series) are given as an information and not as a recommendation.
Nifty Put-Call Analysis
3
Technical & Derivatives Report
May 12, 2016
Daily Pivot Levels for Nifty Constituents
Scrips
S2
S1
PIVOT
R1
R2
ACC
1,429
1,448
1,460
1,479
1,491
ADANIPORTS
186
190
193
196
199
AMBUJACEM
215
218
220
223
225
ASIANPAINT
873
891
905
922
936
AUROPHARMA
792
805
813
826
834
AXISBANK
474
486
493
505
512
BAJAJ-AUTO
2,464
2,491
2,523
2,549
2,581
BANKBARODA
151
154
156
159
161
BHEL
123
125
126
128
129
BPCL
899
910
919
929
938
BHARTIARTL
344
351
364
372
385
INFRATEL
364
368
372
375
379
BOSCH
18,983
19,515
19,807
20,339
20,631
CIPLA
527
532
536
540
544
COALINDIA
274
279
282
287
289
DRREDDY
2,821
2,845
2,879
2,903
2,938
EICHERMOT
19,764
19,870
20,015
20,122
20,267
GAIL
380
384
387
390
394
GRASIM
4,140
4,202
4,251
4,313
4,362
HCLTECH
700
705
711
715
721
HDFCBANK
1,123
1,131
1,138
1,146
1,153
HDFC
1,187
1,196
1,209
1,217
1,230
HEROMOTOCO
2,894
2,928
2,954
2,988
3,014
HINDALCO
87
89
91
93
95
HINDUNILVR
844
854
860
869
876
ICICIBANK
215
220
223
227
231
IDEA
105
108
113
116
120
INDUSINDBK
1,026
1,040
1,050
1,064
1,074
INFY
1,181
1,191
1,203
1,214
1,225
ITC
313
315
319
321
324
KOTAKBANK
705
718
728
741
751
LT
1,280
1,304
1,319
1,343
1,358
LUPIN
1,578
1,586
1,599
1,606
1,619
M&M
1,298
1,323
1,337
1,362
1,376
MARUTI
3,751
3,821
3,859
3,929
3,967
NTPC
137
139
142
144
146
ONGC
201
203
205
207
209
POWERGRID
138
140
141
143
144
RELIANCE
965
970
975
981
986
SBIN
181
183
186
188
190
SUNPHARMA
784
790
798
804
812
TCS
2,476
2,497
2,511
2,533
2,547
TATAMTRDVR
265
270
276
280
286
TATAMOTORS
367
373
383
389
398
TATAPOWER
70
70
71
72
73
TATASTEEL
314
322
327
335
340
TECHM
464
469
476
481
488
ULTRACEMCO
3,072
3,136
3,180
3,243
3,287
WIPRO
530
534
537
540
543
YESBANK
915
935
949
970
983
ZEEL
407
427
440
460
473
4
Technical & Derivatives Report
May 12, 2016
Research Team Tel: 022 - 39357800
For Technical Queries
For Derivatives Queries
DISCLAIMER
Angel Broking Private Limited (hereinafter referred to as “Angel”) is a registered Member of National Stock Exchange of India Limited,
Bombay Stock Exchange Limited and MCX Stock Exchange Limited. It is also registered as a Depository Participant with CDSL and
Portfolio Manager with SEBI. It also has registration with AMFI as a Mutual Fund Distributor. Angel Broking Private Limited is a
registered entity with SEBI for Research Analyst in terms of SEBI (Research Analyst) Regulations, 2014 vide registration number
INH000000164. Angel or its associates has not been debarred/ suspended by SEBI or any other regulatory authority for accessing
/dealing in securities Market. Angel or its associates including its relatives/analyst do not hold any financial interest/beneficial
ownership of more than 1% in the company covered by Analyst. Angel or its associates/analyst has not received any compensation /
managed or co-managed public offering of securities of the company covered by Analyst during the past twelve months. Angel/analyst
has not served as an officer, director or employee of company covered by Analyst and has not been engaged in market making activity
of the company covered by Analyst.
This document is solely for the personal information of the recipient, and must not be singularly used as the basis of any investment
decision. Nothing in this document should be construed as investment or financial advice. Each recipient of this document should
make such investigations as they deem necessary to arrive at an independent evaluation of an investment in the securities of the
companies referred to in this document (including the merits and risks involved), and should consult their own advisors to determine
the merits and risks of such an investment.
Reports based on technical and derivative analysis center on studying charts of a stock's price movement, outstanding positions and
trading volume, as opposed to focusing on a company's fundamentals and, as such, may not match with a report on a company's
fundamentals.
The information in this document has been printed on the basis of publicly available information, internal data and other reliable
sources believed to be true, but we do not represent that it is accurate or complete and it should not be relied on as such, as this
document is for general guidance only. Angel Broking Pvt. Limited or any of its affiliates/ group companies shall not be in any way
responsible for any loss or damage that may arise to any person from any inadvertent error in the information contained in this report.
Angel Broking Pvt. Limited has not independently verified all the information contained within this document. Accordingly, we cannot
testify, nor make any representation or warranty, express or implied, to the accuracy, contents or data contained within this document.
While Angel Broking Pvt. Limited endeavors to update on a reasonable basis the information discussed in this material, there may be
regulatory, compliance, or other reasons that prevent us from doing so.
This document is being supplied to you solely for your information, and its contents, information or data may not be reproduced,
redistributed or passed on, directly or indirectly.
Neither Angel Broking Pvt. Limited, nor its directors, employees or affiliates shall be liable for any loss or damage that may arise from
or in connection with the use of this information.
Note: Please refer to the important ‘Stock Holding Disclosure' report on the Angel website (Research Section). Also, please refer to the
latest update on respective stocks for the disclosure status in respect of those stocks. Angel Broking Pvt. Limited and its affiliates may
have investment positions in the stocks recommended in this report.
5