Technical & Derivatives Report
February 12, 2016
Sensex (22952) / Nifty (6976)
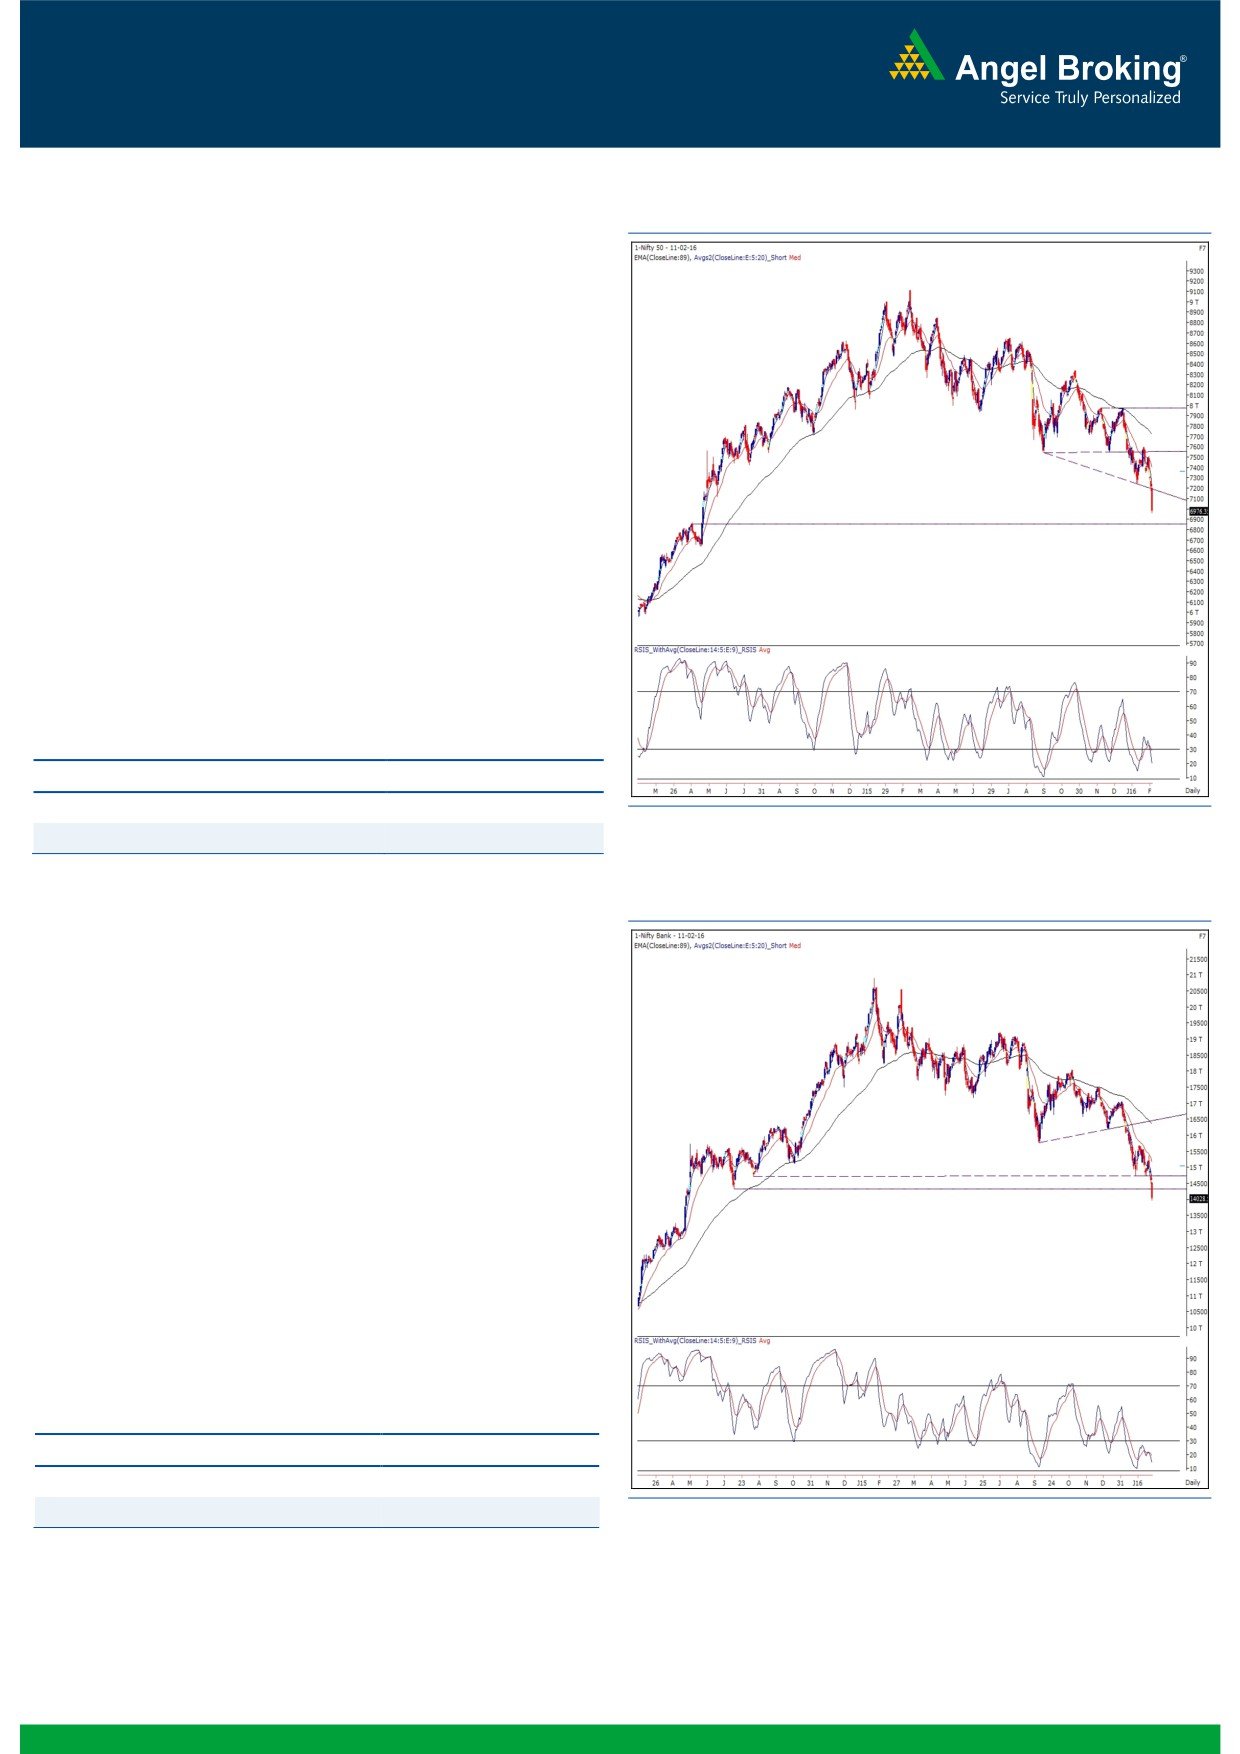
Exhibit 1: Nifty Daily Chart
A series of weak opening continued in our market owing to
mounting global concerns. The selling pressure intensified as the
day progressed and in the process, the Nifty tumbled ferociously
throughout the day to post a worst closing since May 2014.
Yesterday's sharp correction of more than three percent led to a
decisive close below the psychological level of
7000. This
negative development caught us completely on the wrong foot as
we were not expecting this correction to exceed below the 7120
mark in a worst case scenario. Although, we are seeing strong
support zones on the monthly chart; it won't be fair to keep
talking about support levels which are getting thrashed brutally
one after another. Traders are now advised not to trade
aggressively in such kind of market. At this juncture, it doesn't
make a sense to short after such a massive fall. The immediate
support levels are seen at 6850 - 6780 levels. On the flipside,
7120 - 7177 would act as an immediate hurdle for the index.
Key Levels
Support 1 - 6850
Resistance 1 - 7120
Support 2 - 6780
Resistance 2 -
7177
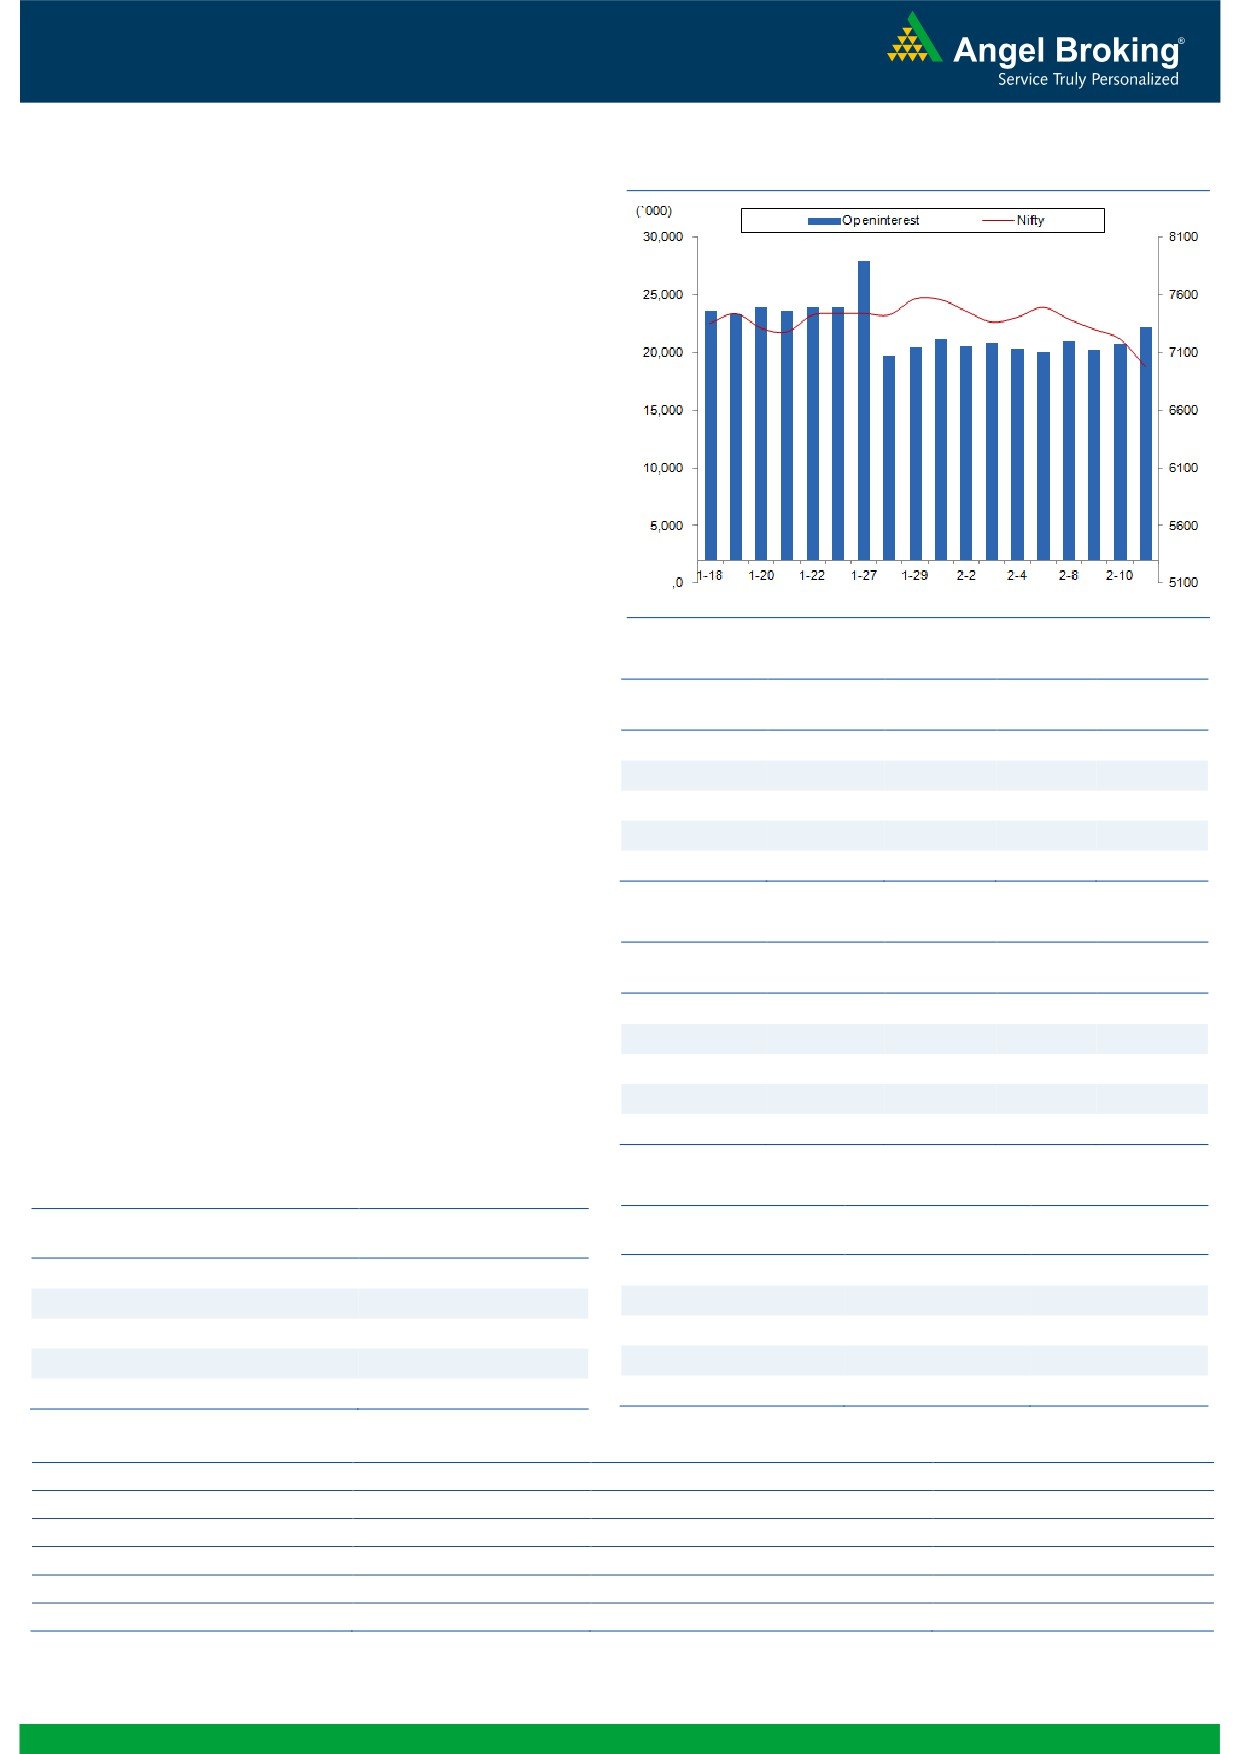
Exhibit 2: Bank Nifty Daily Chart
Bank Nifty Outlook - (14029)
Yesterday, the Nifty Bank index opened marginal losses and
started correcting from first tick. After good fall in the initial
trades, the banking index traded in a sideways direction in the
first half of the session. But, post the SBI results, all banking
counters had a nosedive in the later half and as a result the
Nifty Bank index breached its psychological support of 14000
mark with an ease. Eventually, the Nifty Bank index ended the
session tad above 14000 levels, with deep cut of 3.84 percent
over its previous close. Although, the RSI indicator is showing
positive divergence in daily chart, we would like to wait for
some positive development in prices as well to form any
concrete view. The ongoing mammoth volatility may continue
for few more sessions and thus we advise traders to remain
light in this market. Going forward, immediate support for the
Nifty Bank index is placed at 13800 and 13590 levels; while,
resistance is seen at 14250 and 14430 levels.
Key Levels
Support 1 - 14370
Resistance 1 - 14770
Support 2 - 14230
Resistance 2 - 14950
1
Technical & Derivatives Report
February 12, 2016
Comments
Nifty Vs OI
The Nifty futures open interest has increased by 6.96%
BankNifty futures open interest has increased by 3.11%
as market closed at 6976.35 levels.
The Nifty February future closed at a premium of 17.10
points against a premium of 30.85 points. The March
series closed at a premium of 35.20 points.
The Implied Volatility of at the money options has
increased from 21.15% to 25.00%.
The total OI of the market is Rs. 2,31,308/- cr. and the
stock futures OI is Rs. 56,299/- cr.
Few of the liquid counters where we have seen high cost
of carry are IDFC, JSWENERGY, L&TFH, HDFC and
KTKBANK.
Views
FIIs were net sellers in cash market segment to the tune
OI Gainers
of Rs. 1112 crores. While in Index Futures, they bought
OI
PRICE
SCRIP
OI
PRICE
of Rs. 415 crores with good amount of rise in open
CHG. (%)
CHG. (%)
interest indicating fresh long formation in last trading
VOLTAS
4361600
30.81
233.15
-13.71
session.
PTC
8664000
8.95
58.00
-7.13
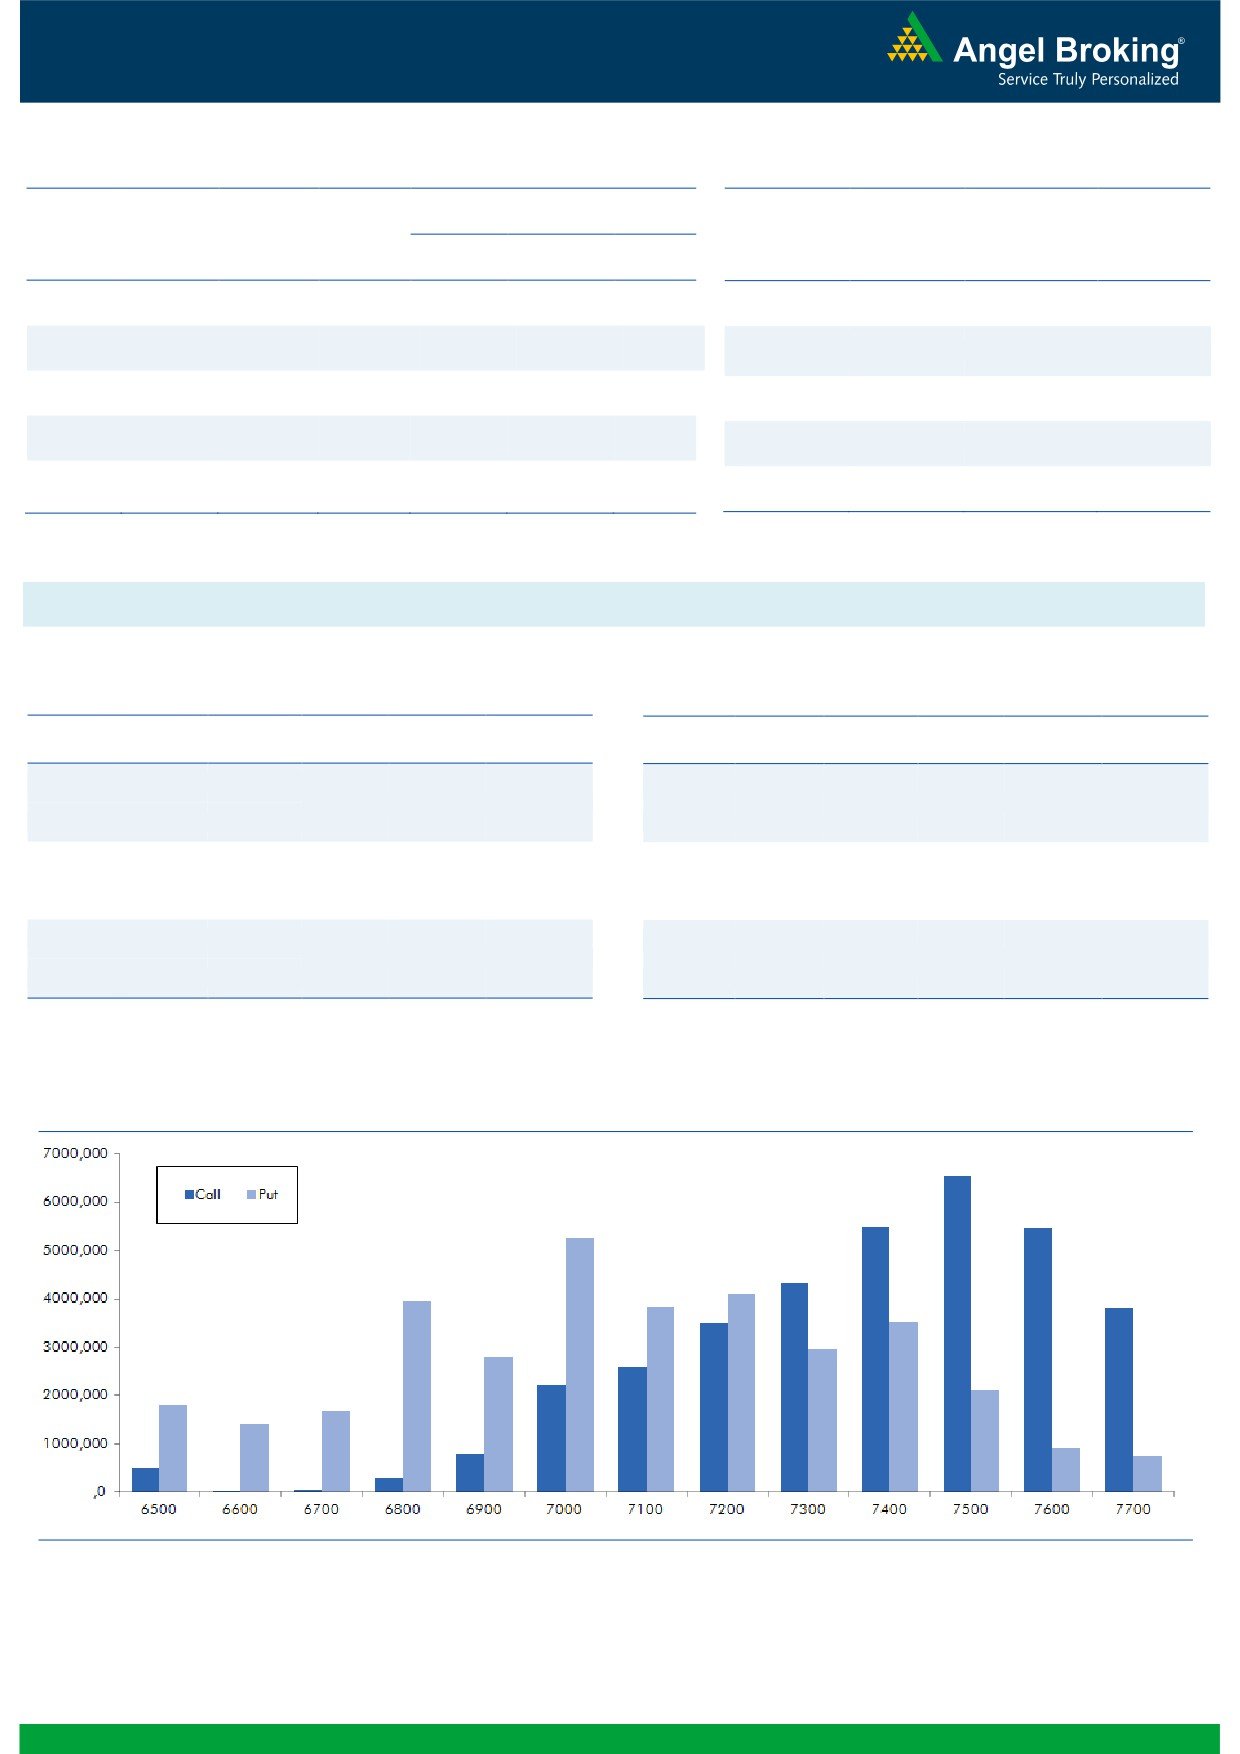
In Index Options front, they bought of Rs. 574 crores with
BANKINDIA
23733000
7.14
82.45
-7.41
good amount of rise in OI. In call options, 6900-7200
ORIENTBANK
11577000
6.87
85.20
-11.30
strikes added good amount of build-up, which is blend
UNIONBANK
15852000
5.81
117.90
-2.68
of both long and short formation. While in put options,
6700, 6800 and 7000 strikes added decent OI, these
OI Losers
may be longs expecting further fall. We also witness
OI
PRICE
SCRIP
OI
PRICE
good amount of unwinding in 7200 and 7300 strike
CHG. (%)
CHG. (%)
which is covering of shorts formed earlier assuming
ACC
4447875
-18.88
1231.50
-2.75
market may take support near these levels. Despite
TORNTPHARM
470000
-12.05
1266.75
-2.83
yesterday’s correction, FII bought in Index Futures, which
BATAINDIA
2645000
-11.54
480.40
-1.07
is a positive sign. But, we would suggest avoiding longs
AMBUJACEM
7312200
-11.15
192.50
-1.03
as of now till we see any strong data for reversal.
JETAIRWAYS
4469400
-10.83
524.80
-11.10
Historical Volatility
Put-Call Ratio
SCRIP
HV
SCRIP
PCR-OI
PCR-VOL
VOLTAS
79.74
NIFTY
0.79
0.75
TATAGLOBAL
69.18
BANKNIFTY
0.62
0.62
JUBLFOOD
66.26
SBIN
0.51
0.59
UNITECH
104.90
MARUTI
0.39
0.41
GMRINFRA
84.59
ICICIBANK
0.47
0.64
Strategy Date
Symbol
Strategy
Status
February 01, 2016
BHEL
Bull Call Spread
Active
February 08, 2016
NIFTY
Short Strangle
Active
2
Technical & Derivatives Report
February 12, 2016
FII Statistics for 11-February 2016
Turnover on 11-February 2016
Open Interest
No. of
Turnover
Change
Detail
Buy
Sell
Net
Instrument
Value
Change
Contracts
( in Cr. )
(%)
Contracts
(in Cr.)
(%)
INDEX
INDEX
3380.77
2965.36
415.41
239334
11890.03
5.42
484097
24086.70
17.30
FUTURES
FUTURES
INDEX
INDEX
50304.37
49730.36
574.01
1364437
70279.48
6.94
5402342
288410.35
31.58
OPTIONS
OPTIONS
STOCK
5064.92
5330.39
(265.47)
1159688
47631.52
1.56
STOCK
FUTURES
748885
30856.96
9.84
FUTURES
STOCK
STOCK
4252.06
4327.59
(75.53)
68842
2798.49
7.54
OPTIONS
521398
22359.18
30.63
OPTIONS
TOTAL
63002.12
62353.69
648.42
2832301
132599.52
4.56
TOTAL
7156722
365713.19
28.35
Nifty Spot = 6976.35
Lot Size = 75
Bull-Call Spreads
Bear-Put Spreads
Action
Strike
Price
Risk
Reward
BEP
Action
Strike
Price
Risk
Reward
BEP
Buy
7000
128.65
Buy
6900
101.55
43.70
56.30
7043.70
31.50
68.50
6868.50
Sell
7100
84.95
Sell
6800
70.05
Buy
7000
128.65
Buy
6900
101.55
75.00
125.00
7075.00
53.85
146.15
6846.15
Sell
7200
53.65
Sell
6700
47.70
Buy
7100
84.95
Buy
6800
70.05
31.30
68.70
7131.30
22.35
77.65
6777.65
Sell
7200
53.65
Sell
6700
47.70
Note: Above mentioned Bullish or Bearish Spreads in Nifty (Feb. Series) are given as an information and not as a recommendation.
Nifty Put-Call Analysis
3
Technical & Derivatives Report
February 12, 2016
Daily Pivot Levels for Nifty 50 Stocks
Scrips
S2
S1
PIVOT
R1
R2
ACC
1,202
1,218
1,241
1,257
1,281
ADANIPORTS
169
178
191
200
214
AMBUJACEM
185
189
192
197
200
ASIANPAINT
838
847
861
870
884
AXISBANK
359
368
382
392
406
BAJAJ-AUTO
2,237
2,284
2,335
2,382
2,433
BANKBARODA
108
112
117
121
126
BHARTIARTL
299
304
310
315
321
BHEL
113
117
123
127
133
BOSCHLTD
15,918
16,084
16,266
16,433
16,615
BPCL
797
807
822
833
848
CAIRN
111
113
115
117
120
CIPLA
504
523
536
554
567
COALINDIA
287
296
305
314
323
DRREDDY
2,779
2,832
2,905
2,958
3,031
GAIL
313
322
337
346
361
GRASIM
3,308
3,350
3,395
3,437
3,482
HCLTECH
787
797
812
823
838
HDFC
1,023
1,045
1,080
1,102
1,137
HDFCBANK
941
958
986
1,003
1,030
HEROMOTOCO
2,432
2,464
2,513
2,546
2,595
HINDALCO
60
62
65
67
70
HINDUNILVR
770
787
807
823
844
ICICIBANK
192
196
201
205
210
IDEA
96
99
101
104
106
INDUSINDBK
780
796
814
830
849
INFY
1,046
1,062
1,088
1,104
1,129
ITC
289
294
302
307
315
KOTAKBANK
598
614
640
656
682
LT
1,053
1,073
1,099
1,119
1,145
LUPIN
1,726
1,759
1,817
1,849
1,907
M&M
1,079
1,103
1,142
1,166
1,205
MARUTI
3,429
3,485
3,575
3,631
3,721
NTPC
117
119
122
124
127
ONGC
192
198
206
211
220
PNB
73
75
78
80
82
POWERGRID
128
133
138
142
148
RELIANCE
885
905
935
955
986
SBIN
143
148
158
164
173
VEDL
58
60
64
66
69
SUNPHARMA
807
819
839
851
871
TATAMOTORS
247
261
281
296
315
TATAPOWER
53
55
57
59
61
TATASTEEL
211
218
228
234
244
TCS
2,102
2,150
2,220
2,267
2,337
TECHM
421
426
435
440
449
ULTRACEMCO
2,607
2,663
2,746
2,801
2,884
WIPRO
502
509
521
529
540
YESBANK
691
703
721
733
751
ZEEL
356
363
371
378
386
4
Technical & Derivatives Report
February 12, 2016
Research Team Tel: 022 - 39357800
For Technical Queries
For Derivatives Queries
DISCLAIMER
Angel Broking Private Limited (hereinafter referred to as “Angel”) is a registered Member of National Stock Exchange of India Limited,
Bombay Stock Exchange Limited and MCX Stock Exchange Limited. It is also registered as a Depository Participant with CDSL and
Portfolio Manager with SEBI. It also has registration with AMFI as a Mutual Fund Distributor. Angel Broking Private Limited is a
registered entity with SEBI for Research Analyst in terms of SEBI (Research Analyst) Regulations, 2014 vide registration number
INH000000164. Angel or its associates has not been debarred/ suspended by SEBI or any other regulatory authority for accessing
/dealing in securities Market. Angel or its associates including its relatives/analyst do not hold any financial interest/beneficial
ownership of more than 1% in the company covered by Analyst. Angel or its associates/analyst has not received any compensation /
managed or co-managed public offering of securities of the company covered by Analyst during the past twelve months. Angel/analyst
has not served as an officer, director or employee of company covered by Analyst and has not been engaged in market making activity
of the company covered by Analyst.
This document is solely for the personal information of the recipient, and must not be singularly used as the basis of any investment
decision. Nothing in this document should be construed as investment or financial advice. Each recipient of this document should
make such investigations as they deem necessary to arrive at an independent evaluation of an investment in the securities of the
companies referred to in this document (including the merits and risks involved), and should consult their own advisors to determine
the merits and risks of such an investment.
Reports based on technical and derivative analysis center on studying charts of a stock's price movement, outstanding positions and
trading volume, as opposed to focusing on a company's fundamentals and, as such, may not match with a report on a company's
fundamentals.
The information in this document has been printed on the basis of publicly available information, internal data and other reliable
sources believed to be true, but we do not represent that it is accurate or complete and it should not be relied on as such, as this
document is for general guidance only. Angel Broking Pvt. Limited or any of its affiliates/ group companies shall not be in any way
responsible for any loss or damage that may arise to any person from any inadvertent error in the information contained in this report.
Angel Broking Pvt. Limited has not independently verified all the information contained within this document. Accordingly, we cannot
testify, nor make any representation or warranty, express or implied, to the accuracy, contents or data contained within this document.
While Angel Broking Pvt. Limited endeavors to update on a reasonable basis the information discussed in this material, there may be
regulatory, compliance, or other reasons that prevent us from doing so.
This document is being supplied to you solely for your information, and its contents, information or data may not be reproduced,
redistributed or passed on, directly or indirectly.
Neither Angel Broking Pvt. Limited, nor its directors, employees or affiliates shall be liable for any loss or damage that may arise from
or in connection with the use of this information.
Note: Please refer to the important ‘Stock Holding Disclosure' report on the Angel website (Research Section). Also, please refer to the
latest update on respective stocks for the disclosure status in respect of those stocks. Angel Broking Pvt. Limited and its affiliates may
have investment positions in the stocks recommended in this report.
5