Technical & Derivatives Report
November 11, 2016
Sensex (27518) / Nifty (8526)
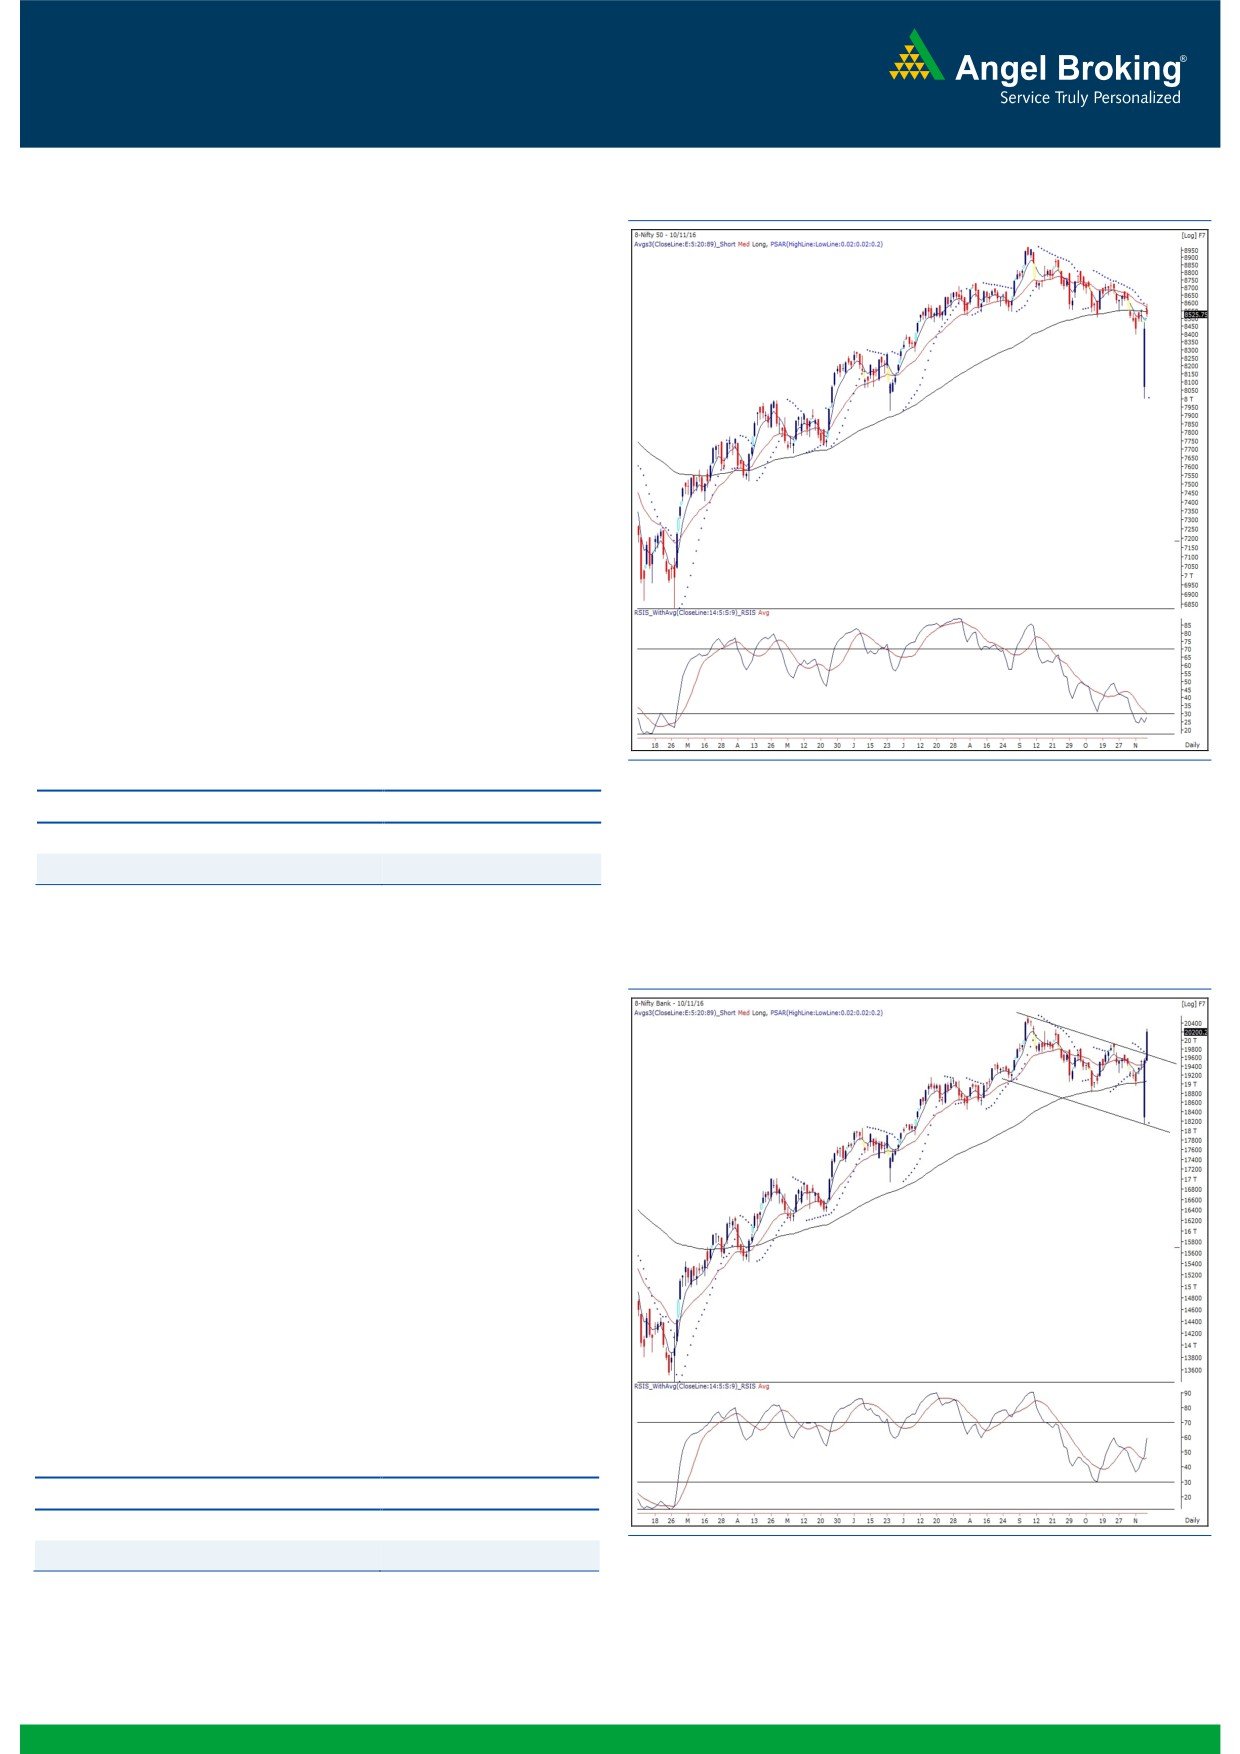
Exhibit 1: Nifty Daily Chart
After an eventful day on Wednesday, we saw our markets
opening with a decent upside gap. In fact, this momentum
accelerated as the day progressed, mainly propelled by banking
conglomerates. However, some of the other heavyweight counters
were not participating in this up move. As a result, we witnessed a
sharp decline towards the fag end to conclude the session well
below the 8550 mark.
Now, with reference to our previous report, 8560 was seen as an
important resistance level. This hurdle was violated on an intraday
basis but due to late selling, the index eventually closed well
below it. Thus, we would maintain our view that as long as 8560
is not broken on a closing basis, traders shouldn't get too carried
by the momentum. Until then a prudent strategy for momentum
traders would be to take some money off the table from their
existing longs. On the downside, 8450 - 8380 would be seen as
immediate support levels. On the other hand, intraday resistances
are placed at 8560 - 8620 levels.
Key Levels
Support 1 - 8450
Resistance 1 - 8560
Support 2 - 8380
Resistance 2 - 8620
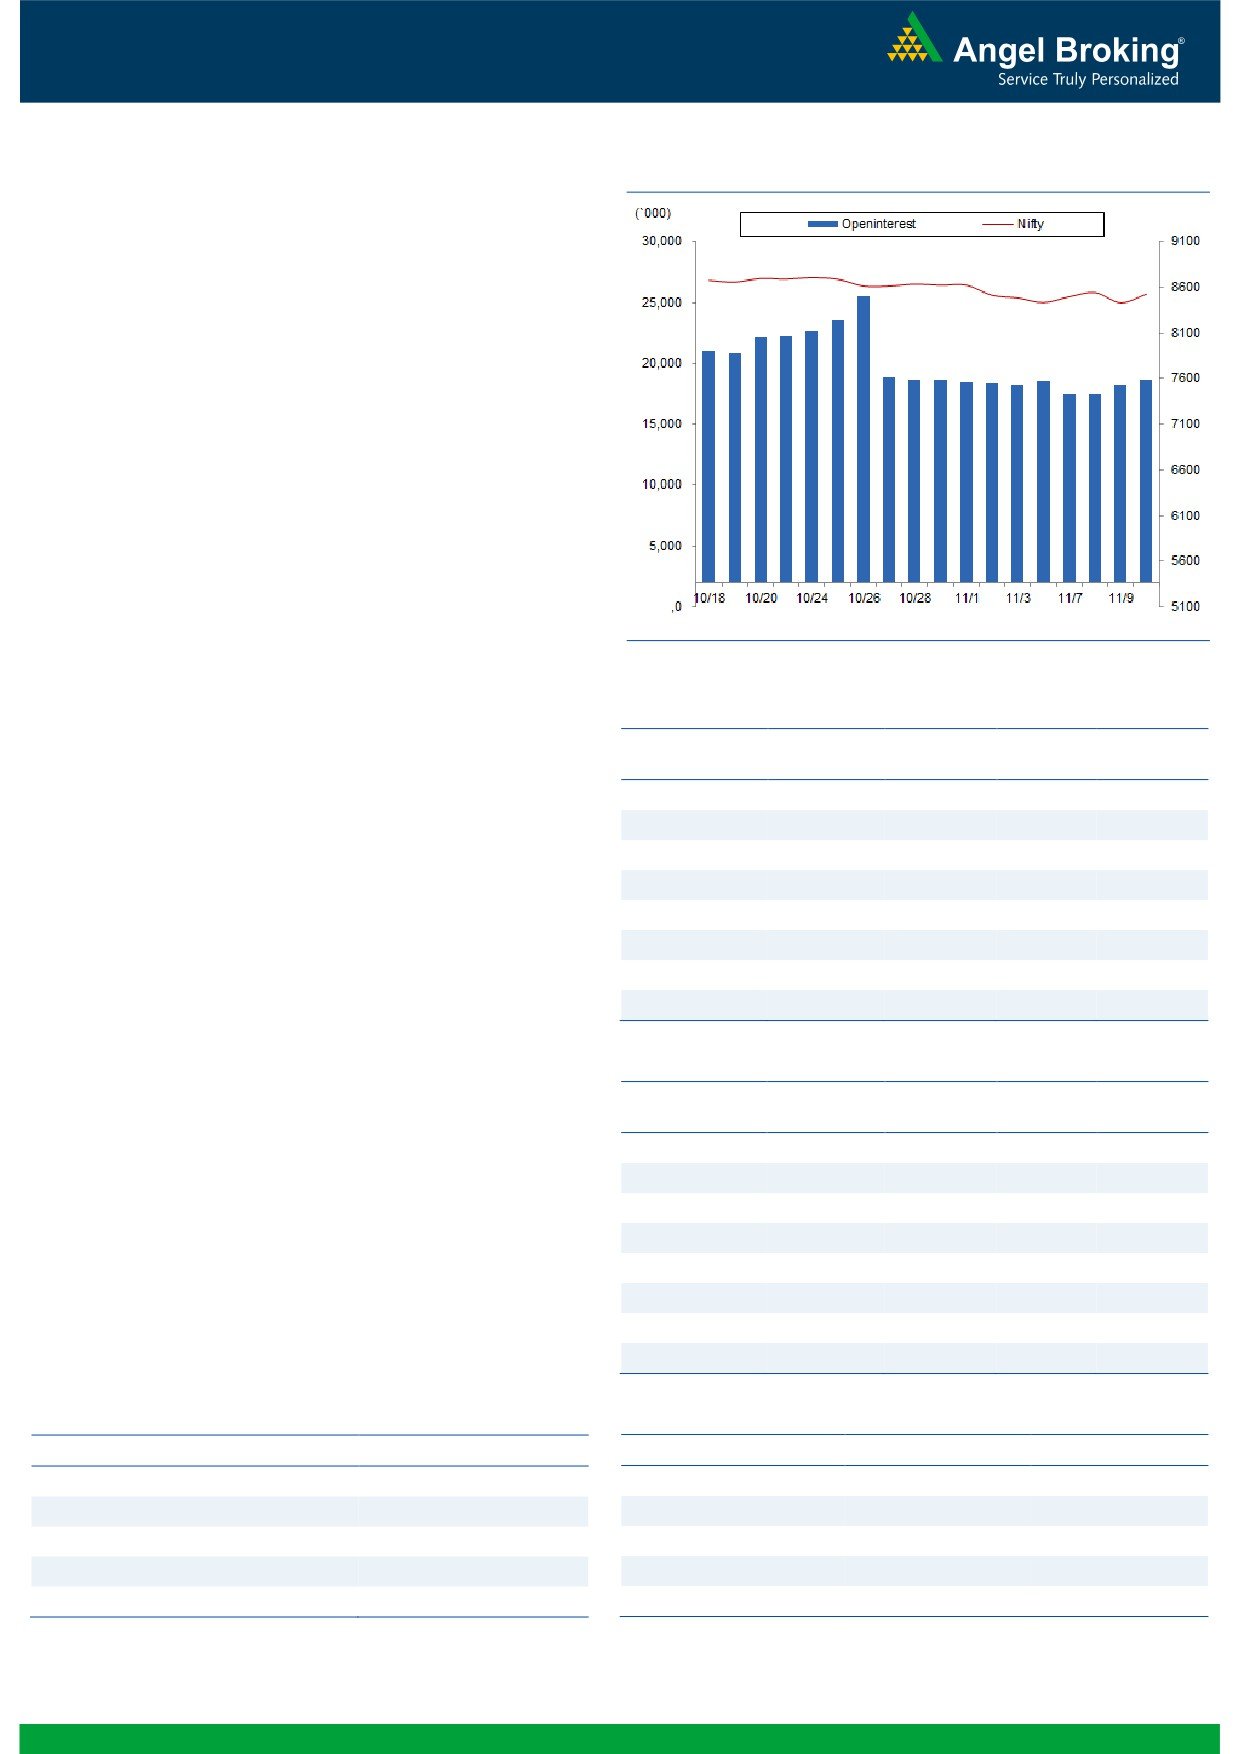
Exhibit 2: Nifty Bank Daily Chart
Nifty Bank Outlook - (20200)
The Nifty Bank index opened yesterday's session with a upside
gap and rallied higher throughout the session. The banking index
has shown tremendous outperformance against the benchmark
indices by posting a gain of 3.49 percent over its previous close.
It was another astonishing day for the banking stocks as the Nifty
Bank index continued its previous day's positive momentum. The
Nifty Bank index gave breakout from the falling trendline
resistance with a gap, which led this firm up move. The stock-
specific move, especially in the PSU Banking space, clearly
indicates resumption of the broader uptrend. Although the
volatility is expected to remain high, traders should trade with
positive bias and look to buy on corrections. The near term
supports for the Nifty Bank index are placed around 19922 and
19787 whereas resistance is seen around 20400 - 20575.
Key Levels
Support 1 - 19922
Resistance 1 - 20400
Support 2 - 19787
Resistance 2 - 20575
1
Technical & Derivatives Report
November 11, 2016
Comments
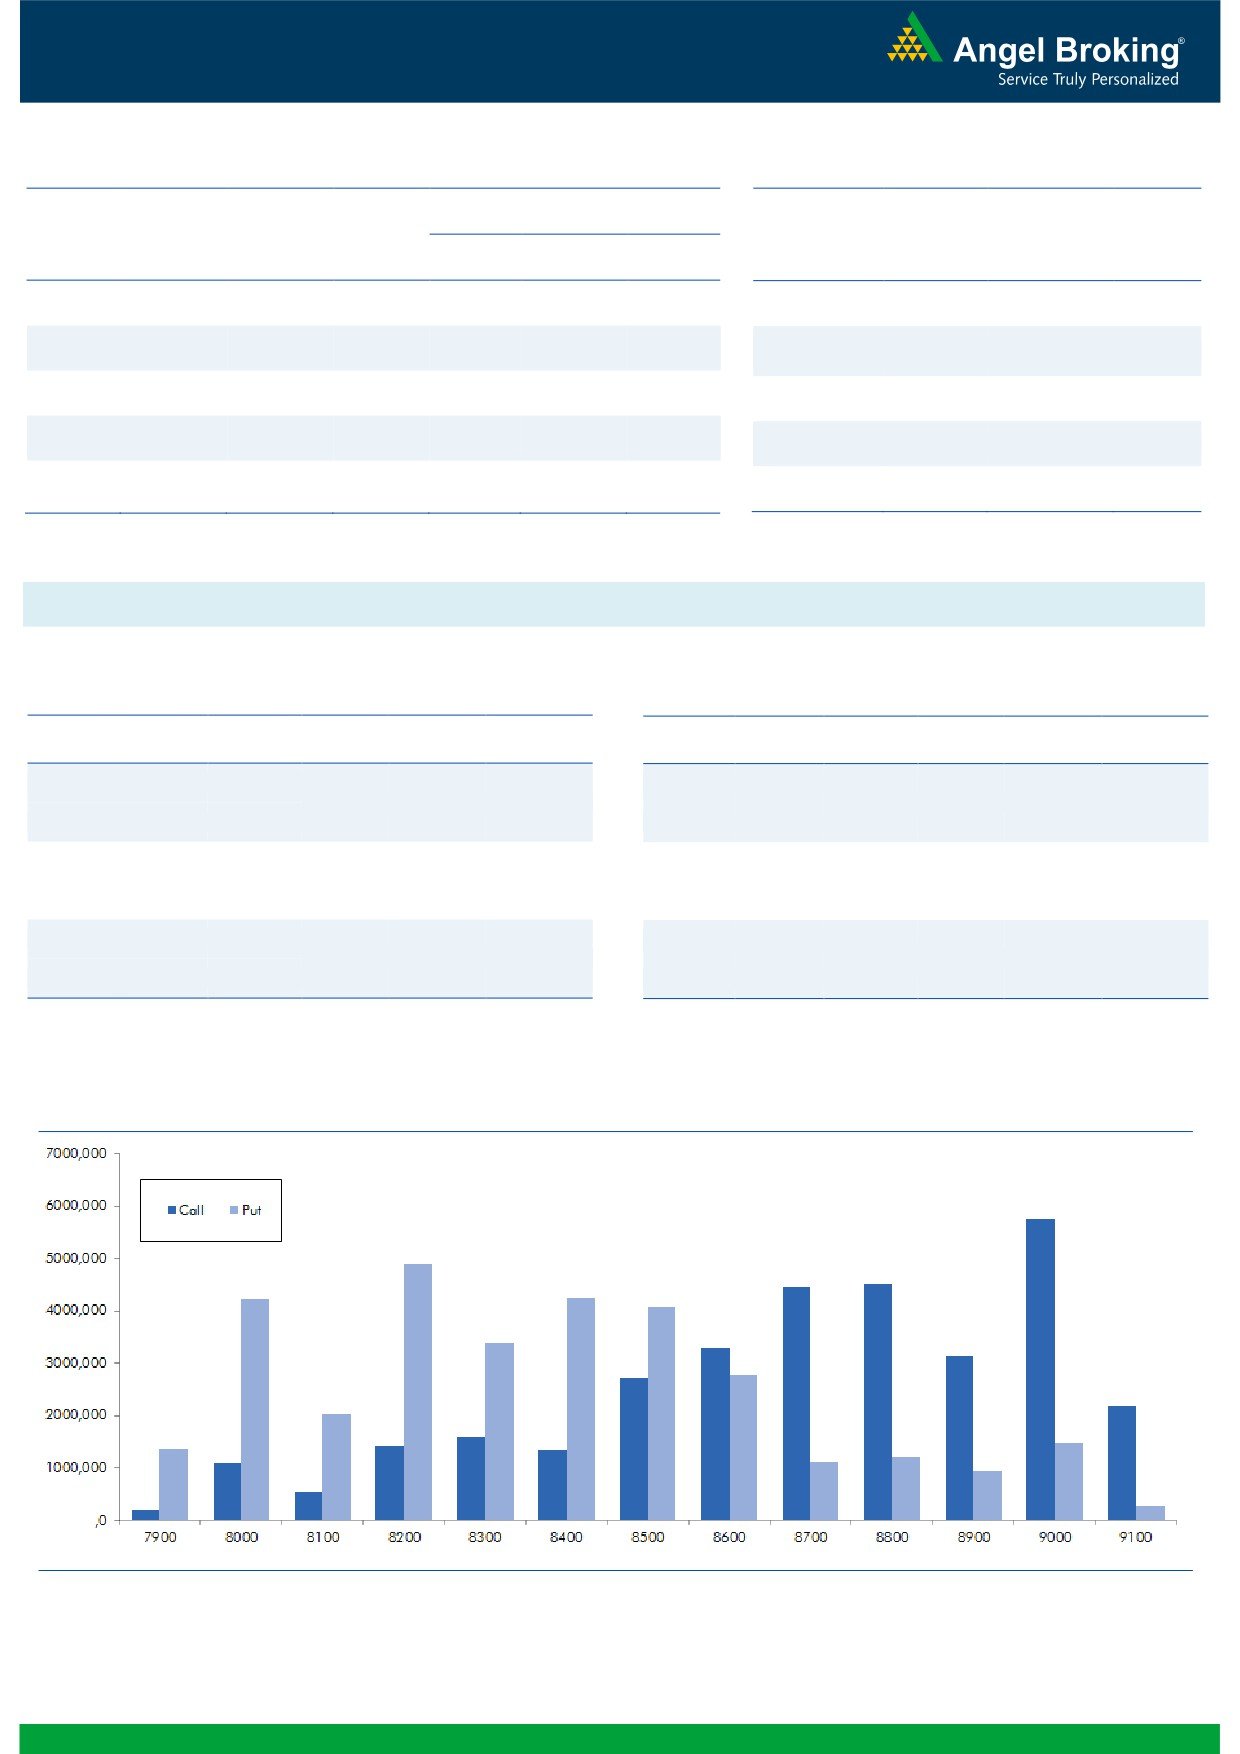
Nifty Vs OI
The Nifty futures open interest has increased by 2.05%
BankNifty futures open interest has increased by 6.63%
as market closed at 8525.75 levels.
The Nifty November future closed with a premium of
27.60 against the premium of 30.70 points in last
trading session. The December series closed at a
premium of 79.20 points.
The Implied Volatility of at the money options has
decreased from 16.20% to 14.21%. At the same time,
the PCR-OI of Nifty has remained unchanged at 0.98
levels.
The total OI of the market is Rs. 2,79,466/- cr. and the
stock futures OI is Rs. 75.187/- cr.
Few of the liquid counters where we have seen high cost
of carry are TATAPOWER, ADANIPOWER, NHPC,
JSWENERGY and JPASSOCIAT.
Views
OI Gainers
Yesterday, FIIs sold in cash market segment; they were
OI
PRICE
SCRIP
OI
PRICE
net sellers of Rs. 733 crores. While, in index futures, they
CHG. (%)
CHG. (%)
were net buyer to the tune of Rs. 205 crores with
IBULHSGFIN
9052000
28.48
702.80
-2.83
marginal change in open interest, indicating blend of
PAGEIND
43300
18.79
15005.65
-6.75
long formation and short covering in yesterday’s trading
TATASTEEL
21982000
18.44
438.55
9.31
www.angelbroking.com
session.
HEROMOTOCO
1489000
17.04
3157.35
-2.68
On Index Options front, FIIs bought of worth Rs. 1261
FEDERALBNK
55869000
14.83
80.65
5.36
crores with rise in OI. In call options, 8700 and 8800
BHARATFIN
7670000
14.80
742.30
-4.06
strike prices added good amount of positions, followed
IDFCBANK
33984000
14.50
74.70
3.97
by unwinding in 8400 and 8300 strike price. On the
PNB
47901000
14.28
159.90
12.01
other hand in put options, 8500 and 8600 strikes added
huge positions. While, good amount of unwinding was
OI Losers
also visible in 8300 and 8200 put options. Maximum OI
OI
PRICE
in November series is placed at 9000 call and 8200 put
SCRIP
OI
PRICE
CHG. (%)
CHG. (%)
options.
SYNDIBANK
16083000
-11.05
72.95
10.28
In last trading sessions, FIIs were net buyers in Index
UNIONBANK
15072000
-9.92
142.75
10.79
Futures but the quantum remains on the lower side.
APOLLOTYRE
9171000
-9.90
196.10
-0.20
Looking at the past two days data, we don’t see any clear
TITAN
10953000
-9.42
348.85
0.19
indication. Thus, we would like to wait for any relevant
CEATLTD
1287300
-7.87
1331.10
-0.40
follow up action by FIIs. At current juncture, we would
ALBK
16610000
-7.47
74.50
8.52
suggest traders to be light in Index and trade stock
ORIENTBANK
13536000
-7.27
126.90
9.78
specific.
CANBK
10593000
-7.13
322.15
6.97
Historical Volatility
Put-Call Ratio
SCRIP
HV
SCRIP
PCR-OI
PCR-VOL
BANKINDIA
73.47
NIFTY
0.98
1.05
PAGEIND
45.13
BANKNIFTY
1.67
0.91
CIPLA
42.23
RELIANCE
0.43
0.43
TATASTEEL
56.20
ICICIBANK
0.56
0.43
UNIONBANK
65.77
SBIN
0.80
0.42
2
Technical & Derivatives Report
November 11, 2016
FII Statistics for November 10, 2016
Turnover on November 10, 2016
Open Interest
No. of
Turnover
Change
Detail
Buy
Sell
Net
Instrument
Value
Change
Contracts
( in Cr. )
(%)
Contracts
(in Cr.)
(%)
INDEX
INDEX
3452.24
3247.69
204.55
193721
13020.16
(0.39)
345025
24585.14
-46.35
FUTURES
FUTURES
INDEX
INDEX
85471.08
84210.41
1260.67
1114968
73243.17
3.33
8553607
638251.38
0.12
OPTIONS
OPTIONS
STOCK
10056.70
9498.62
558.08
882160
56471.12
0.39
STOCK
FUTURES
714767
50992.32
-10.08
FUTURES
STOCK
STOCK
8289.62
8336.44
(46.82)
107240
7261.82
6.02
OPTIONS
575307
42319.63
-0.85
OPTIONS
TOTAL
107269.63
105293.16
1976.48
2298089
149996.26
1.98
TOTAL
10188706
756148.46
-3.39
Nifty Spot = 8525.75
Lot Size = 75
Bull-Call Spreads
Bear-Put Spreads
Action
Strike
Price
Risk
Reward
BEP
Action
Strike
Price
Risk
Reward
BEP
Buy
8600
71.30
Buy
8500
71.55
34.95
65.05
8634.95
28.55
71.45
8471.45
Sell
8700
36.35
Sell
8400
43.00
Buy
8600
71.30
Buy
8500
71.55
54.45
145.55
8654.45
45.65
154.35
8454.35
Sell
8800
16.85
Sell
8300
25.90
Buy
8700
36.35
Buy
8400
43.00
19.50
80.50
8719.50
17.10
82.90
8382.90
Sell
8800
16.85
Sell
8300
25.90
Note: Above mentioned Bullish or Bearish Spreads in Nifty (November Series) are given as an information and not as a recommendation.
Nifty Put-Call Analysis
3
Technical & Derivatives Report
November 11, 2016
Daily Pivot Levels for Nifty Constituents
Scrips
S2
S1
PIVOT
R1
R2
ACC
1 421
1 439
1 468
1 486
1 515
ADANIPORTS
281
288
293
299
304
AMBUJACEM
226
229
232
235
238
ASIANPAINT
974
993
1 026
1 045
1 078
AUROPHARMA
757
775
790
807
822
AXISBANK
485
496
505
516
524
BAJAJ-AUTO
2 625
2 676
2 761
2 812
2 898
BANKBARODA
151
158
162
169
173
BHEL
136
139
141
143
146
BPCL
651
658
665
672
680
BHARTIARTL
298
303
309
314
320
INFRATEL
353
370
382
399
411
BOSCH
19 722
20 294
21 247
21 819
22 772
CIPLA
536
550
559
573
582
COALINDIA
313
323
330
340
347
DRREDDY
3 224
3 251
3 292
3 319
3 361
EICHERMOT
22 211
22 638
23 319
23 747
24 427
GAIL
440
445
450
455
461
GRASIM
889
904
916
932
943
HCLTECH
761
775
790
805
820
HDFCBANK
1 243
1 261
1 272
1 290
1 301
HDFC
1 280
1 302
1 333
1 356
1 387
HEROMOTOCO
3 020
3 083
3 197
3 260
3 374
HINDALCO
163
169
173
180
184
HINDUNILVR
797
808
825
836
853
ICICIBANK
281
287
293
298
304
IDEA
72
72
73
74
75
INDUSINDBK
1 190
1 202
1 215
1 228
1 241
INFY
918
929
946
956
973
ITC
242
247
250
254
257
KOTAKBANK
802
810
822
831
842
LT
1 387
1 399
1 413
1 426
1 440
LUPIN
1 451
1 473
1 511
1 533
1 571
M&M
1 268
1 295
1 337
1 363
1 405
MARUTI
5 171
5 250
5 384
5 462
5 596
NTPC
153
154
155
156
157
ONGC
267
272
276
280
284
POWERGRID
178
183
187
192
195
RELIANCE
994
1 002
1 015
1 024
1 037
SBIN
258
270
277
289
296
SUNPHARMA
645
656
675
685
704
TCS
2 095
2 125
2 171
2 202
2 248
TATAMTRDVR
334
338
346
351
359
TATAMOTORS
520
527
538
545
556
TATAPOWER
71
73
74
76
77
TATASTEEL
397
417
428
448
459
TECHM
428
435
442
449
456
ULTRACEMCO
3 748
3 795
3 862
3 909
3 977
WIPRO
434
440
445
451
457
YESBANK
1 195
1 243
1 278
1 325
1 361
ZEEL
491
499
510
518
529
4
Technical & Derivatives Report
November 11, 2016
Research Team Tel: 022 - 39357800
For Technical Queries
For Derivatives Queries
DISCLAIMER
Angel Broking Private Limited (hereinafter referred to as “Angel”) is a registered Member of National Stock Exchange of India Limited,
Bombay Stock Exchange Limited and Metropolitan Stock Exchange Limited. It is also registered as a Depository Participant with CDSL
and Portfolio Manager with SEBI. It also has registration with AMFI as a Mutual Fund Distributor. Angel Broking Private Limited is a
registered entity with SEBI for Research Analyst in terms of SEBI (Research Analyst) Regulations, 2014 vide registration number
INH000000164. Angel or its associates has not been debarred/ suspended by SEBI or any other regulatory authority for accessing
/dealing in securities Market. Angel or its associates/analyst has not received any compensation / managed or co-managed public
offering of securities of the company covered by Analyst during the past twelve months.
This document is solely for the personal information of the recipient, and must not be singularly used as the basis of any investment
decision. Nothing in this document should be construed as investment or financial advice. Each recipient of this document should
make such investigations as they deem necessary to arrive at an independent evaluation of an investment in the securities of the
companies referred to in this document (including the merits and risks involved), and should consult their own advisors to determine
the merits and risks of such an investment.
Reports based on technical and derivative analysis center on studying charts of a stock's price movement, outstanding positions and
trading volume, as opposed to focusing on a company's fundamentals and, as such, may not match with a report on a company's
fundamentals. Investors are advised to refer the Fundamental and Technical Research Reports available on our website to evaluate the
contrary view, if any.
The information in this document has been printed on the basis of publicly available information, internal data and other reliable
sources believed to be true, but we do not represent that it is accurate or complete and it should not be relied on as such, as this
document is for general guidance only. Angel Broking Pvt. Limited or any of its affiliates/ group companies shall not be in any way
responsible for any loss or damage that may arise to any person from any inadvertent error in the information contained in this report.
Angel Broking Pvt. Limited has not independently verified all the information contained within this document. Accordingly, we cannot
testify, nor make any representation or warranty, express or implied, to the accuracy, contents or data contained within this document.
While Angel Broking Pvt. Limited endeavors to update on a reasonable basis the information discussed in this material, there may be
regulatory, compliance, or other reasons that prevent us from doing so.
This document is being supplied to you solely for your information, and its contents, information or data may not be reproduced,
redistributed or passed on, directly or indirectly.
Neither Angel Broking Pvt. Limited, nor its directors, employees or affiliates shall be liable for any loss or damage that may arise from
or in connection with the use of this information.
5