Technical & Derivatives Report
May 11, 2016
Sensex (25773) / Nifty (7888)
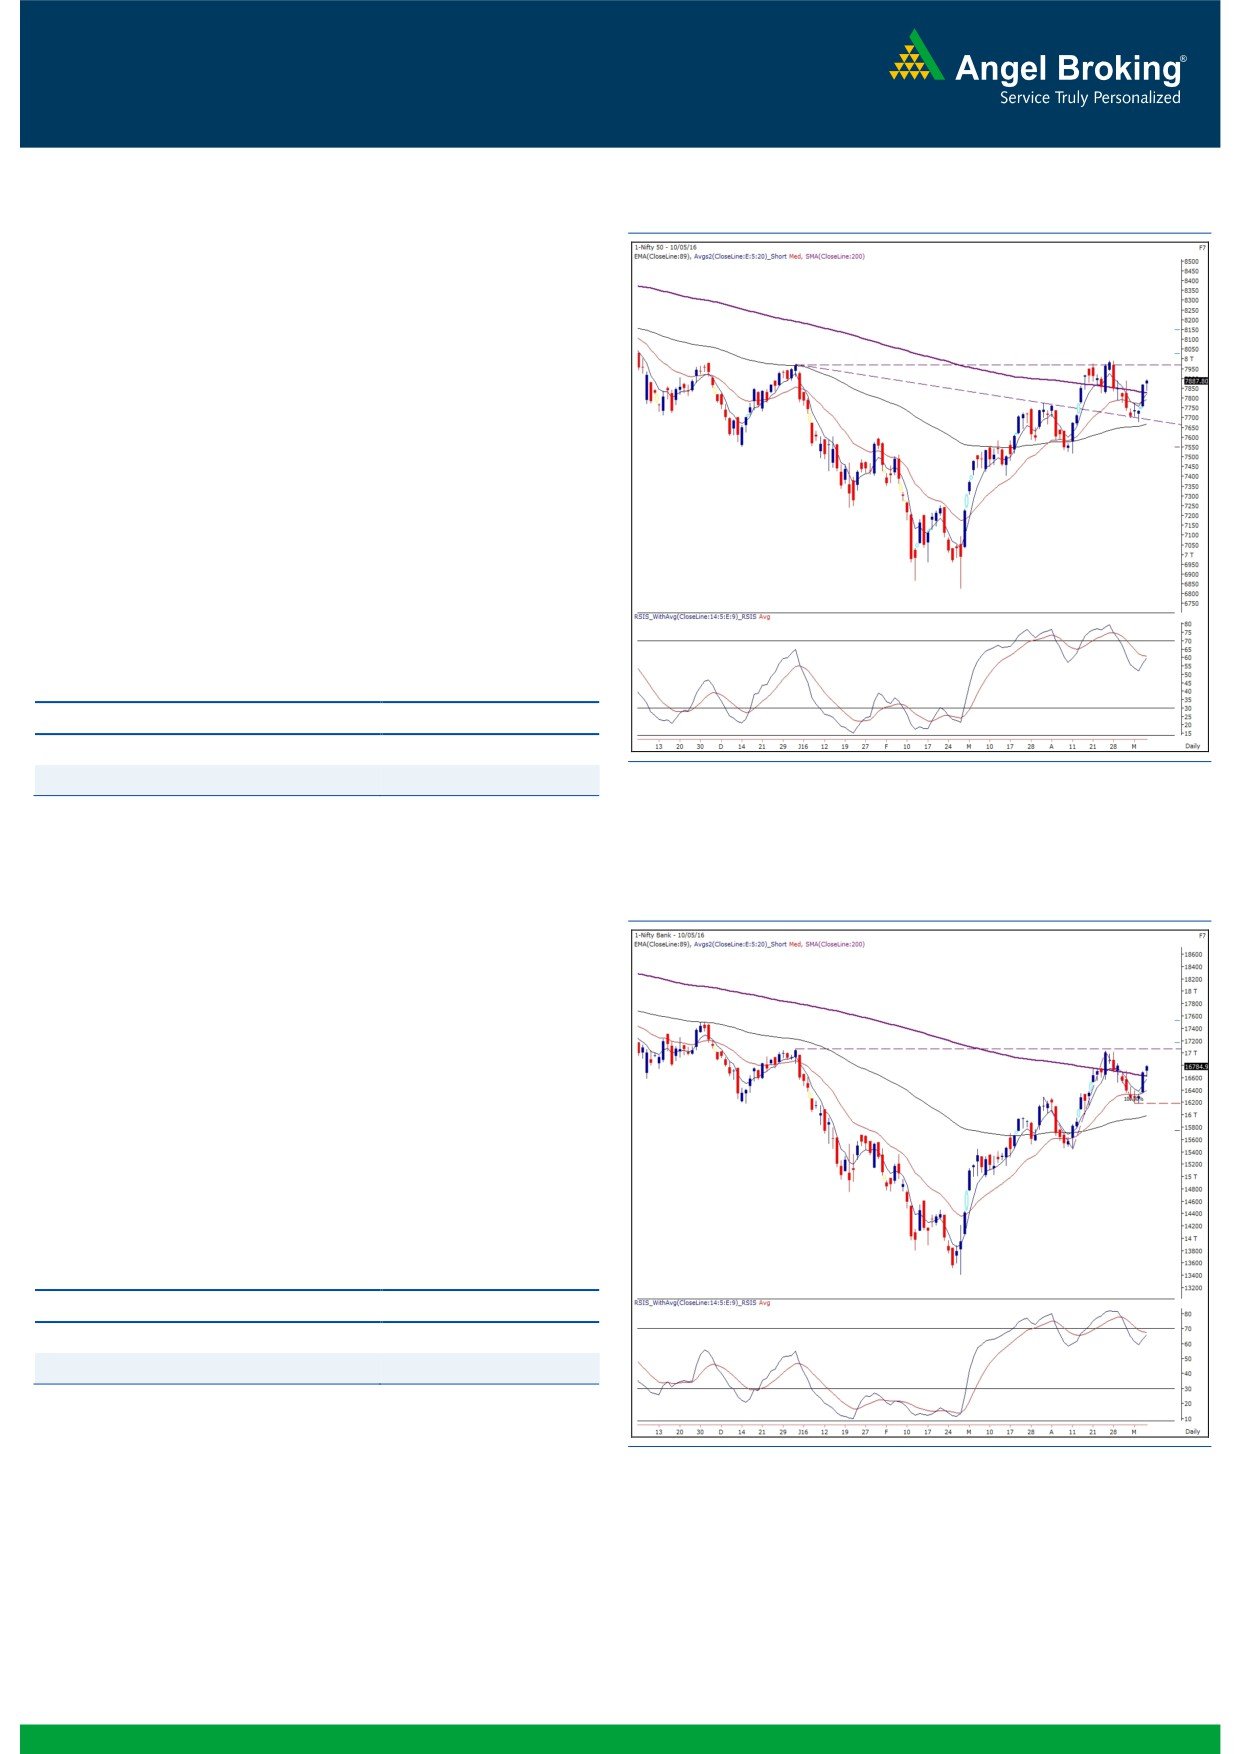
Exhibit 1: Nifty Daily Chart
Monday’s strong closing beyond the 7850 mark was followed by
an obvious gap up opening. Subsequently, the index remained
within a narrow range amid some intraday volatility. However, the
overall bias remained positive to end the range bound session
almost at the highest point of the day.
Yesterday’s session was just a continuation of Monday’s optimistic
move. During the session, the Nifty managed to surpass the
hourly hurdle of 7890.25 by a small margin. At this juncture, we
do not see any weakness on the chart; but, considering the recent
sideways trend and the incompetence of breaking the stiff barrier
of 8000, we would advise traders to keep booking profits on their
existing longs. The intraday resistance zone is seen around 7920
- 7940 levels; whereas, yesterday’s low of 7837 would now act
as an immediate support for the Nifty.
Key Levels
Support 1 - 7837
Resistance 1 - 7920
Support 2 - 7780
Resistance 2 - 7940
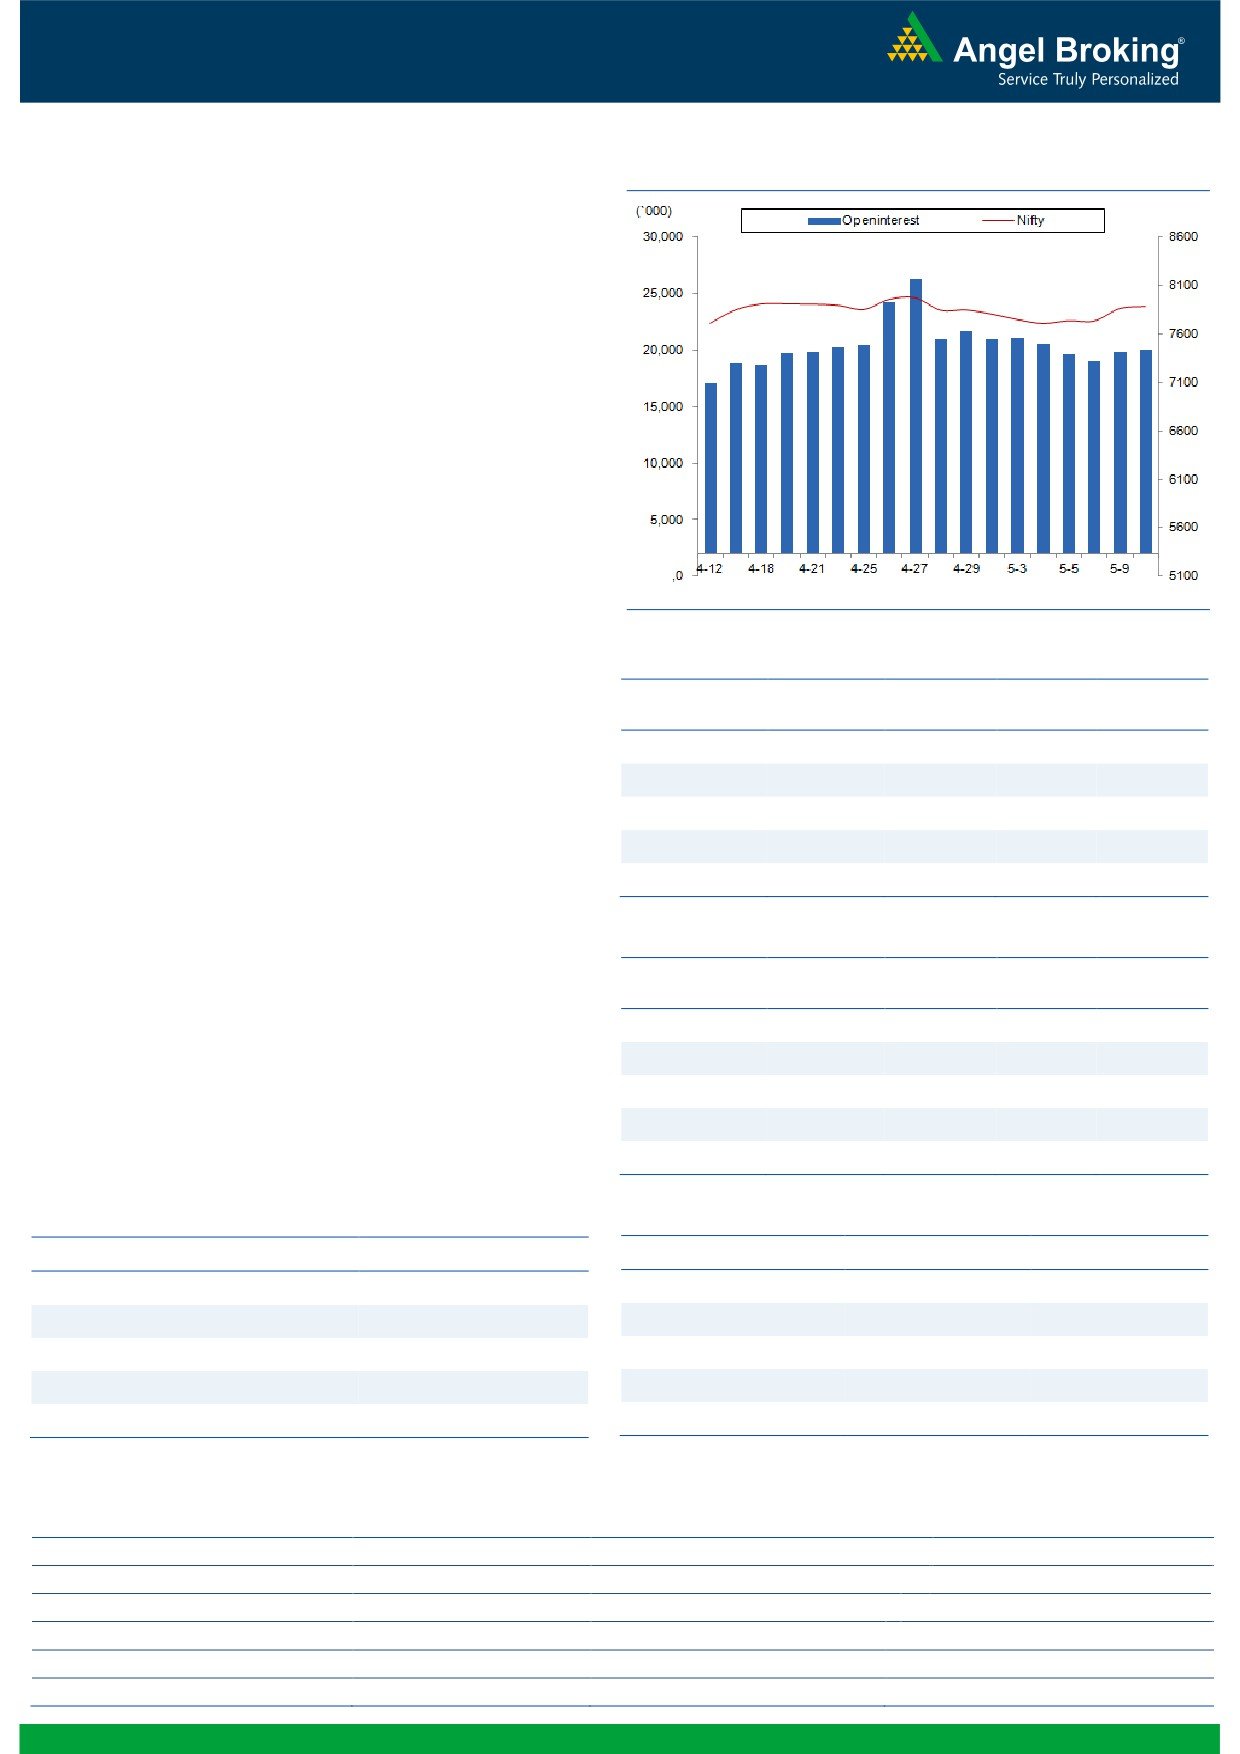
Exhibit 2: Nifty Bank Daily Chart
Nifty Bank Outlook - (16785)
The Nifty Bank index continued its positive momentum and ended
the session with gains of 0.59% over its previous session’s close.
The index moved further higher and seems to be fast
approaching our mentioned target/resistance of 17020 - 17070.
The momentum in Private sector banks, which constitutes majority
of the Nifty Bank index weightage, is indicating positive signs and
hence traders are advised to continue holding long positions in
the index. The intraday support for the index is placed around
16610 and 16500 whereas resistances are seen around 16841
and 17025.
Key Levels
Support 1 - 16610
Resistance 1 - 16841
Support 2 - 16500
Resistance 2 - 17025
1
Technical & Derivatives Report
May 11, 2016
Comments
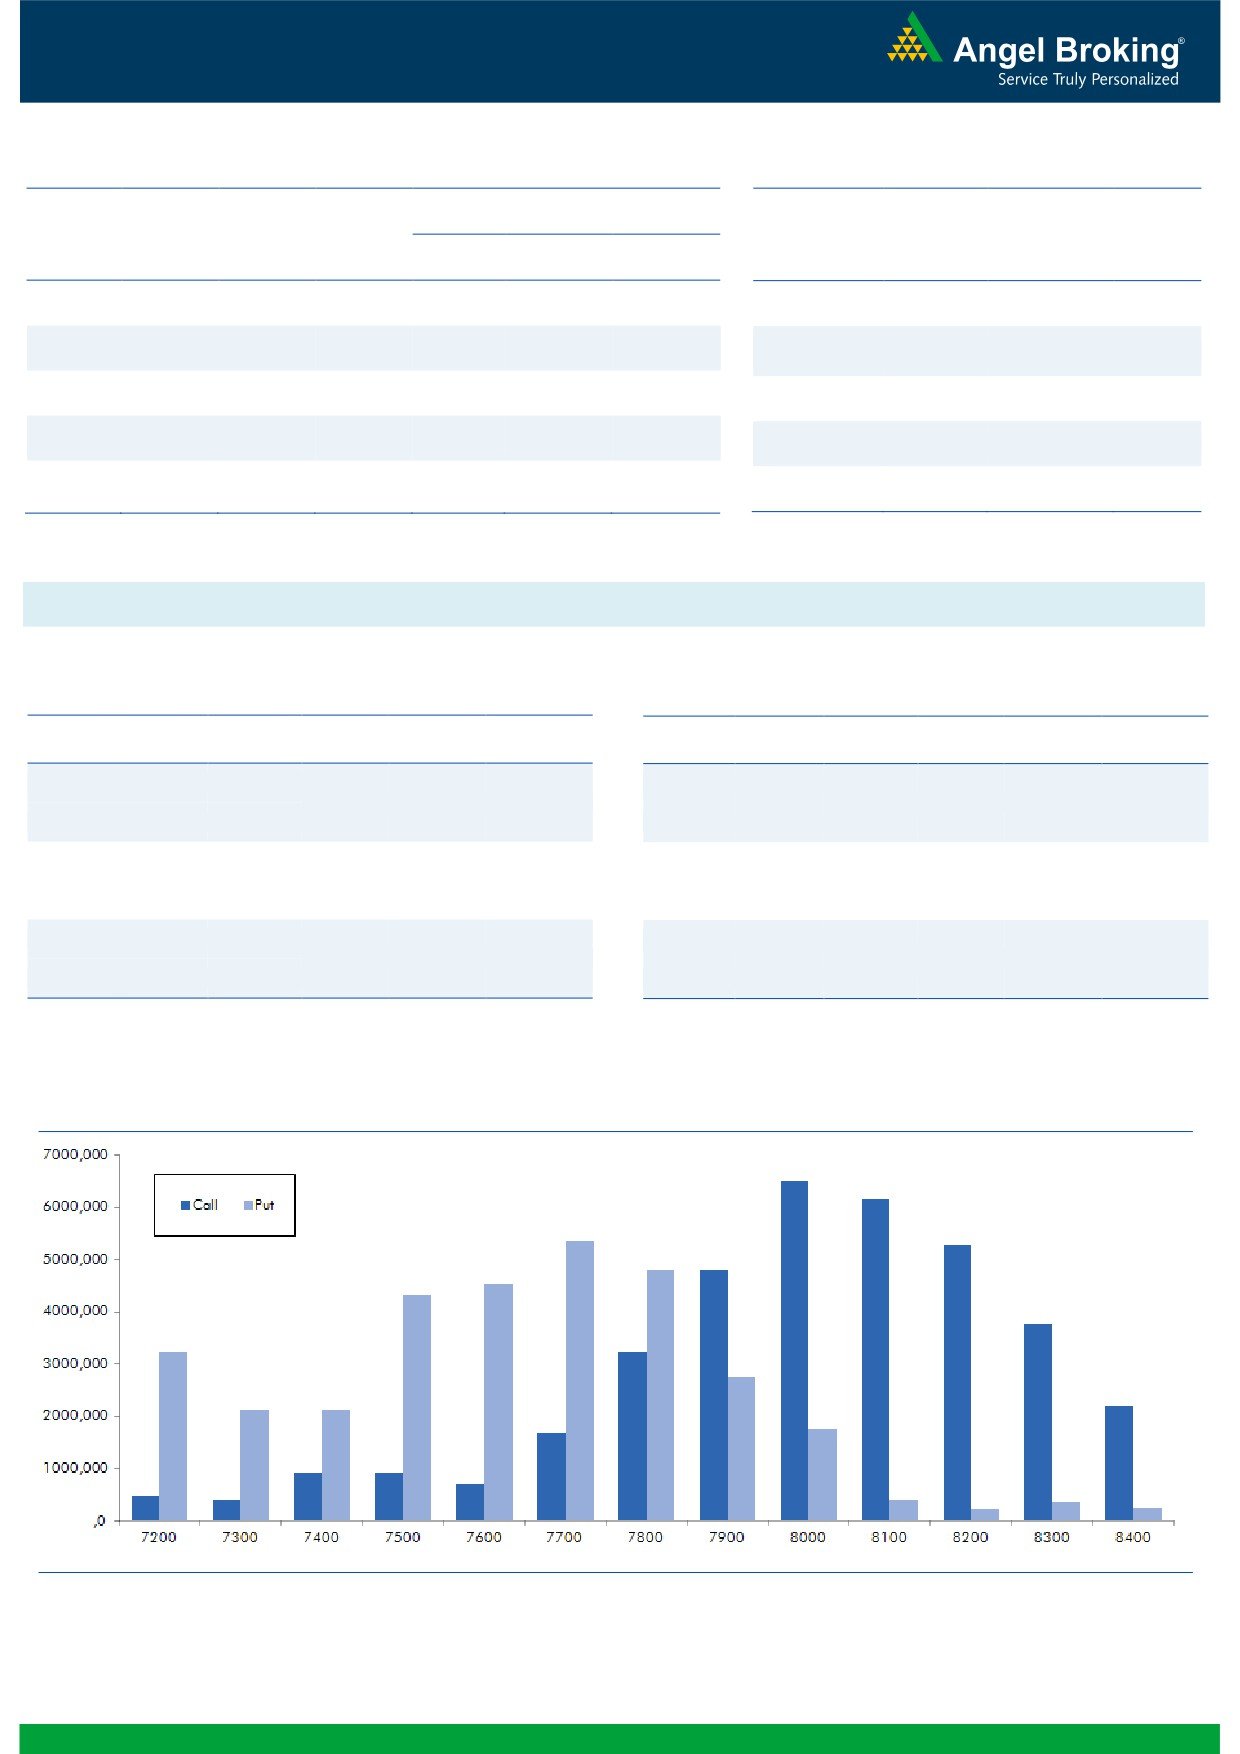
Nifty Vs OI
The Nifty futures open interest has increased by 1.53%
BankNifty futures open interest has increased by 0.11%
as market closed at 7887.80 levels.
The Nifty May future closed at a premium of 31.95
points against a premium of 38.25 points. The June
series closed at a premium of 42.65 points.
The Implied Volatility of at the money options has
decreased from 15.26% to 14.58%.
The total OI of the market is Rs. 2,19,634/- cr. and the
stock futures OI is Rs. 61,022/- cr.
Few of the liquid counters where we have seen high cost
of carry are JPASSOCIAT, UNITECH, ULTRACEMCO,
HDFCBANK and ADANIPOWER.
Views
Yesterday, the FIIs have bought equities worth Rs. 329
OI Gainers
crores. While, they were net seller in Index Futures
OI
PRICE
SCRIP
OI
PRICE
segment to the tune of Rs. 378 crores with marginal rise
CHG. (%)
CHG. (%)
in OI, indicating blend of both short formation and long
CEATLTD
2098600
15.13
1020.20
-1.64
unwinding.
CUMMINSIND
403200
14.48
883.75
2.33
In Index Options front, FIIs bought worth Rs. 287 crores
KSCL
2156250
11.22
406.60
5.61
with rise in OI. In call options, 8100 strike has added
HAVELLS
3460000
10.40
347.55
1.59
some amount of fresh positions; while, unwinding wasng.com
APOLLOTYRE
12144000
9.85
153.25
-3.16
seen in 7900 call option. Whereas in put options, 7600
Put option added huge OI, followed by some additions in
OI Losers
7900 and 7800 strikes. Maximum OI in current series is
OI
PRICE
visible at 8000 call and 7700 put options. Considering
SCRIP
OI
PRICE
CHG. (%)
CHG. (%)
the derivative data, 7700 - 7670 levels would act as a
IBREALEST
25470000
-6.75
83.00
4.27
strong support for the index and the gap down opening
CONCOR
398000
-5.60
1305.80
-1.69
(as suggested by SGX Nifty) would provide good risk-
KPIT
1908000
-4.79
164.75
0.46
reward for fresh long positions. Hence, traders are
INDUSINDBK
4707600
-4.09
1059.45
-0.07
advised not to short this market and look for buying
EXIDEIND
7969600
-3.97
148.55
0.64
opportunity on declines.
Historical Volatility
Put-Call Ratio
SCRIP
HV
SCRIP
PCR-OI
PCR-VOL
CADILAHC
31.19
NIFTY
0.92
0.90
KSCL
48.89
BANKNIFTY
1.03
0.83
JSWSTEEL
27.56
ICICIBANK
0.41
0.27
APOLLOHOSP
26.43
RELIANCE
0.38
0.30
DRREDDY
29.79
SBIN
0.53
0.48
Strategy Date
Symbol
Strategy
Status
02-05-2016
NIFTY
Long Strangle
Active
09-05-2016
RELIANCE
Long Put
Active
2
Technical & Derivatives Report
May 11, 2016
FII Statistics for 10-May 2016
Turnover on 10-May 2016
Open Interest
No. of
Turnover
Change
Detail
Buy
Sell
Net
Instrument
Value
Contracts
( in Cr. )
(%)
Contracts
Change (%)
(in Cr.)
INDEX
INDEX
908.76
1286.34
(377.58)
241548
13985.24
0.63
313630
13306.84
-24.35
FUTURES
FUTURES
INDEX
INDEX
19367.21
19079.72
287.49
1094272
64207.27
2.67
2885567
136383.62
-18.72
OPTIONS
OPTIONS
STOCK
3482.68
4214.77
(732.09)
1013401
48982.69
1.41
STOCK
FUTURES
515157
24054.30
-6.44
FUTURES
STOCK
STOCK
2138.04
2113.03
25.01
66689
3256.08
6.95
OPTIONS
286718
13268.57
-7.95
OPTIONS
TOTAL
25896.70
26693.86
(797.16)
2415910
130431.28
2.04
TOTAL
4001072
187013.33
-17.07
Nifty Spot = 7887.80
Lot Size = 75
Bull-Call Spreads
Bear-Put Spreads
Action
Strike
Price
Risk
Reward
BEP
Action
Strike
Price
Risk
Reward
BEP
Buy
7900
106.20
Buy
7900
86.95
45.75
54.25
7945.75
35.40
64.60
7864.60
Sell
8000
60.45
Sell
7800
51.55
Buy
7900
106.20
Buy
7900
86.95
75.05
124.95
7975.05
57.15
142.85
7842.85
Sell
8100
31.15
Sell
7700
29.80
Buy
8000
60.45
Buy
7800
51.55
29.30
70.70
8029.30
21.75
78.25
7778.25
Sell
8100
31.15
Sell
7700
29.80
Note: Above mentioned Bullish or Bearish Spreads in Nifty (May Series) are given as an information and not as a recommendation.
Nifty Put-Call Analysis
3
Technical & Derivatives Report
May 11, 2016
Daily Pivot Levels for Nifty Constituents
Scrips
S2
S1
PIVOT
R1
R2
ACC
1,411
1,437
1,452
1,478
1,492
ADANIPORTS
191
193
196
198
201
AMBUJACEM
215
218
220
223
225
ASIANPAINT
885
892
900
907
915
AUROPHARMA
803
809
816
821
828
AXISBANK
474
481
485
492
496
BAJAJ-AUTO
2,483
2,507
2,523
2,547
2,563
BANKBARODA
150
154
156
160
162
BHEL
124
126
128
131
133
BPCL
914
921
932
938
950
BHARTIARTL
357
363
366
372
375
INFRATEL
370
374
377
382
385
BOSCH
19,426
19,561
19,806
19,941
20,186
CIPLA
530
533
536
540
543
COALINDIA
281
283
285
287
289
DRREDDY
2,800
2,862
2,912
2,974
3,024
EICHERMOT
19,853
20,046
20,272
20,466
20,692
GAIL
375
383
389
397
403
GRASIM
4,019
4,117
4,199
4,297
4,379
HCLTECH
712
715
720
723
728
HDFCBANK
1,131
1,138
1,143
1,150
1,154
HDFC
1,189
1,204
1,212
1,227
1,235
HEROMOTOCO
2,915
2,936
2,953
2,974
2,991
HINDALCO
88
89
90
91
92
HINDUNILVR
836
849
859
872
881
ICICIBANK
220
223
225
228
230
IDEA
111
112
113
114
115
INDUSINDBK
1,045
1,050
1,052
1,057
1,060
INFY
1,189
1,201
1,209
1,221
1,229
ITC
319
321
324
326
328
KOTAKBANK
703
713
721
731
740
LT
1,276
1,298
1,310
1,333
1,345
LUPIN
1,589
1,602
1,611
1,624
1,633
M&M
1,323
1,336
1,346
1,359
1,369
MARUTI
3,797
3,821
3,859
3,883
3,921
NTPC
138
139
141
143
145
ONGC
203
205
209
211
214
POWERGRID
139
141
142
143
145
RELIANCE
975
979
982
986
988
SBIN
185
187
189
191
192
SUNPHARMA
794
798
804
809
815
TCS
2,480
2,501
2,518
2,539
2,556
TATAMTRDVR
273
277
284
288
295
TATAMOTORS
379
384
392
397
406
TATAPOWER
71
72
73
73
74
TATASTEEL
318
323
330
335
342
TECHM
471
477
481
487
491
ULTRACEMCO
3,113
3,139
3,163
3,190
3,214
WIPRO
531
535
538
542
546
YESBANK
932
941
947
956
962
ZEEL
411
414
418
422
426
4
Technical & Derivatives Report
May 11, 2016
Research Team Tel: 022 - 39357800
For Technical Queries
For Derivatives Queries
DISCLAIMER
Angel Broking Private Limited (hereinafter referred to as “Angel”) is a registered Member of National Stock Exchange of India Limited,
Bombay Stock Exchange Limited and MCX Stock Exchange Limited. It is also registered as a Depository Participant with CDSL and
Portfolio Manager with SEBI. It also has registration with AMFI as a Mutual Fund Distributor. Angel Broking Private Limited is a
registered entity with SEBI for Research Analyst in terms of SEBI (Research Analyst) Regulations, 2014 vide registration number
INH000000164. Angel or its associates has not been debarred/ suspended by SEBI or any other regulatory authority for accessing
/dealing in securities Market. Angel or its associates including its relatives/analyst do not hold any financial interest/beneficial
ownership of more than 1% in the company covered by Analyst. Angel or its associates/analyst has not received any compensation /
managed or co-managed public offering of securities of the company covered by Analyst during the past twelve months. Angel/analyst
has not served as an officer, director or employee of company covered by Analyst and has not been engaged in market making activity
of the company covered by Analyst.
This document is solely for the personal information of the recipient, and must not be singularly used as the basis of any investment
decision. Nothing in this document should be construed as investment or financial advice. Each recipient of this document should
make such investigations as they deem necessary to arrive at an independent evaluation of an investment in the securities of the
companies referred to in this document (including the merits and risks involved), and should consult their own advisors to determine
the merits and risks of such an investment.
Reports based on technical and derivative analysis center on studying charts of a stock's price movement, outstanding positions and
trading volume, as opposed to focusing on a company's fundamentals and, as such, may not match with a report on a company's
fundamentals.
The information in this document has been printed on the basis of publicly available information, internal data and other reliable
sources believed to be true, but we do not represent that it is accurate or complete and it should not be relied on as such, as this
document is for general guidance only. Angel Broking Pvt. Limited or any of its affiliates/ group companies shall not be in any way
responsible for any loss or damage that may arise to any person from any inadvertent error in the information contained in this report.
Angel Broking Pvt. Limited has not independently verified all the information contained within this document. Accordingly, we cannot
testify, nor make any representation or warranty, express or implied, to the accuracy, contents or data contained within this document.
While Angel Broking Pvt. Limited endeavors to update on a reasonable basis the information discussed in this material, there may be
regulatory, compliance, or other reasons that prevent us from doing so.
This document is being supplied to you solely for your information, and its contents, information or data may not be reproduced,
redistributed or passed on, directly or indirectly.
Neither Angel Broking Pvt. Limited, nor its directors, employees or affiliates shall be liable for any loss or damage that may arise from
or in connection with the use of this information.
Note: Please refer to the important ‘Stock Holding Disclosure' report on the Angel website (Research Section). Also, please refer to the
latest update on respective stocks for the disclosure status in respect of those stocks. Angel Broking Pvt. Limited and its affiliates may
have investment positions in the stocks recommended in this report.
5