Technical & Derivatives Report
April 11, 2016
Sensex (24674) / Nifty (7555)
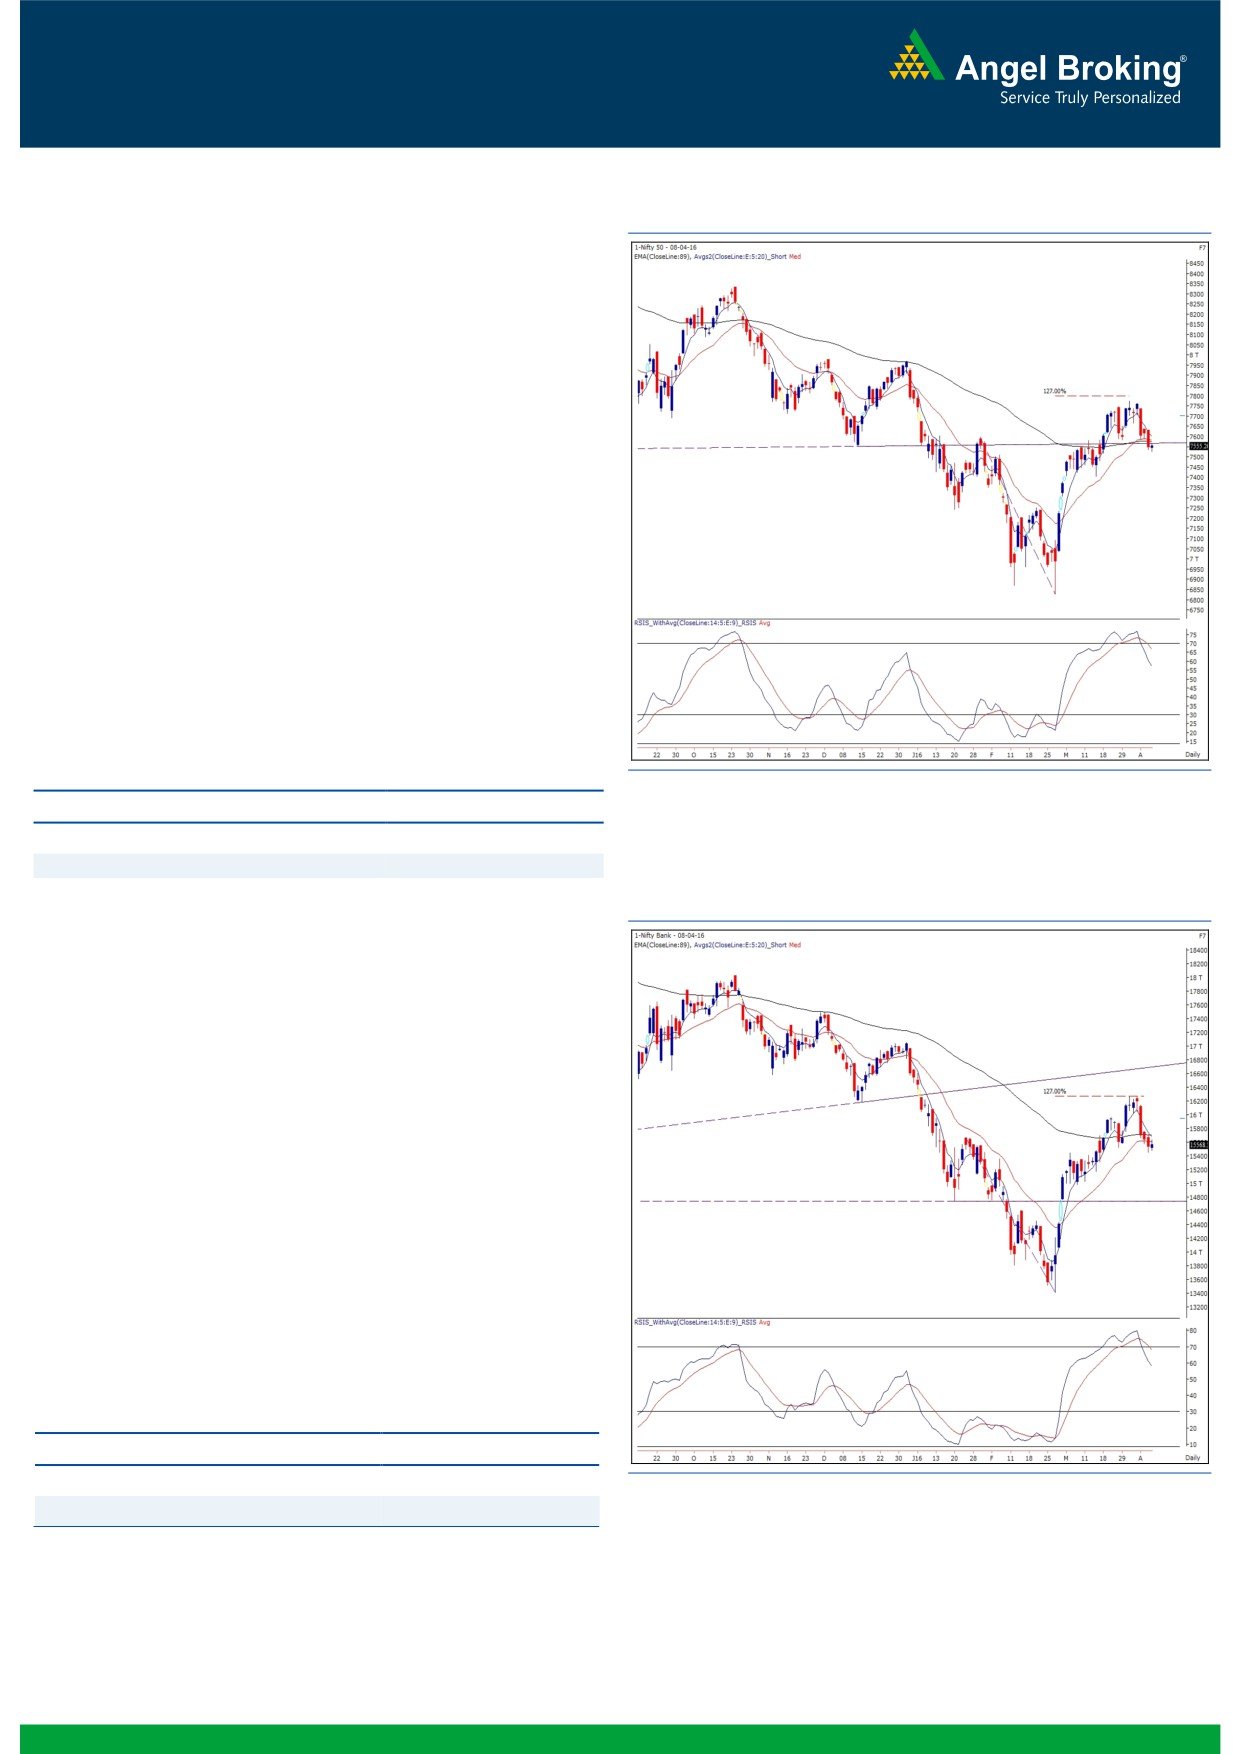
Exhibit 1: Nifty Daily Chart
A colossal rally in the month of March was followed by some
decent profit booking in the inaugural week of the new financial
year. If one refers to our previous weekly report, we had clearly
expressed our negative bias on the market and the week’s
corrective move was no surprise to us. The Nifty precisely lost
steam after entering our mentioned resistance zone of 7750 -
7780 and then kept on correcting throughout the week post the
RBI Monetary Policy. In the process, the index sneaked below the
reliable support level of 7580, which coincided with the daily ’20
EMA’. This is a sign of weakness and thus, considering the
negative placement of the daily ‘RSI-Smoothened’ oscillator, we
expect this corrective move to continue towards 7480 - 7405
levels. On the flipside, 7580 - 7640 is likely to act as a strong
hurdle. Going forward, we expect the range bound action to
continue, but with a negative bias. Meanwhile, the corporate
result season (1QFY2017) will kick-off in the forthcoming week
and thus, we may see a lot of stock specific moves, where traders
can look for potential trades.
Key Levels
Support 1 - 7480
Resistance 1 - 7580
Support 2 - 7450
Resistance 2 - 7640
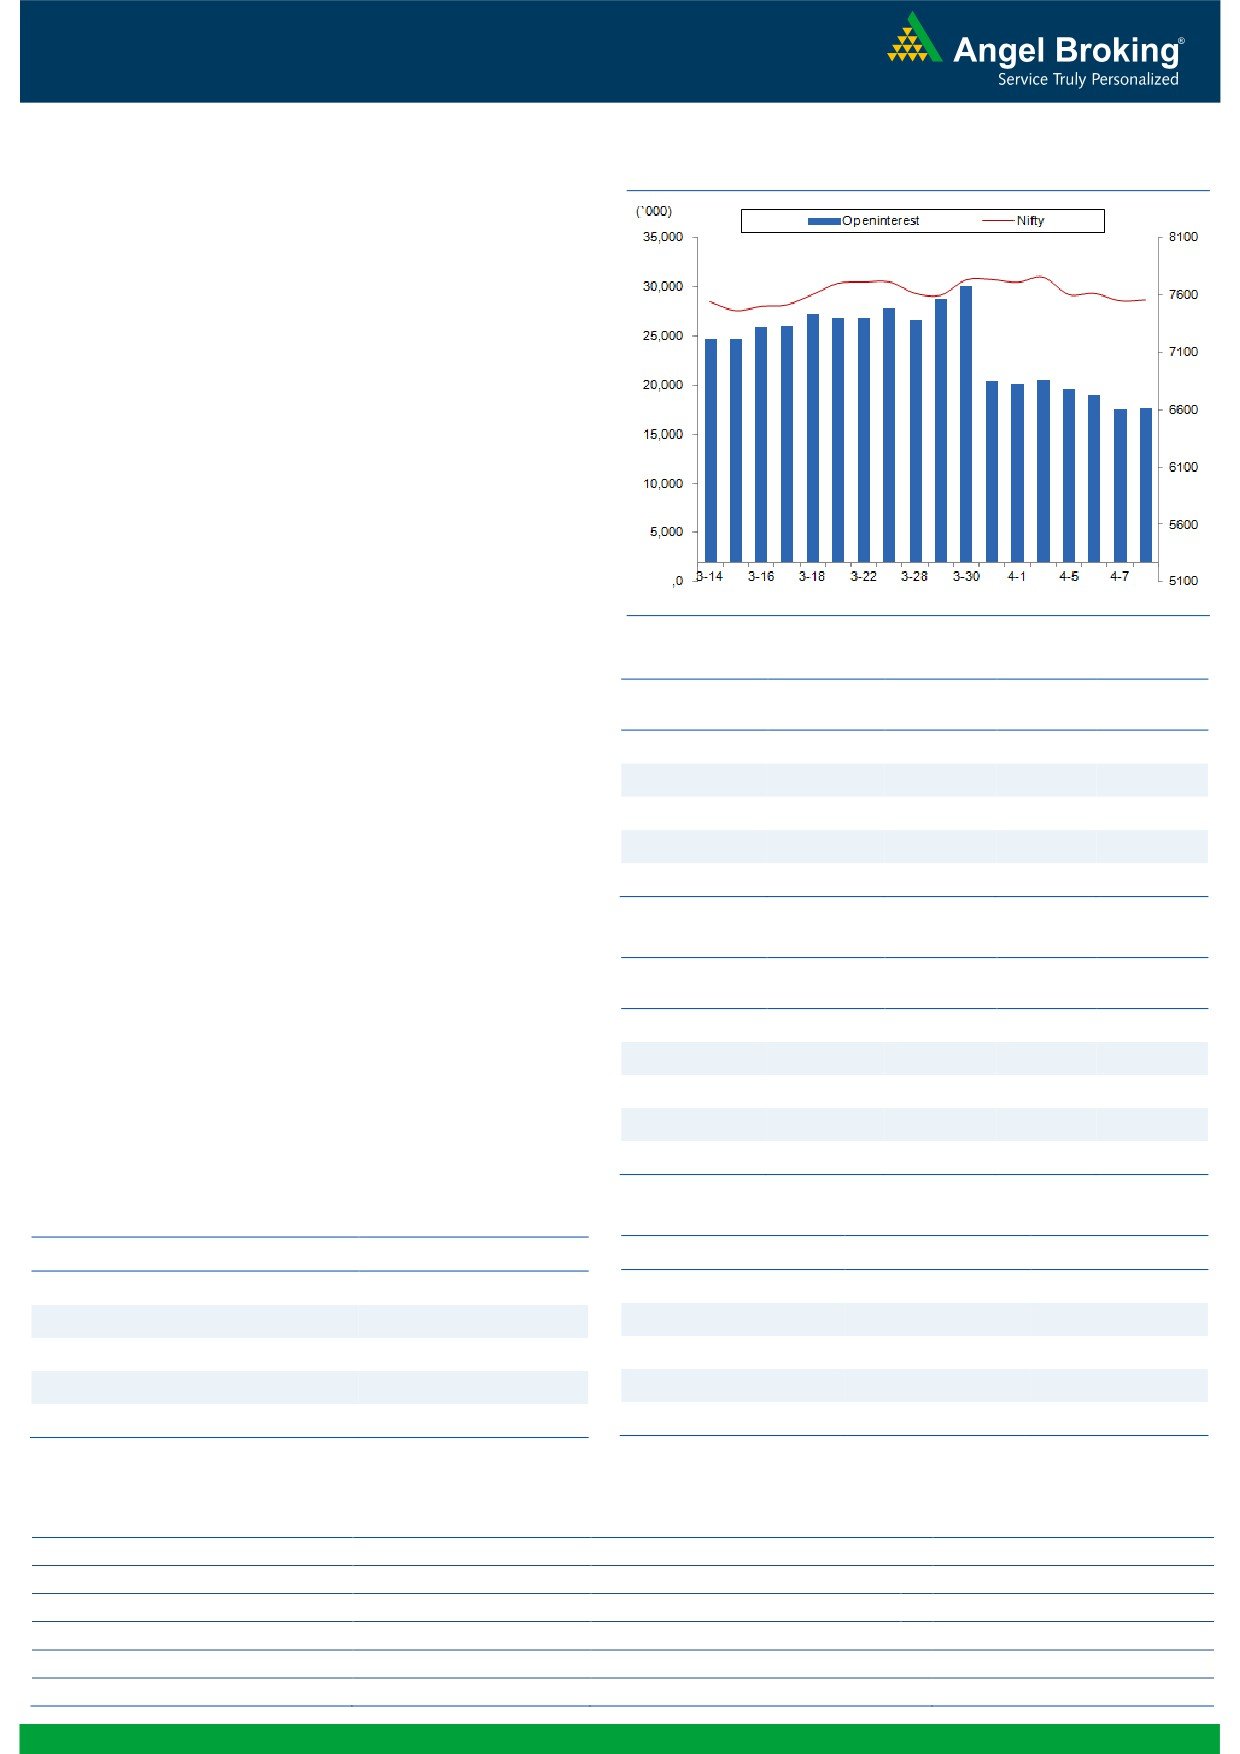
Exhibit 2: Nifty Bank Daily Chart
Nifty Bank Outlook - (15568)
The Nifty Bank index opened on a flat note on Friday and moved
in narrow range throughout the session. Eventually, the banking
index ended the session with the marginal gains of 0.24 percent
over its previous close.
The banking index has failed to cross its multiple resistance zone
of 16300 - 16400 and corrected in last few sessions to form a
‘Bearish Engulfing’ pattern on weekly chart. Due to formation of
mentioned candlestick pattern, a sustainable move below
previous week’s low of 15458 may drag the index 15180 -
15000 levels. Additionally, the ‘RSI -smoothened’ oscillator on
daily chart also depicts negative picture of the index by giving
negative crossover from oversold territory. On the upside, the
near term resistances are seen around 15760 and 15970.
Traders are advised to continue to trade with a cautious view with
proper risk management strategy.
Key Levels
Support 1 - 15458
Resistance 1 - 15760
Support 2 - 15180
Resistance 2 - 15970
1
Technical & Derivatives Report
April 11, 2016
Comments
Nifty Vs OI
The Nifty futures open interest has increased by 0.48%
BankNifty futures open interest has increased by 4.08%
as market closed at 7555.20 levels.
The Nifty April future closed at a premium of 22.90
points against a premium of 18.60 points. The May
series closed at a premium of 56.65 points.
The Implied Volatility of at the money options has
decreased from 14.67% to 13.86%.
The total OI of the market is Rs. 1,98,794/- cr. and the
stock futures OI is Rs. 53,000/- cr.
Few of the liquid counters where we have seen high cost
of carry are UNITECH, CESC, FEDERALBNK, JISLJALEQS
and JINDALSTEL.
Views
FIIs were net buyers in cash market segment to the tune
OI Gainers
of Rs. 180 crores. While in Index Futures, they sold of Rs.
OI
PRICE
897 crores with some rise in OI, suggesting blend of
SCRIP
OI
PRICE
CHG. (%)
CHG. (%)
fresh short formation and unwinding of long positions in
AJANTPHARM
439200
24.07
1472.30
4.69
last trading session.
BEML
922000
16.78
892.55
-3.35
In Index Options front, FIIs were net buyers of Rs. 211
JINDALSTEL
41650000
14.89
67.10
11.28
crores with rise in OI. We hardly saw any meaningful
AMBUJACEM
7362600
11.51
226.90
-0.20
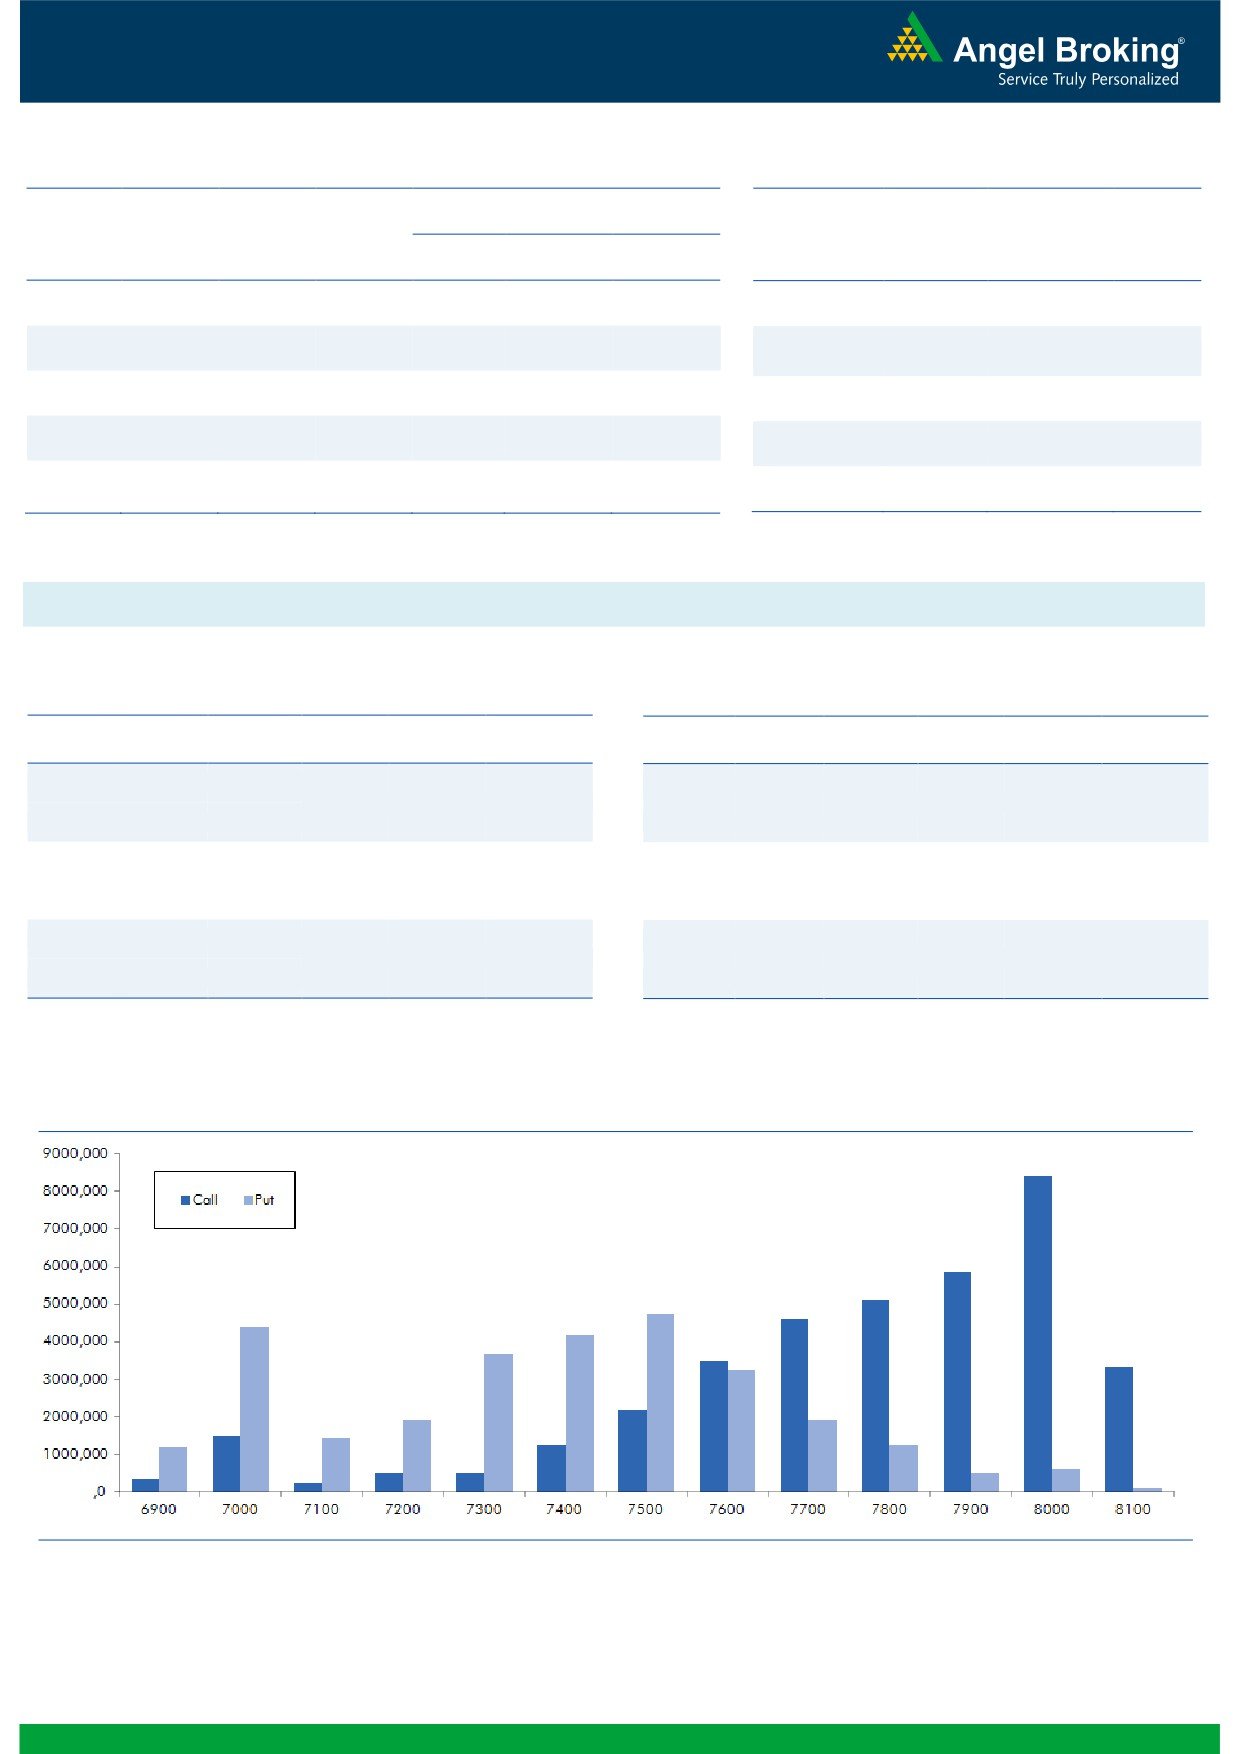
open intrest addition both in call and put options. 7700ng.com
HAVELLS
3700000
9.86
329.65
2.63
call and 7000 put options were comparatively active and
they also added some OI. While, unwinding was visible
OI Losers
in 7500 and 7600 put options, which may be covering
OI
PRICE
by those who were short in these strikes. Maximum OI in
SCRIP
OI
PRICE
CHG. (%)
CHG. (%)
current series is visible in 8000 call and 7500 put
GODREJCP
269600
-11.20
1379.00
1.73
options. Last week, Nifty remained under pressure due to
TATAPOWER
28016000
-9.44
65.90
2.73
good amount of profit booking and some addition of
NTPC
15716000
-7.42
131.75
3.86
shorts. Looking at overall F&O data, we would suggest
HCLTECH
5660400
-4.59
830.15
0.55
traders to avoid forming fresh long till we see any
UCOBANK
9240000
-4.55
38.15
1.46
positive development.
Historical Volatility
Put-Call Ratio
SCRIP
HV
SCRIP
PCR-OI
PCR-VOL
JINDALSTEL
93.14
NIFTY
0.76
0.81
NTPC
33.96
BANKNIFTY
0.59
0.75
AJANTPHARM
41.19
SBIN
0.36
0.29
PAGEIND
63.17
MARUTI
0.34
0.47
INDIACEM
61.04
ICICIBANK
0.38
0.52
Strategy Date
Symbol
Strategy
Status
April 04, 2016
TCS
Ratio Bear Put Spread
Active
2
Technical & Derivatives Report
April 11, 2016
FII Statistics for 08-April 2016
Turnover on 08-April 2016
Open Interest
No. of
Turnover
Change
Detail
Buy
Sell
Net
Instrument
Value
Contracts
( in Cr. )
(%)
Contracts
Change (%)
(in Cr.)
INDEX
INDEX
858.67
1755.95
(897.28)
219735
12097.82
1.32
216016
11402.47
-33.49
FUTURES
FUTURES
INDEX
INDEX
20925.59
20714.38
211.21
1036379
58072.48
1.88
2257878
126389.23
-23.97
OPTIONS
OPTIONS
STOCK
2919.18
3226.84
(307.67)
982351
44989.93
0.15
STOCK
FUTURES
426327
20258.55
-19.64
FUTURES
STOCK
STOCK
2042.74
2080.48
(37.74)
53863
2483.15
9.35
OPTIONS
230789
11182.29
-18.86
OPTIONS
TOTAL
26746.18
27777.65
(1031.47)
2292328
117643.38
1.24
TOTAL
3131010
169232.53
-23.90
Nifty Spot = 7555.20
Lot Size = 75
Bull-Call Spreads
Bear-Put Spreads
Action
Strike
Price
Risk
Reward
BEP
Action
Strike
Price
Risk
Reward
BEP
Buy
7600
87.00
Buy
7500
69.60
39.80
60.20
7639.80
27.00
73.00
7473.00
Sell
7700
47.20
Sell
7400
42.60
Buy
7600
87.00
Buy
7500
69.60
64.60
135.40
7664.60
43.85
156.15
7456.15
Sell
7800
22.40
Sell
7300
25.75
Buy
7700
47.20
Buy
7400
42.60
24.80
75.20
7724.80
16.85
83.15
7383.15
Sell
7800
22.40
Sell
7300
25.75
Note: Above mentioned Bullish or Bearish Spreads in Nifty (April Series) are given as an information and not as a recommendation.
Nifty Put-Call Analysis
3
Technical & Derivatives Report
April 11, 2016
Daily Pivot Levels for Nifty Constituents
Scrips
S2
S1
PIVOT
R1
R2
ACC
1,397
1,420
1,434
1,457
1,471
ADANIPORTS
213
216
218
221
223
AMBUJACEM
218
222
227
230
235
ASIANPAINT
842
847
854
859
866
AUROPHARMA
742
750
755
763
769
AXISBANK
416
419
423
426
430
BAJAJ-AUTO
2,327
2,358
2,382
2,413
2,436
BANKBARODA
141
142
143
144
145
BHEL
321
328
333
339
344
BPCL
116
119
121
125
127
BHARTIARTL
18,735
18,864
18,979
19,108
19,223
INFRATEL
872
886
894
907
915
BOSCH
499
502
506
509
513
CIPLA
276
278
280
282
285
COALINDIA
2,994
3,016
3,053
3,076
3,112
DRREDDY
18,607
18,894
19,092
19,380
19,578
EICHERMOT
332
340
345
352
357
GAIL
3,833
3,908
3,950
4,025
4,067
GRASIM
821
827
832
838
842
HCLTECH
1,062
1,071
1,077
1,086
1,092
HDFCBANK
1,050
1,055
1,059
1,064
1,068
HDFC
2,836
2,876
2,921
2,961
3,007
HEROMOTOCO
84
86
88
89
91
HINDALCO
836
843
853
860
870
HINDUNILVR
217
219
222
224
226
ICICIBANK
106
108
109
110
112
IDEA
928
932
940
944
951
INDUSINDBK
364
367
369
372
375
INFY
1,153
1,159
1,168
1,175
1,184
ITC
317
319
321
323
324
KOTAKBANK
652
659
665
671
677
LT
1,174
1,183
1,190
1,199
1,206
LUPIN
1,477
1,508
1,532
1,563
1,586
M&M
1,197
1,214
1,227
1,244
1,256
MARUTI
3,386
3,408
3,441
3,464
3,497
NTPC
124
128
130
134
136
ONGC
203
205
207
209
211
POWERGRID
140
140
141
141
142
RELIANCE
1,017
1,027
1,041
1,050
1,064
SBIN
179
181
182
185
186
SUNPHARMA
802
807
812
817
822
TCS
364
368
374
378
384
TATAMTRDVR
273
275
278
280
283
TATAMOTORS
63
65
65
67
67
TATAPOWER
316
319
322
325
328
TATASTEEL
2,398
2,415
2,444
2,462
2,491
TECHM
439
447
453
461
466
ULTRACEMCO
3,093
3,126
3,163
3,196
3,233
WIPRO
544
547
549
552
554
YESBANK
825
837
845
858
866
ZEEL
379
384
388
393
396
4
Technical & Derivatives Report
April 11, 2016
Research Team Tel: 022 - 39357800
For Technical Queries
For Derivatives Queries
DISCLAIMER
Angel Broking Private Limited (hereinafter referred to as “Angel”) is a registered Member of National Stock Exchange of India Limited,
Bombay Stock Exchange Limited and MCX Stock Exchange Limited. It is also registered as a Depository Participant with CDSL and
Portfolio Manager with SEBI. It also has registration with AMFI as a Mutual Fund Distributor. Angel Broking Private Limited is a
registered entity with SEBI for Research Analyst in terms of SEBI (Research Analyst) Regulations, 2014 vide registration number
INH000000164. Angel or its associates has not been debarred/ suspended by SEBI or any other regulatory authority for accessing
/dealing in securities Market. Angel or its associates including its relatives/analyst do not hold any financial interest/beneficial
ownership of more than 1% in the company covered by Analyst. Angel or its associates/analyst has not received any compensation /
managed or co-managed public offering of securities of the company covered by Analyst during the past twelve months. Angel/analyst
has not served as an officer, director or employee of company covered by Analyst and has not been engaged in market making activity
of the company covered by Analyst.
This document is solely for the personal information of the recipient, and must not be singularly used as the basis of any investment
decision. Nothing in this document should be construed as investment or financial advice. Each recipient of this document should
make such investigations as they deem necessary to arrive at an independent evaluation of an investment in the securities of the
companies referred to in this document (including the merits and risks involved), and should consult their own advisors to determine
the merits and risks of such an investment.
Reports based on technical and derivative analysis center on studying charts of a stock's price movement, outstanding positions and
trading volume, as opposed to focusing on a company's fundamentals and, as such, may not match with a report on a company's
fundamentals.
The information in this document has been printed on the basis of publicly available information, internal data and other reliable
sources believed to be true, but we do not represent that it is accurate or complete and it should not be relied on as such, as this
document is for general guidance only. Angel Broking Pvt. Limited or any of its affiliates/ group companies shall not be in any way
responsible for any loss or damage that may arise to any person from any inadvertent error in the information contained in this report.
Angel Broking Pvt. Limited has not independently verified all the information contained within this document. Accordingly, we cannot
testify, nor make any representation or warranty, express or implied, to the accuracy, contents or data contained within this document.
While Angel Broking Pvt. Limited endeavors to update on a reasonable basis the information discussed in this material, there may be
regulatory, compliance, or other reasons that prevent us from doing so.
This document is being supplied to you solely for your information, and its contents, information or data may not be reproduced,
redistributed or passed on, directly or indirectly.
Neither Angel Broking Pvt. Limited, nor its directors, employees or affiliates shall be liable for any loss or damage that may arise from
or in connection with the use of this information.
Note: Please refer to the important ‘Stock Holding Disclosure' report on the Angel website (Research Section). Also, please refer to the
latest update on respective stocks for the disclosure status in respect of those stocks. Angel Broking Pvt. Limited and its affiliates may
have investment positions in the stocks recommended in this report.
5