Technical & Derivatives Report
March 11, 2016
Sensex (24623) / Nifty (7486)
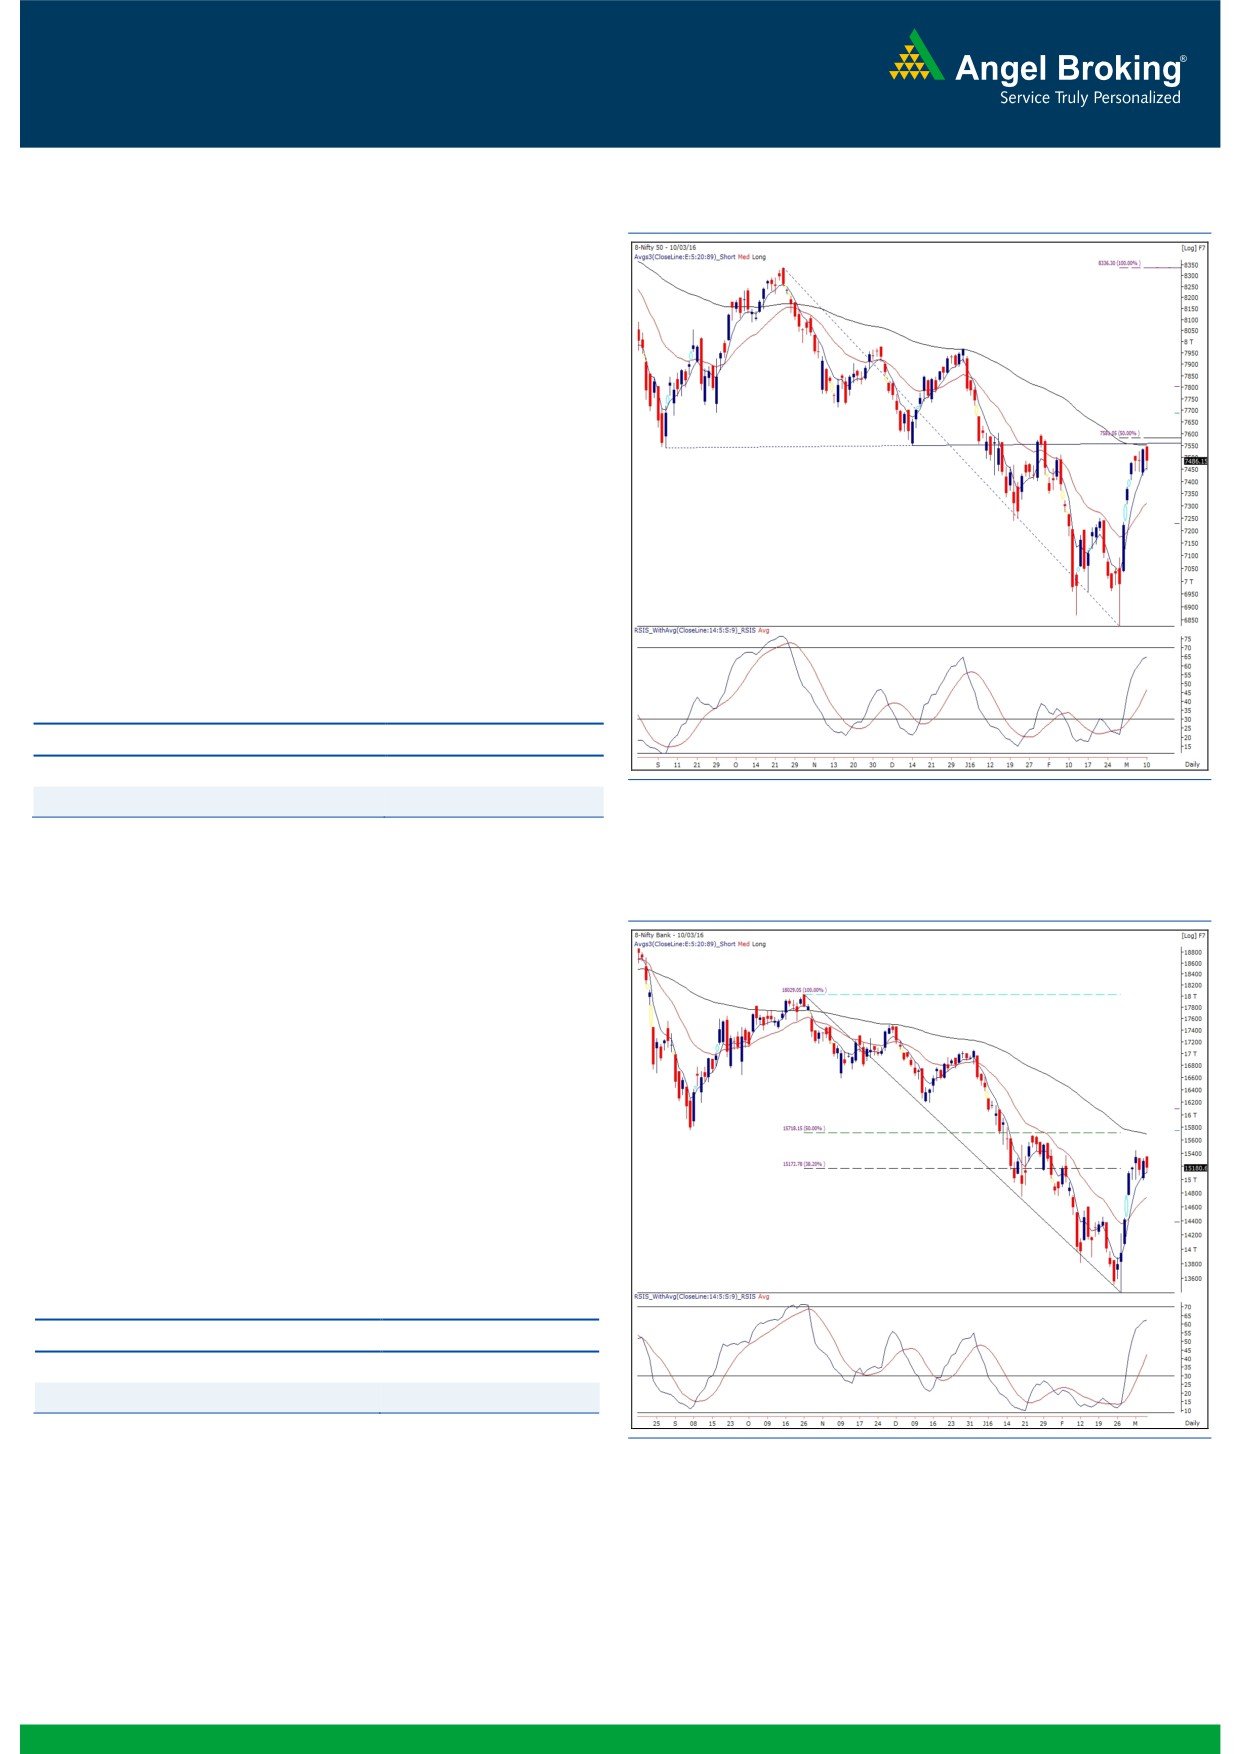
Exhibit 1: Nifty Daily Chart
Yesterday, the Nifty opened with minor upside gap on back of
positive cues from global bourses. But, after the gap up
opening, the Nifty started correcting from first tick and fell by
around 100 points in first half of the session. However, we
witnessed some recovery in the later half and as result, Nifty
closed with the loss of 0.61 percent over its previous close.
From last three sessions, the Nifty is taking resistance of
previous breakdown level, which coincides with the ’89 EMA’
on daily chart. Yesterday, we witnessed some pressure in
index, which may continue in upcoming sessions too. But,
overall chart structure remains positive. Thus, traders are
advised to remain light on positions and focus more on stock
specific moves. Going forward, immediate resistance for the
Nifty is placed at 7550 - 7600 levels; whereas, intraday
support levels are seen at 7424 - 7380 levels.
Key Levels
Support 1 - 7424
Resistance 1 - 7550
Support 2 - 7380
Resistance 2 -
7600
Exhibit 2: Nifty Bank Daily Chart
Nifty Bank Outlook - (15181)
Post the gap up opening, the Nifty Bank index corrected in first
half of the session. However, the banking index traded in a
narrow range in the later half and ended yesterday's session
with losses of 0.64%.
The index has spent last five trading sessions in the narrow
range of 15000 - 15450. The breakout of this trading range
would only lead to short term directional momentum. Traders
with long positions can hence trail their stop loss below the
lower end of the mentioned range. The intraday support for
the index is placed around 15000 and 14765; whereas,
resistances are seen around 15452 and 15710.
Key Levels
Support 1 - 15000
Resistance 1 - 15452
Support 2 - 14765
Resistance 2 - 15710
1
Technical & Derivatives Report
March 11, 2016
Comments
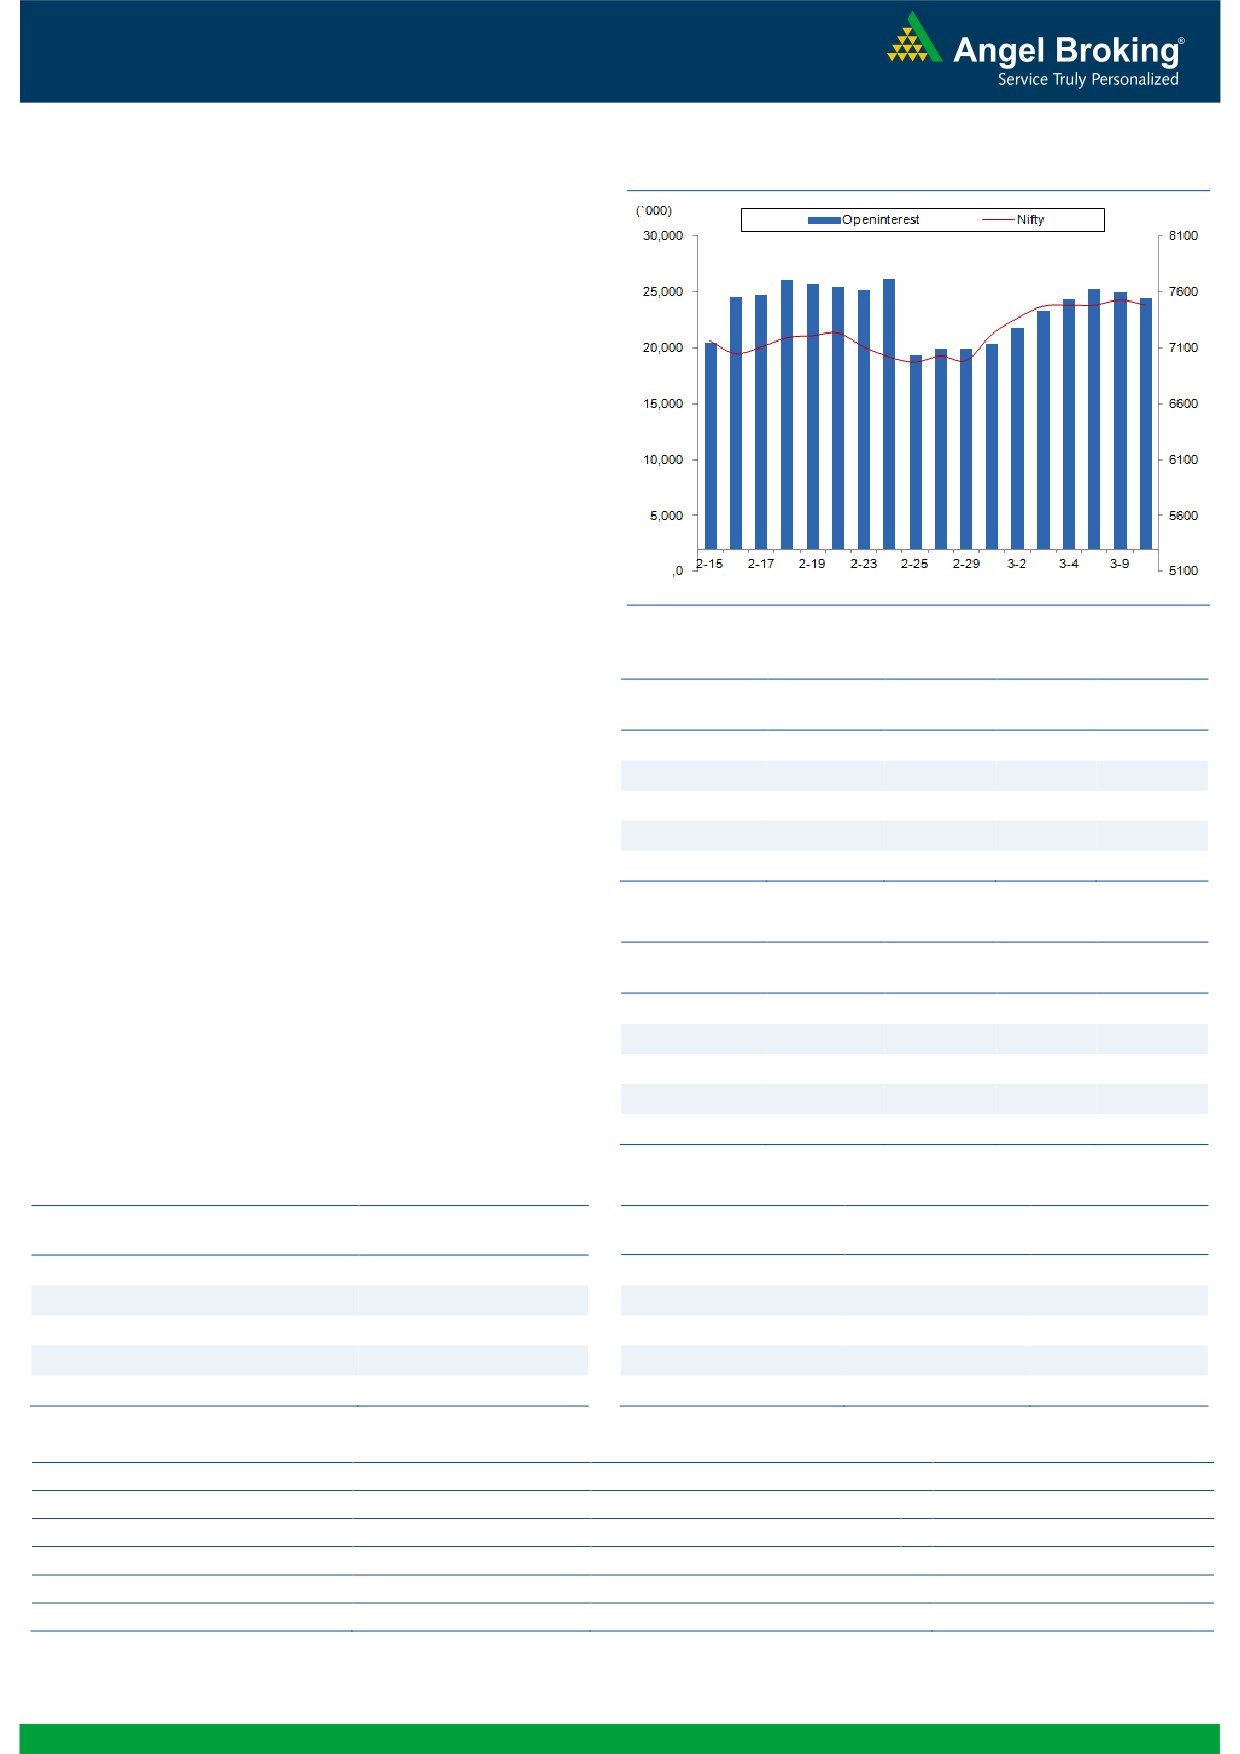
Nifty Vs OI
The Nifty futures open interest has decreased by 2.20%
BankNifty futures open interest has decreased by 0.54%
as market closed at 7486.15 levels.
The Nifty March future closed at a discount of 2.45
points against a premium of 3.25 points. The April series
closed at a premium of 37.60 points.
The Implied Volatility of at the money options has
increased from 15.33% to 15.53%.
The total OI of the market is Rs. 2,22,849/- cr. and the
stock futures OI is Rs. 56,025/- cr.
Few of the liquid counters where we have seen high cost
of carry are GMRINFRA, HDIL, JPASSOCIAT, IFCI and
IDFC.
OI Gainers
Views
OI
PRICE
FIIs continue buying in cash market segment; they
SCRIP
OI
PRICE
CHG. (%)
CHG. (%)
bought to the tune of Rs. 1063 crores. While in Index
CONCOR
1900000
109.71
1162.35
-2.17
Futures, they were marginal sellers with fall in OI,
GRANULES
2465000
52.16
125.50
4.85
suggesting blend of both long unwinding and short
KPIT
1156000
36.32
143.20
0.81
covering in last trading session.
KSCL
1824750
19.21
401.35
0.83
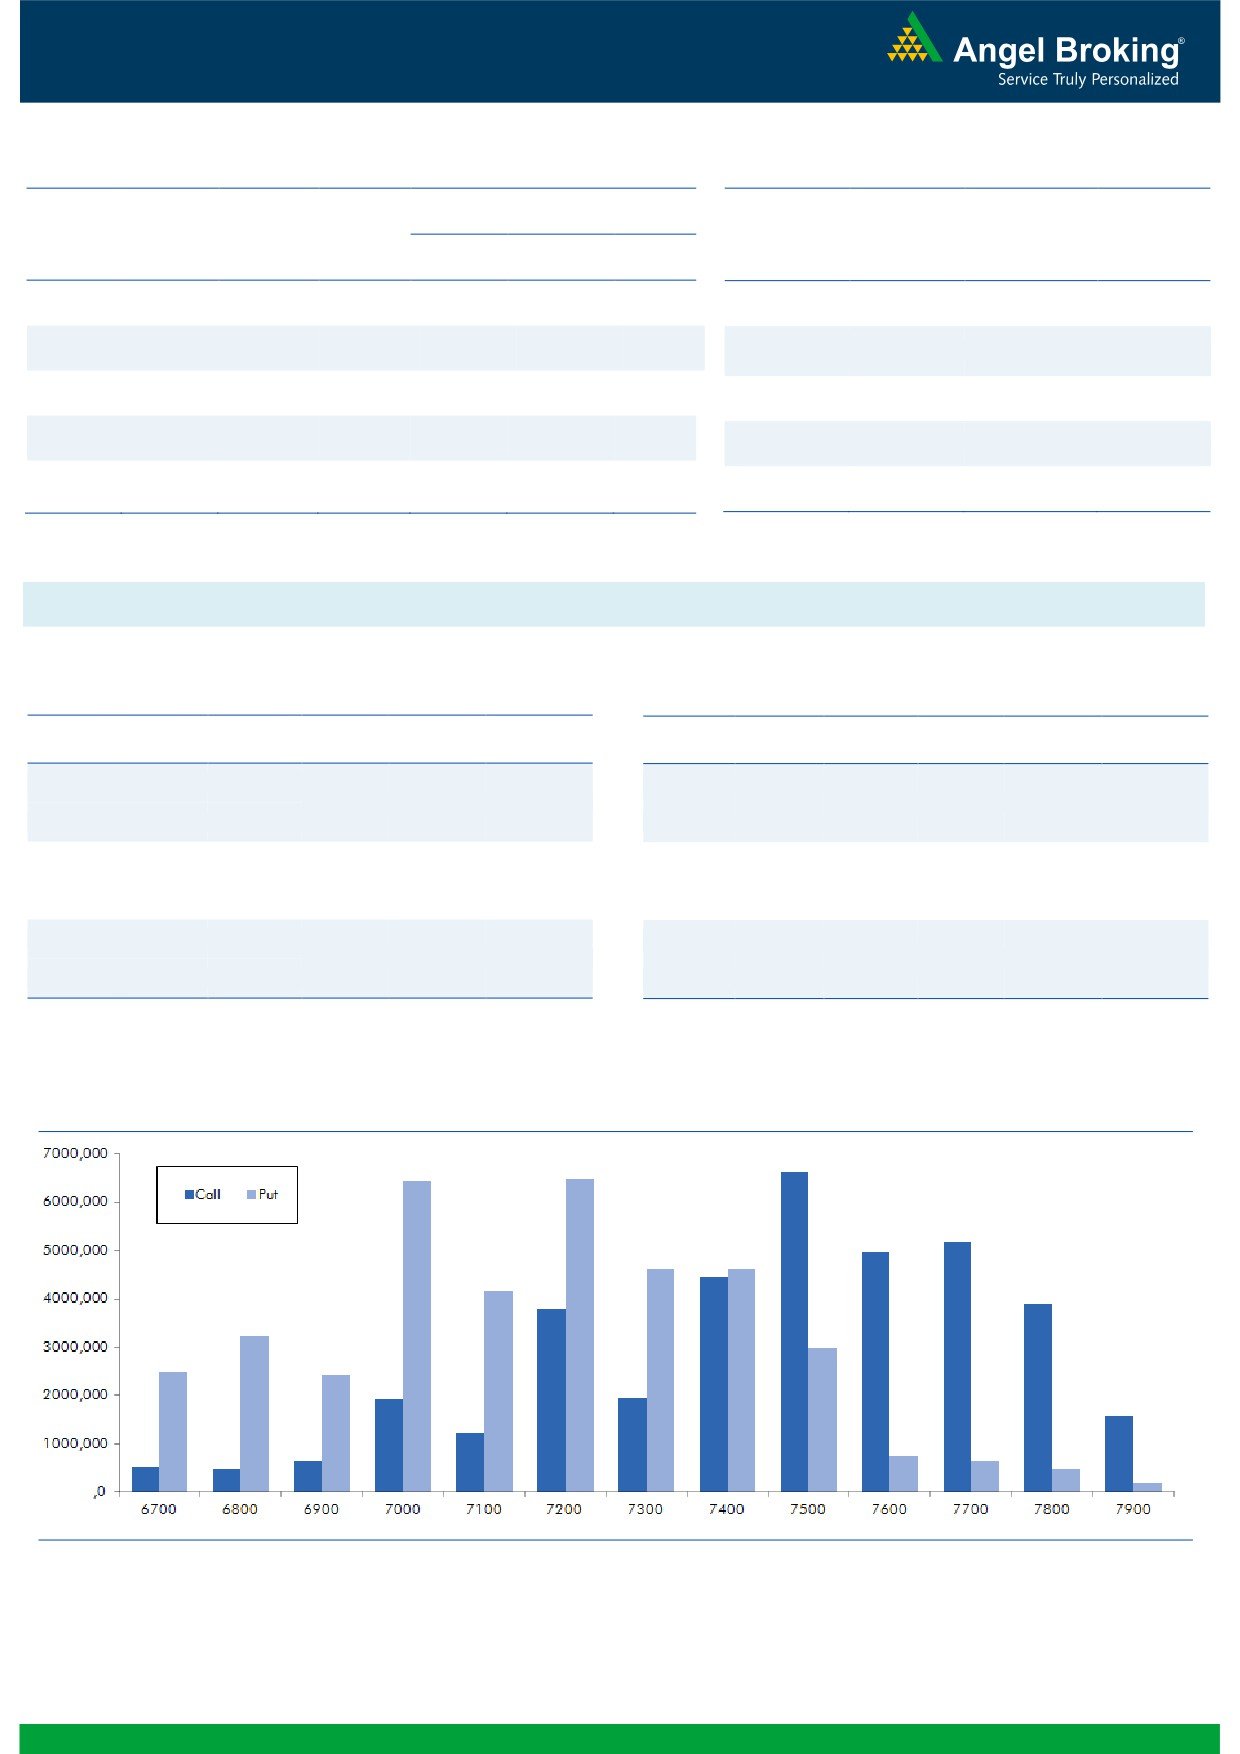
In Index Options front, FIIs bought of worth Rs. 411
OIL
1452000
17.25
309.55
0.24
crores with some rise in OI. Yesterday, the overall activity
in both call and put options was subdued. Maximum OI
OI Losers
in current series is visible in 7500 call and of put options
OI
PRICE
got shifted from 7000 to 7200 put options. Seeing the
SCRIP
OI
PRICE
CHG. (%)
CHG. (%)
quantum of buying in equities & Index Futures from past
TATAELXSI
284400
-14.13
1969.65
-0.18
few trading sessions, we believe Nifty may continue to
JETAIRWAYS
4558500
-8.56
537.50
-1.18
show strength. Large cap counters where we have seen
TATASTEEL
23454000
-6.39
295.15
-0.17
good amount of OI additions are COALINDIA,
ONGC
24008000
-6.26
206.20
1.58
HINDALCO, RELIANCE, BANKBARODA and SBIN.
CADILAHC
3657000
-5.17
341.90
0.10
Historical Volatility
Put-Call Ratio
SCRIP
HV
SCRIP
PCR-OI
PCR-VOL
INFY
35.44
NIFTY
0.97
0.85
COLPAL
26.00
BANKNIFTY
1.03
0.87
RELIANCE
35.59
SBIN
0.72
0.46
ASIANPAINT
30.83
ICICIBANK
0.85
0.71
HDFC
32.32
RELIANCE
0.59
0.56
Strategy Date
Symbol
Strategy
Status
February 29, 2016
RELIANCE
Ratio Bull Call Spread
Active
March 05, 2016
BHEL
Long Call Ladder
Active
2
Technical & Derivatives Report
March 11, 2016
FII Statistics for 10-March 2016
Turnover on 10-March 2016
Open Interest
No. of
Turnover
Change
Detail
Buy
Sell
Net
Instrument
Value
Change
Contracts
( in Cr. )
(%)
Contracts
(in Cr.)
(%)
INDEX
INDEX
1368.76
1397.29
(28.53)
297205
16224.30
(3.94)
302084
15816.69
-3.22
FUTURES
FUTURES
INDEX
INDEX
27952.56
27540.59
411.97
1337971
74127.75
2.74
3170989
175396.17
2.09
OPTIONS
OPTIONS
STOCK
2785.31
3420.85
(635.54)
1053978
47346.64
0.35
STOCK
FUTURES
511214
23801.68
-13.48
FUTURES
STOCK
STOCK
2037.65
2038.45
(0.81)
70419
3182.00
5.61
OPTIONS
264874
12800.01
-6.12
OPTIONS
TOTAL
34144.27
34397.17
(252.90)
2759573
140880.69
1.13
TOTAL
4249161
227814.55
-0.64
Nifty Spot = 7486.15
Lot Size = 75
Bull-Call Spreads
Bear-Put Spreads
Action
Strike
Price
Risk
Reward
BEP
Action
Strike
Price
Risk
Reward
BEP
Buy
7500
105.10
Buy
7400
80.20
43.10
56.90
7543.10
26.65
73.35
7373.35
Sell
7600
62.00
Sell
7300
53.55
Buy
7500
105.10
Buy
7400
80.20
71.85
128.15
7571.85
44.75
155.25
7355.25
Sell
7700
33.25
Sell
7200
35.45
Buy
7600
62.00
Buy
7300
53.55
28.75
71.25
7628.75
18.10
81.90
7281.90
Sell
7700
33.25
Sell
7200
35.45
Note: Above mentioned Bullish or Bearish Spreads in Nifty (March Series) are given as an information and not as a recommendation.
Nifty Put-Call Analysis
3
Technical & Derivatives Report
March 11, 2016
Daily Pivot Levels for Nifty 50 Stocks
Scrips
S2
S1
PIVOT
R1
R2
ACC
1,212
1,221
1,235
1,245
1,259
ADANIPORTS
222
224
226
229
231
AMBUJACEM
198
200
202
204
206
ASIANPAINT
861
878
887
904
913
AXISBANK
405
409
415
418
424
BAJAJ-AUTO
2,285
2,305
2,325
2,345
2,365
BANKBARODA
135
137
141
143
147
BHARTIARTL
328
332
335
340
343
BHEL
101
103
105
107
109
BOSCHLTD
17,477
17,678
17,902
18,103
18,327
BPCL
777
785
797
806
818
CAIRN
137
139
141
143
145
CIPLA
525
529
535
539
545
COALINDIA
317
319
323
325
329
DRREDDY
3,118
3,151
3,193
3,227
3,269
GAIL
332
337
345
350
358
GRASIM
3,533
3,567
3,616
3,650
3,699
HCLTECH
799
809
816
825
832
HDFC
1,112
1,132
1,145
1,165
1,178
HDFCBANK
1,003
1,012
1,019
1,028
1,035
HEROMOTOCO
2,771
2,792
2,821
2,842
2,871
HINDALCO
80
82
84
86
88
HINDUNILVR
824
831
836
843
848
ICICIBANK
212
214
216
218
221
IDEA
102
103
105
106
108
INDUSINDBK
911
919
927
935
943
INFY
1,125
1,134
1,148
1,157
1,172
ITC
308
312
317
321
326
KOTAKBANK
640
647
659
666
677
LT
1,156
1,171
1,196
1,211
1,237
LUPIN
1,782
1,802
1,817
1,836
1,851
M&M
1,205
1,216
1,232
1,242
1,258
MARUTI
3,550
3,589
3,612
3,650
3,673
NTPC
125
126
127
128
129
ONGC
202
204
206
208
211
PNB
79
81
82
83
85
POWERGRID
137
138
140
141
142
RELIANCE
985
999
1,022
1,035
1,059
SBIN
176
178
182
184
187
VEDL
85
87
89
90
93
SUNPHARMA
838
852
860
873
881
TATAMOTORS
336
342
348
354
360
TATAPOWER
58
59
59
59
60
TATASTEEL
289
293
297
301
305
TCS
2,296
2,322
2,341
2,367
2,386
TECHM
459
463
468
472
477
ULTRACEMCO
2,963
2,981
3,000
3,018
3,037
WIPRO
529
532
536
540
543
YESBANK
776
784
792
800
809
ZEEL
385
388
393
396
400
4
Technical & Derivatives Report
March 11, 2016
Research Team Tel: 022 - 39357800
For Technical Queries
For Derivatives Queries
DISCLAIMER
Angel Broking Private Limited (hereinafter referred to as “Angel”) is a registered Member of National Stock Exchange of India Limited,
Bombay Stock Exchange Limited and MCX Stock Exchange Limited. It is also registered as a Depository Participant with CDSL and
Portfolio Manager with SEBI. It also has registration with AMFI as a Mutual Fund Distributor. Angel Broking Private Limited is a
registered entity with SEBI for Research Analyst in terms of SEBI (Research Analyst) Regulations, 2014 vide registration number
INH000000164. Angel or its associates has not been debarred/ suspended by SEBI or any other regulatory authority for accessing
/dealing in securities Market. Angel or its associates including its relatives/analyst do not hold any financial interest/beneficial
ownership of more than 1% in the company covered by Analyst. Angel or its associates/analyst has not received any compensation /
managed or co-managed public offering of securities of the company covered by Analyst during the past twelve months. Angel/analyst
has not served as an officer, director or employee of company covered by Analyst and has not been engaged in market making activity
of the company covered by Analyst.
This document is solely for the personal information of the recipient, and must not be singularly used as the basis of any investment
decision. Nothing in this document should be construed as investment or financial advice. Each recipient of this document should
make such investigations as they deem necessary to arrive at an independent evaluation of an investment in the securities of the
companies referred to in this document (including the merits and risks involved), and should consult their own advisors to determine
the merits and risks of such an investment.
Reports based on technical and derivative analysis center on studying charts of a stock's price movement, outstanding positions and
trading volume, as opposed to focusing on a company's fundamentals and, as such, may not match with a report on a company's
fundamentals.
The information in this document has been printed on the basis of publicly available information, internal data and other reliable
sources believed to be true, but we do not represent that it is accurate or complete and it should not be relied on as such, as this
document is for general guidance only. Angel Broking Pvt. Limited or any of its affiliates/ group companies shall not be in any way
responsible for any loss or damage that may arise to any person from any inadvertent error in the information contained in this report.
Angel Broking Pvt. Limited has not independently verified all the information contained within this document. Accordingly, we cannot
testify, nor make any representation or warranty, express or implied, to the accuracy, contents or data contained within this document.
While Angel Broking Pvt. Limited endeavors to update on a reasonable basis the information discussed in this material, there may be
regulatory, compliance, or other reasons that prevent us from doing so.
This document is being supplied to you solely for your information, and its contents, information or data may not be reproduced,
redistributed or passed on, directly or indirectly.
Neither Angel Broking Pvt. Limited, nor its directors, employees or affiliates shall be liable for any loss or damage that may arise from
or in connection with the use of this information.
Note: Please refer to the important ‘Stock Holding Disclosure' report on the Angel website (Research Section). Also, please refer to the
latest update on respective stocks for the disclosure status in respect of those stocks. Angel Broking Pvt. Limited and its affiliates may
have investment positions in the stocks recommended in this report.
5