Technical & Derivatives Report
February 11, 2016
Sensex (23759) / Nifty (7216)
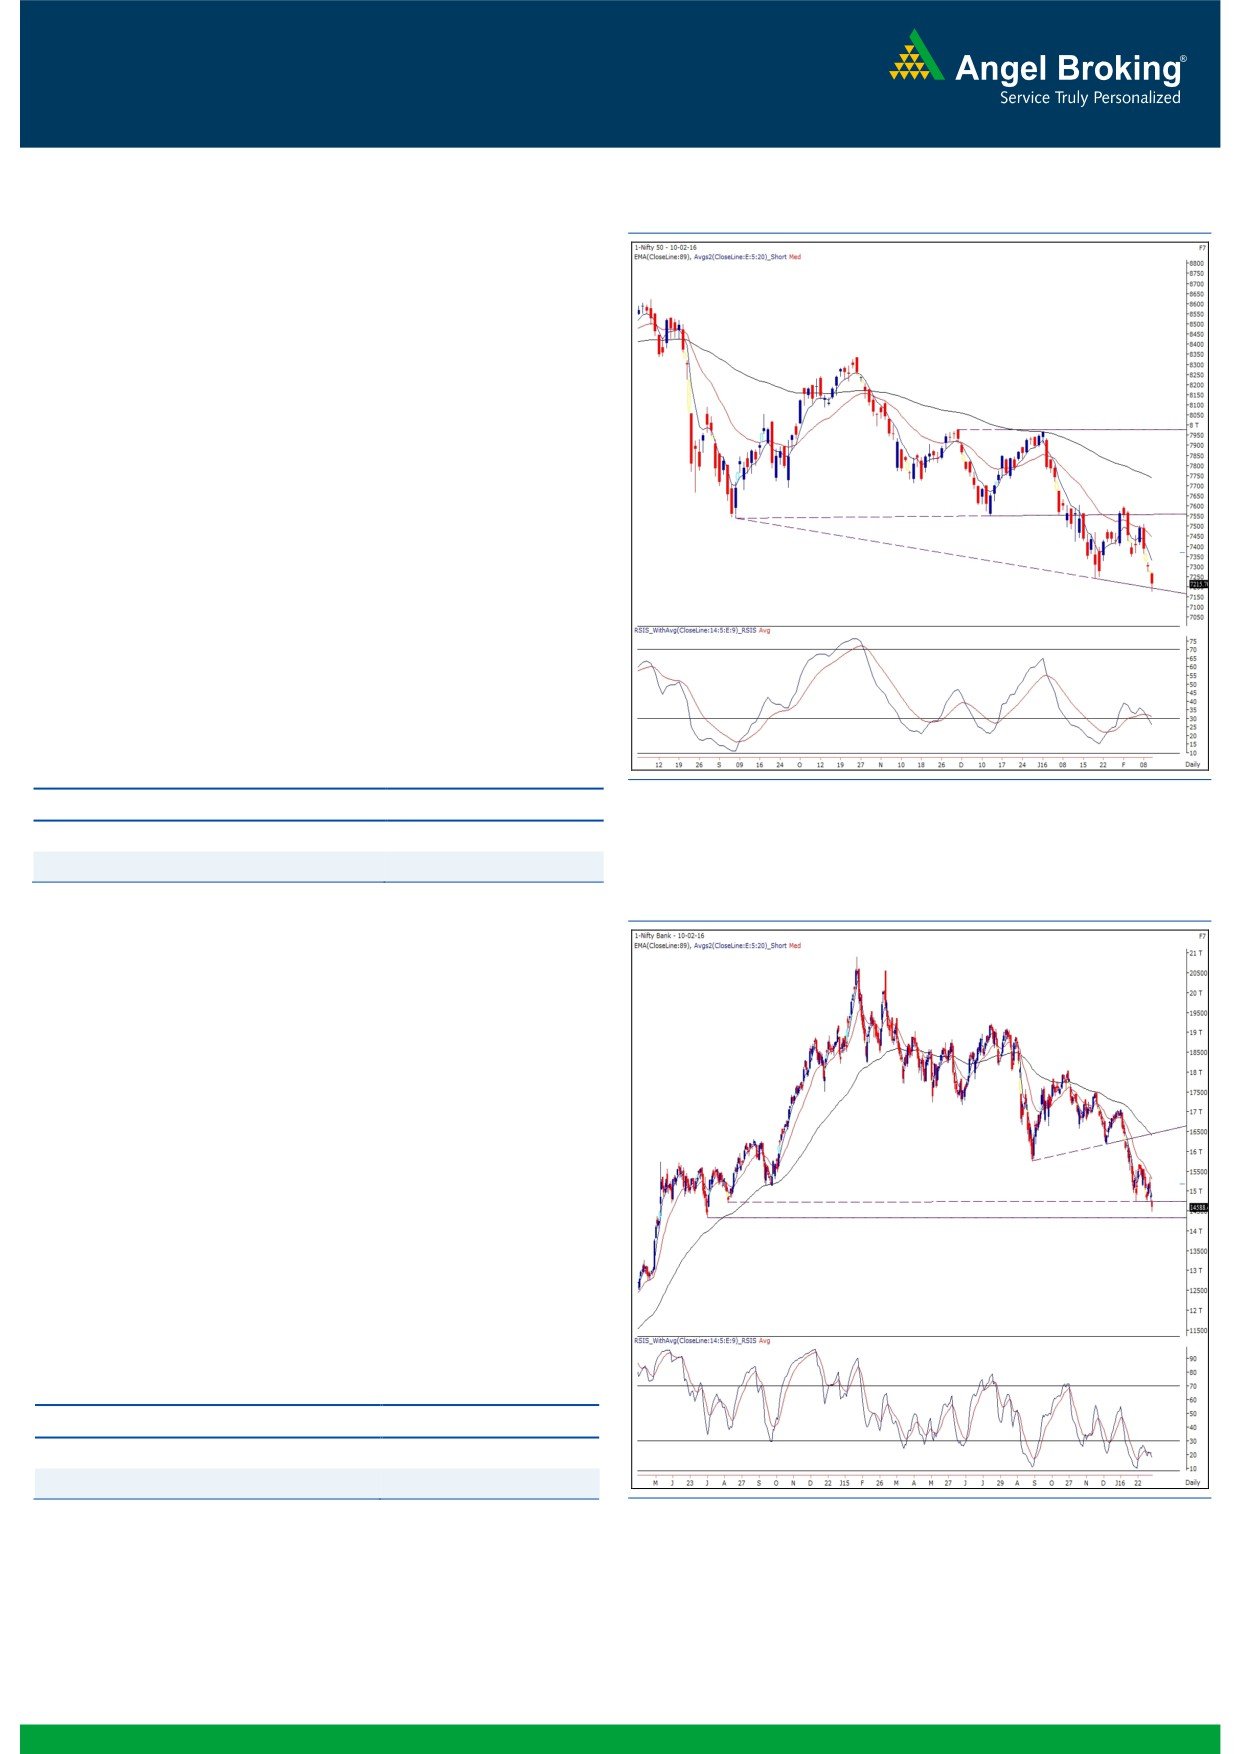
Exhibit 1: Nifty Daily Chart
For the second consecutive session, our markets opened with a
downside gap and the weakness aggravated as the day
progressed and in the process, the Nifty even slipped below the
7200 mark (on an intraday basis) for the first time after May 30,
2014. The Nifty ended the session with a cut of 1.13%.
Honestly speaking, last couple of day’s price action was
unexpected for us; but, with reference to some of our earlier
reports, we have been mentioning about limited correction even if
Nifty breaks the 7240 mark. There are few key evidences that are
converging first at 7190 and in extreme bearish scenario at 7120.
One of the important evidence is the ‘Positive Divergence’ in daily
‘RSI’; indicating exhaustion in prior trend. We are slightly
repetitive in saying this but we maintain our view that traders
should refrain from shorting and rather look for potential
opportunities to go long in the market. For the coming session,
the support remains at 7190 and then at 7120; whereas, the
immediate resistance would be seen at 7272. A sustainable
movement beyond this point would lead to some strong bounce.
Key Levels
Support 1 - 7190
Resistance 1 - 7272
Support 2 - 7120
Resistance 2 -
7325
Exhibit 2: Bank Nifty Daily Chart
Bank Nifty Outlook - (14588)
Yesterday, the Nifty Bank index opened below its crucial
support of 14750, with a cut of 135 points and started moving
lower from the initial trades. The bearish momentum in
banking counters specially the mounting concern in PSU
banking space continued in yesterdays’ session too and as a
result, the banking index made a new ‘52 - week’ low of
14490.20. However, after a minor pull-back, the Nifty Bank
index ended the session with a loss of 1.93 percent over its
previous close. Going forward, previous support zone of
14750 - 14770 would now act as a strong resistance for Nifty
Bank index and it would be very important for the index to
give a sustainable move above these levels in order to gain
some strength. On the flipside, immediate support for the
index is placed 14370 and 14230 levels.
Key Levels
Support 1 - 14370
Resistance 1 - 14770
Support 2 - 14230
Resistance 2 - 14950
1
Technical & Derivatives Report
February 11, 2016
Comments
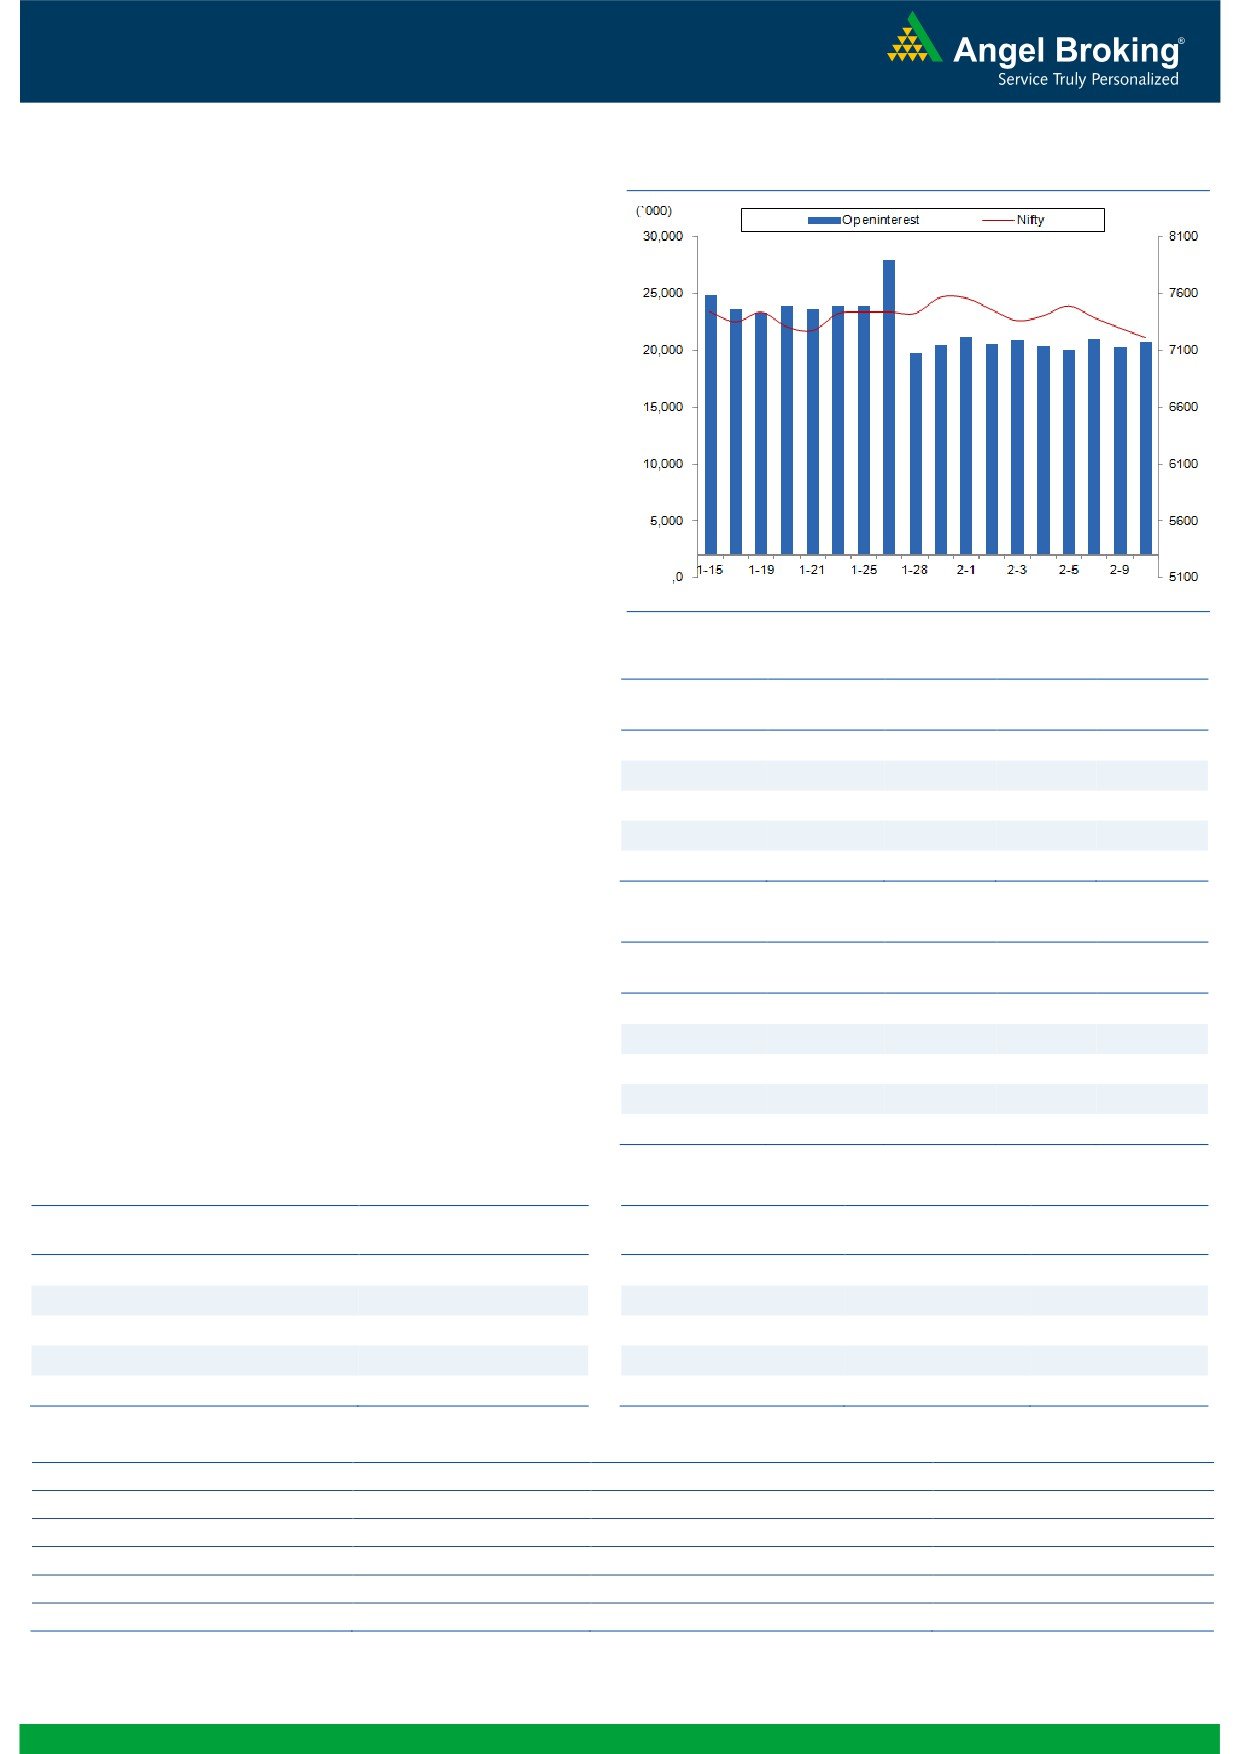
Nifty Vs OI
The Nifty futures open interest has increased by 2.46%
BankNifty futures open interest has increased by 9.89%
as market closed at 7215.70 levels.
The Nifty February future closed at a premium of 30.85
points against a premium of 26.85 points. The March
series closed at a premium of 48.70 points.
The Implied Volatility of at the money options has
increased from 19.91% to 21.15%.
The total OI of the market is Rs. 2,27,222/- cr. and the
stock futures OI is Rs. 59,552/- cr.
Few of the liquid counters where we have seen high cost
of carry are KTKBANK, IDFC, JISLJALEQS, VEDL and
NCC.
Views
FIIs were net sellers in cash market segment to the tune
OI Gainers
of Rs. 751 crores. While in Index Futures, they sold of Rs.
OI
PRICE
417 crores with rise in open interest indicating fresh short
SCRIP
OI
PRICE
CHG. (%)
CHG. (%)
formation in last trading session.
NHPC
48168000
51.44
20.45
-0.24
In Index Options front, they bought of Rs. 407 crores with
PNB
47440000
30.42
77.75
-10.48
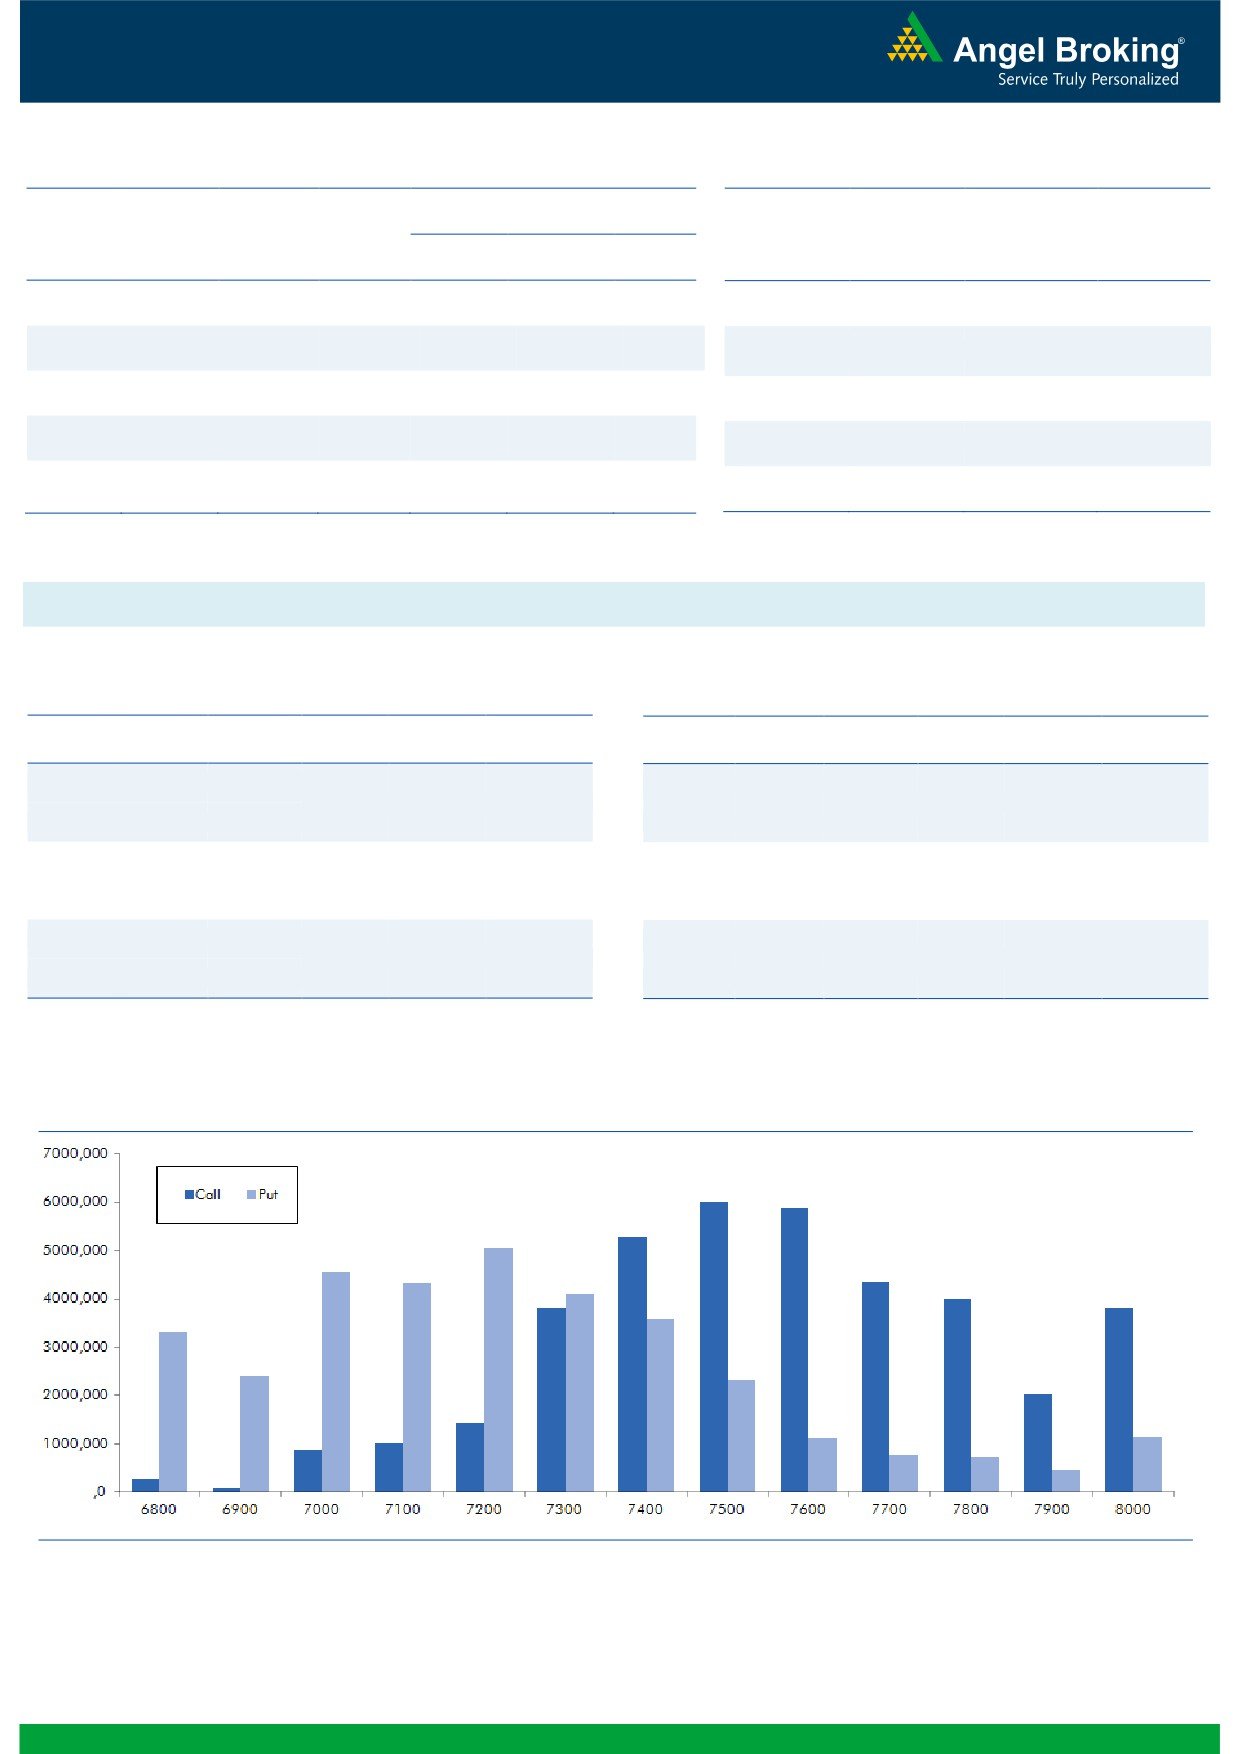
good amount of rise in OI. In call options, 7300-7500
IOB
16002000
20.06
22.85
-6.73
strikes added good amount of build-up, which may be
TATAMOTORS
36219000
14.75
292.45
-6.34
long formation. While in put options, 6900 & 7000
ALBK
12270000
13.99
46.10
-9.87
strikes added decent OI, followed by unwinding in 7400
strike. Maximum OI in current series is now visible in
OI Losers
7500 call and
7200 put options. In yesterday’s
OI
PRICE
correction, we saw FIIs shorting in Index Future and even
SCRIP
OI
PRICE
CHG. (%)
CHG. (%)
in Stock Future. We believe market may continue to
PIDILITIND
669000
-9.72
588.15
1.54
remain under pressure, we would suggest trading light
RELINFRA
10312900
-8.66
441.90
4.03
as of now.
HAVELLS
4610000
-7.06
285.75
-1.97
TORNTPHARM
534400
-6.44
1303.70
-0.82
LUPIN
3785100
-5.91
1863.05
-2.25
Historical Volatility
Put-Call Ratio
SCRIP
HV
SCRIP
PCR-OI
PCR-VOL
APOLLOTYRE
61.32
NIFTY
0.82
0.75
ALBK
73.24
BANKNIFTY
0.70
0.64
PNB
78.93
SBIN
0.56
0.76
UCOBANK
62.70
MARUTI
0.41
0.40
ANDHRABANK
57.69
ICICIBANK
0.52
0.56
Strategy Date
Symbol
Strategy
Status
February 01, 2016
BHEL
Bull Call Spread
Active
February 08, 2016
NIFTY
Short Strangle
Active
2
Technical & Derivatives Report
February 11, 2016
FII Statistics for 10-February 2016
Turnover on 10-February 2016
Open Interest
No. of
Turnover
Change
Detail
Buy
Sell
Net
Instrument
Value
Change
Contracts
( in Cr. )
(%)
Contracts
(in Cr.)
(%)
INDEX
INDEX
2716.90
3134.48
(417.58)
227035
11749.95
4.21
405466
20534.18
28.00
FUTURES
FUTURES
INDEX
INDEX
41377.78
40970.52
407.26
1275931
68056.24
4.48
4053260
219191.60
16.18
OPTIONS
OPTIONS
STOCK
3933.79
5202.52
(1268.73)
1141885
49026.79
1.15
STOCK
FUTURES
649400
28092.90
3.79
FUTURES
STOCK
STOCK
2738.05
2744.59
(6.54)
64016
2733.01
3.99
OPTIONS
385027
17116.81
6.37
OPTIONS
TOTAL
50766.53
52052.12
(1285.59)
2708867
131566.00
3.01
TOTAL
5493153
284935.48
14.95
Nifty Spot = 7215.70
Lot Size = 75
Bull-Call Spreads
Bear-Put Spreads
Action
Strike
Price
Risk
Reward
BEP
Action
Strike
Price
Risk
Reward
BEP
Buy
7300
92.95
Buy
7200
102.15
36.80
63.20
7336.80
32.95
67.05
7167.05
Sell
7400
56.15
Sell
7100
69.20
Buy
7300
92.95
Buy
7200
102.15
62.20
137.80
7362.20
55.60
144.40
7144.40
Sell
7500
30.75
Sell
7000
46.55
Buy
7400
56.15
Buy
7100
69.20
25.40
74.60
7425.40
22.65
77.35
7077.35
Sell
7500
30.75
Sell
7000
46.55
Note: Above mentioned Bullish or Bearish Spreads in Nifty (Feb. Series) are given as an information and not as a recommendation.
Nifty Put-Call Analysis
3
Technical & Derivatives Report
February 11, 2016
Daily Pivot Levels for Nifty 50 Stocks
Scrips
S2
S1
PIVOT
R1
R2
ACC
1,237
1,251
1,265
1,279
1,293
ADANIPORTS
192
198
204
209
215
AMBUJACEM
189
192
195
198
201
ASIANPAINT
855
866
877
888
900
AXISBANK
380
387
392
399
405
BAJAJ-AUTO
2,320
2,344
2,366
2,390
2,412
BANKBARODA
110
114
119
122
127
BHARTIARTL
305
308
312
315
318
BHEL
124
126
129
131
133
BOSCHLTD
16,084
16,234
16,320
16,470
16,556
BPCL
802
820
831
849
860
CAIRN
112
115
119
121
126
CIPLA
519
529
544
554
569
COALINDIA
297
305
311
319
325
DRREDDY
2,770
2,827
2,883
2,940
2,995
GAIL
333
339
344
351
356
GRASIM
3,346
3,386
3,415
3,455
3,484
HCLTECH
797
812
823
838
848
HDFC
1,082
1,099
1,128
1,145
1,174
HDFCBANK
998
1,005
1,018
1,025
1,038
HEROMOTOCO
2,526
2,541
2,560
2,574
2,593
HINDALCO
62
64
67
70
73
HINDUNILVR
814
819
826
831
838
ICICIBANK
199
203
206
211
214
IDEA
93
97
101
104
108
INDUSINDBK
804
820
843
859
883
INFY
1,091
1,100
1,114
1,122
1,136
ITC
304
306
310
312
316
KOTAKBANK
651
659
669
678
688
LT
1,091
1,106
1,118
1,133
1,145
LUPIN
1,804
1,829
1,867
1,891
1,929
M&M
1,141
1,162
1,182
1,202
1,222
MARUTI
3,548
3,613
3,666
3,731
3,784
NTPC
122
124
125
126
127
ONGC
208
211
213
216
219
PNB
74
77
82
85
89
POWERGRID
139
141
143
145
147
RELIANCE
937
950
961
974
986
SBIN
153
156
161
164
169
VEDL
63
65
67
69
71
SUNPHARMA
826
841
853
868
881
TATAMOTORS
275
283
297
305
318
TATAPOWER
57
58
59
60
61
TATASTEEL
223
229
234
240
244
TCS
2,240
2,255
2,272
2,286
2,304
TECHM
431
435
442
447
453
ULTRACEMCO
2,729
2,763
2,793
2,827
2,856
WIPRO
523
527
532
536
541
YESBANK
717
726
737
746
756
ZEEL
368
374
382
387
395
4
Technical & Derivatives Report
February 11, 2016
Research Team Tel: 022 - 39357800
For Technical Queries
For Derivatives Queries
DISCLAIMER
Angel Broking Private Limited (hereinafter referred to as “Angel”) is a registered Member of National Stock Exchange of India Limited,
Bombay Stock Exchange Limited and MCX Stock Exchange Limited. It is also registered as a Depository Participant with CDSL and
Portfolio Manager with SEBI. It also has registration with AMFI as a Mutual Fund Distributor. Angel Broking Private Limited is a
registered entity with SEBI for Research Analyst in terms of SEBI (Research Analyst) Regulations, 2014 vide registration number
INH000000164. Angel or its associates has not been debarred/ suspended by SEBI or any other regulatory authority for accessing
/dealing in securities Market. Angel or its associates including its relatives/analyst do not hold any financial interest/beneficial
ownership of more than 1% in the company covered by Analyst. Angel or its associates/analyst has not received any compensation /
managed or co-managed public offering of securities of the company covered by Analyst during the past twelve months. Angel/analyst
has not served as an officer, director or employee of company covered by Analyst and has not been engaged in market making activity
of the company covered by Analyst.
This document is solely for the personal information of the recipient, and must not be singularly used as the basis of any investment
decision. Nothing in this document should be construed as investment or financial advice. Each recipient of this document should
make such investigations as they deem necessary to arrive at an independent evaluation of an investment in the securities of the
companies referred to in this document (including the merits and risks involved), and should consult their own advisors to determine
the merits and risks of such an investment.
Reports based on technical and derivative analysis center on studying charts of a stock's price movement, outstanding positions and
trading volume, as opposed to focusing on a company's fundamentals and, as such, may not match with a report on a company's
fundamentals.
The information in this document has been printed on the basis of publicly available information, internal data and other reliable
sources believed to be true, but we do not represent that it is accurate or complete and it should not be relied on as such, as this
document is for general guidance only. Angel Broking Pvt. Limited or any of its affiliates/ group companies shall not be in any way
responsible for any loss or damage that may arise to any person from any inadvertent error in the information contained in this report.
Angel Broking Pvt. Limited has not independently verified all the information contained within this document. Accordingly, we cannot
testify, nor make any representation or warranty, express or implied, to the accuracy, contents or data contained within this document.
While Angel Broking Pvt. Limited endeavors to update on a reasonable basis the information discussed in this material, there may be
regulatory, compliance, or other reasons that prevent us from doing so.
This document is being supplied to you solely for your information, and its contents, information or data may not be reproduced,
redistributed or passed on, directly or indirectly.
Neither Angel Broking Pvt. Limited, nor its directors, employees or affiliates shall be liable for any loss or damage that may arise from
or in connection with the use of this information.
Note: Please refer to the important ‘Stock Holding Disclosure' report on the Angel website (Research Section). Also, please refer to the
latest update on respective stocks for the disclosure status in respect of those stocks. Angel Broking Pvt. Limited and its affiliates may
have investment positions in the stocks recommended in this report.
5