Technical & Derivatives Report
December 10, 2015
Sensex (25036) / Nifty (7612)
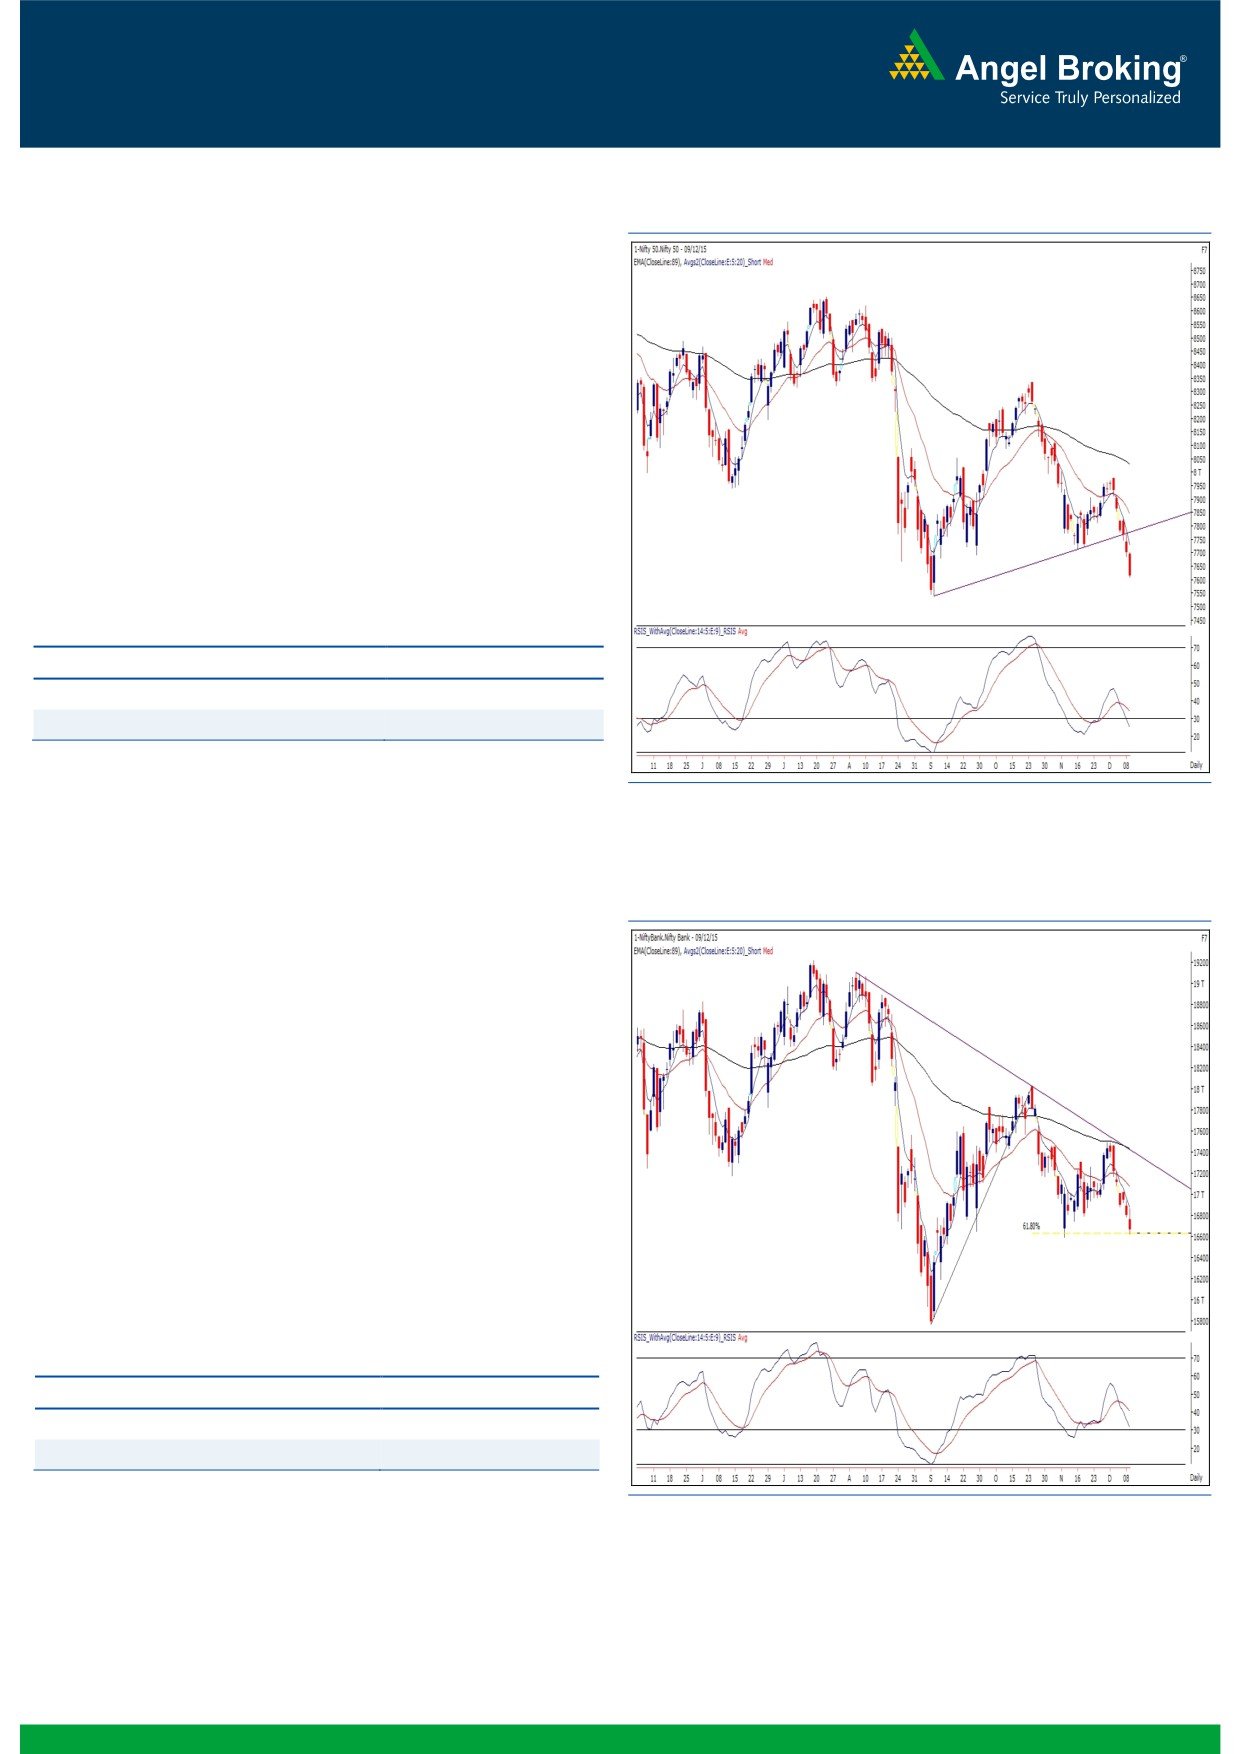
Exhibit 1: Nifty Daily Chart
Yesterday’s session too opened slightly lower in line with weak
global cues. Subsequently, the index kept on descended as the
day progressed and as a result, eventually ended the session
with more than a percent cut.
As mentioned in our previous report, the Nifty corrected
towards 7620 after falling below Tuesday’s low of
7771.
Going forward, if the Nifty sustains below the 7600 mark for
an hour, we may witness a continuation of this corrective move
towards 7540 levels. On the flipside, if Nifty manages to hold
the 7600 mark then the possibility of an intraday bounce
towards 7660 - 7700 levels. Traders are advised to stay light
on positions as the market is lacking a clear direction.
Key Levels
Support 1 - 7600
Resistance 1 - 7660
Support 2 - 7540
Resistance 2 - 7700
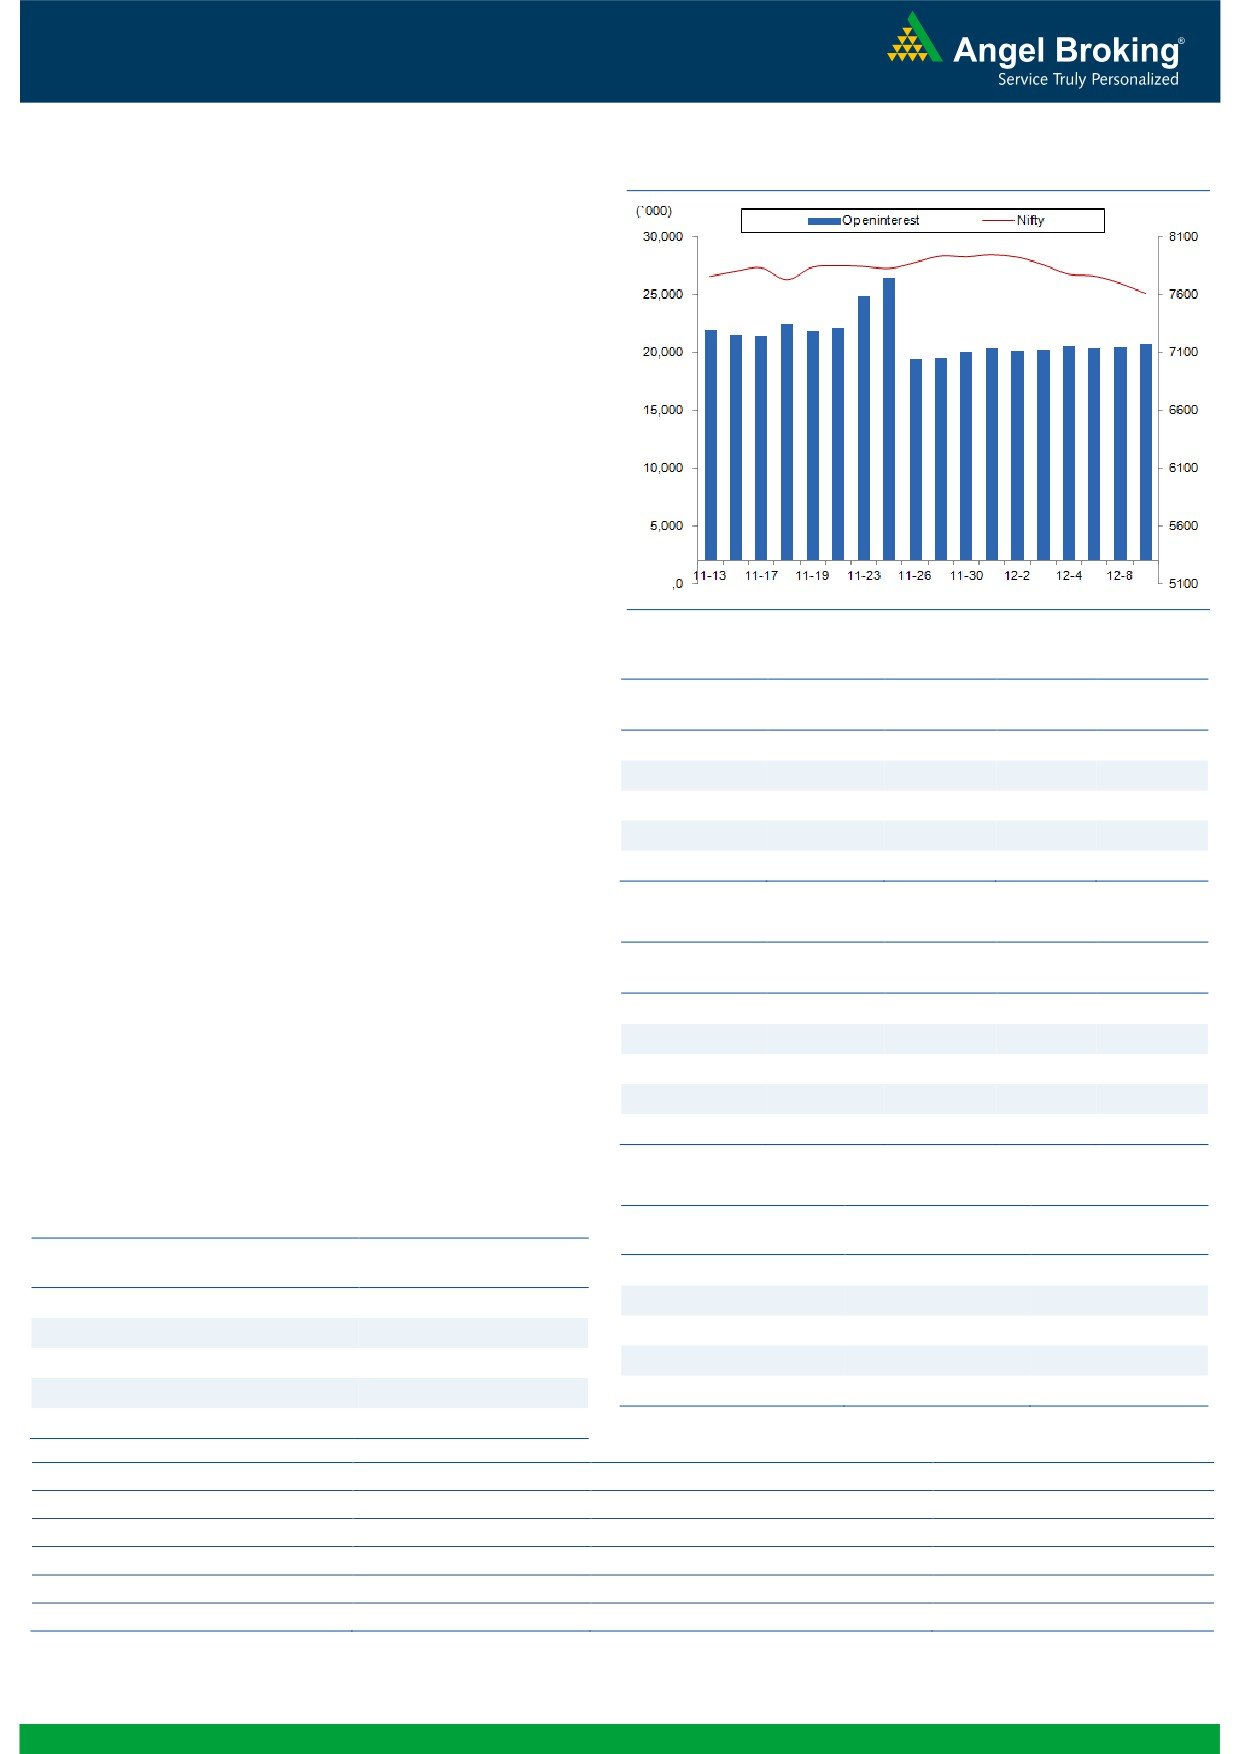
Exhibit 2: Bank Nifty Daily Chart
Bank Nifty Outlook - (16661)
Yesterday, the Bank Nifty opened with a loss of around 40
points and started moving higher in the initial trades. But, the
positive momentum was short lived as we witnessed a strong
selling pressure at higher levels. The banking index continued
to fall towards its next support of ‘Weekly 89 EMA’ and
eventually ended the session with a loss of 0.84 percent. At
current juncture, the Bank Nifty is hovering around the ‘Weekly
89 EMA’, which also coincides with the 61.80% retracement
level of the entire rally from 15762.20 to 18029.05. Going
forward, we may see further decline in the Bank Nifty only if it
sustains below 16580 levels. The intraday support for the
Bank Nifty is placed at 16580 and 16400 levels. On the
flipside, 16860 and 16950 would now act as strong resistance
levels.
Key Levels
Support 1 - 16580
Resistance 1 - 16860
Support 2 - 16400
Resistance 2 - 16950
1
Technical & Derivatives Report
December 10, 2015
Comments
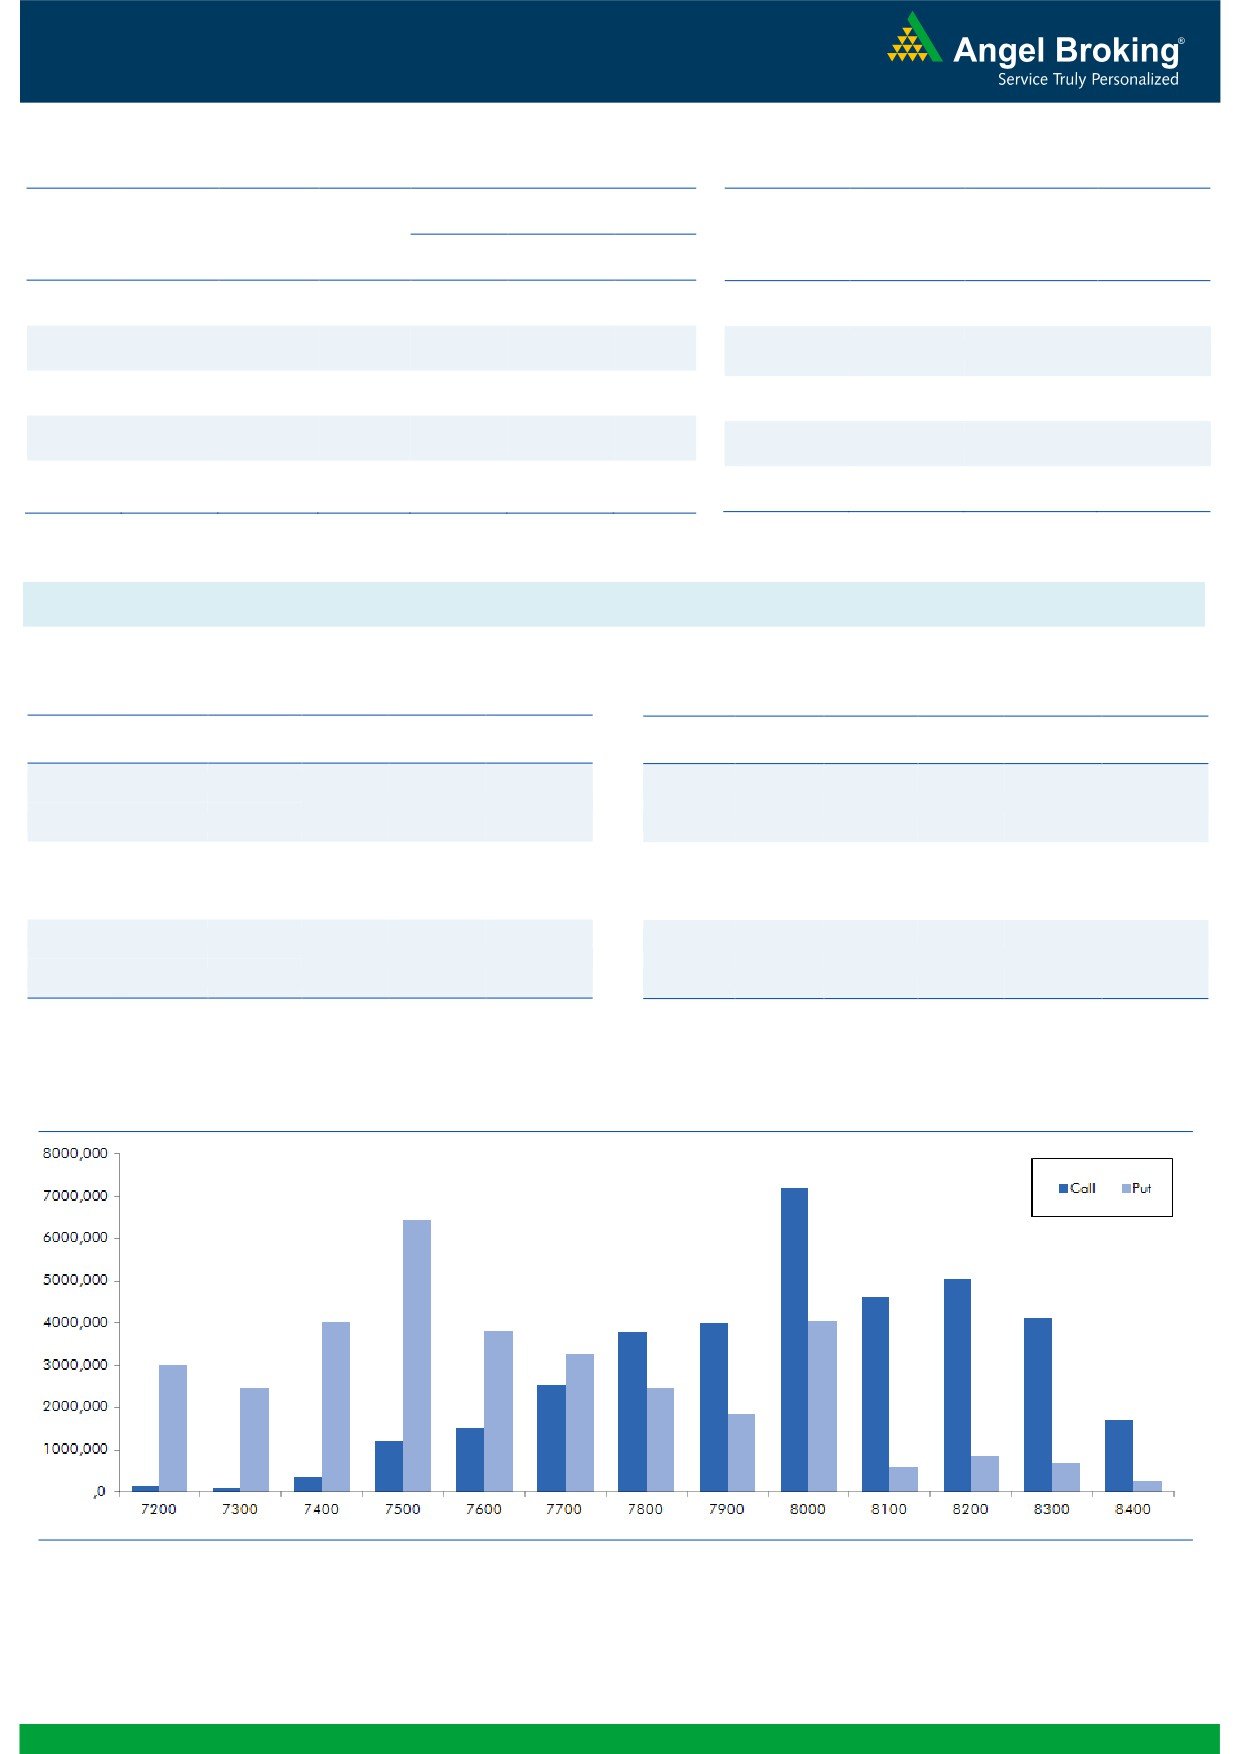
Nifty Vs OI
The Nifty futures open interest has increased by 1.79%
BankNifty futures open interest has increased by 9.62%
as market closed at 7612.50 levels.
The Nifty December future closed at a premium of 31.85
points against a premium of 26.90 points. The January
series closed at a premium of 69.15 points.
The Implied Volatility of at the money options has
decreased from 14.73% to 15.19%.
The total OI of the market is Rs. 2,20,554/- cr. and the
stock futures OI is Rs. 62,280/- cr.
Few of the liquid counters where we have seen high cost
of carry are SRF, UNITECH, GMRINFRA, IDFC and
ADANIPORTS.
Views
OI Gainers
FIIs were net sellers in both Equity Cash and Index Future
OI
PRICE
SCRIP
OI
PRICE
segment. In Equity Cash, they were net seller to the tune
CHG. (%)
CHG. (%)
of Rs. 527 crores. While in Index Futures they continue to
BHARATFORG
5578500
14.13
791.75
-4.10
sell of worth Rs. 123 crores with good amount of rise in
STAR
2043600
12.26
1389.10
0.93
open interest, indicating blend of long and short build-up
KSCL
1731750
11.87
374.60
-3.85
in last trading session.
BATAINDIA
4255000
10.81
460.00
-3.85
In Index Options front, FIIs bought
marginally with
MCLEODRUSS
2807200
7.95
173.85
-2.80
significant rise in OI. In Call options, we saw good
amount of build-up in 7600-7800 strikes which may be
OI Losers
longs. While, in Put options, 7500 strike added fresh OI.
OI
PRICE
SCRIP
OI
PRICE
Maximum OI still remains in 8000 call and 7500 put
CHG. (%)
CHG. (%)
options. We believe that the Nifty is trading around the
TCS
3715600
-11.71
2372.20
1.51
lower side of the range and any positive trigger may pull
BHEL
25386000
-11.06
169.85
2.94
the index back to
7850-7900 mark. Seeing Index
IBREALEST
39402000
-10.89
58.10
3.66
Options data we believe, 7500 is a very strong support
SUNPHARMA
16860000
-6.67
761.30
-1.49
for the market. Traders are advised to take positions
MINDTREE
310000
-6.63
1422.25
-2.47
accordingly.
Put-Call Ratio
Historical Volatility
SCRIP
PCR-OI
PCR-VOL
SCRIP
HV
NIFTY
0.78
0.71
NCC
47.40
BANKNIFTY
1.05
0.82
AJANTPHARM
38.94
LT
0.52
0.50
GLENMARK
41.01
RELIANCE
0.51
0.56
L&TFH
27.67
DRREDDY
0.48
0.57
CESC
44.46
Strategy Date
Symbol
Strategy
Status
November 30, 2015
LT
Long Put
Active
December 07, 2015
BANKNIFTY
Raito Bear Put Spread
Active
2
Technical & Derivatives Report
December 10, 2015
FII Statistics for 09-December 2015
Turnover on 09-December 2015
Open Interest
No. of
Turnover
Change
Detail
Buy
Sell
Net
Instrument
Value
Change
Contracts
( in Cr. )
(%)
Contracts
(in Cr.)
(%)
INDEX
INDEX
1902.15
2024.75
(122.60)
265675
14836.91
3.95
261161
14373.28
32.21
FUTURES
FUTURES
INDEX
INDEX
18583.42
18556.49
26.93
1243071
70307.46
7.18
2642727
152894.27
24.49
OPTIONS
OPTIONS
STOCK
3256.27
3175.07
81.20
1001833
48247.53
0.68
STOCK
FUTURES
471797
23106.46
16.72
FUTURES
STOCK
STOCK
2013.95
2078.69
(64.74)
55590
2660.82
3.47
OPTIONS
266570
13605.73
27.97
OPTIONS
TOTAL
25755.79
25835.01
(79.21)
2566169
136052.71
4.14
TOTAL
3642255
203979.75
24.29
Nifty Spot = 7612.50
Lot Size = 25
Bull-Call Spreads
Bear-Put Spreads
Action
Strike
Price
Risk
Reward
BEP
Action
Strike
Price
Risk
Reward
BEP
Buy
7700
84.00
Buy
7600
96.85
36.25
63.75
7736.25
32.05
67.95
7567.95
Sell
7800
47.75
Sell
7500
64.80
Buy
7700
84.00
Buy
7600
96.85
58.75
141.25
7758.75
54.30
145.70
7545.70
Sell
7900
25.25
Sell
7400
42.55
Buy
7800
47.75
Buy
7500
64.80
22.50
77.50
7822.50
22.25
77.75
7477.75
Sell
7900
25.25
Sell
7400
42.55
Note: Above mentioned Bullish or Bearish Spreads in Nifty (Dec. Series) are given as an information and not as a recommendation.
Nifty Put-Call Analysis
3
Technical & Derivatives Report
December 10, 2015
Daily Pivot Levels for Nifty 50 Stocks
Scrips
S2
S1
PIVOT
R1
R2
ACC
1,288
1,301
1,321
1,333
1,353
ADANIPORTS
239
241
246
249
254
AMBUJACEM
184
187
191
194
198
ASIANPAINT
818
829
848
859
877
AXISBANK
440
445
453
458
466
BAJAJ-AUTO
2,326
2,358
2,415
2,446
2,503
BANKBARODA
157
159
161
163
165
BHARTIARTL
303
307
312
316
322
BHEL
164
166
169
171
174
BOSCHLTD
18,170
18,256
18,396
18,482
18,622
BPCL
853
868
892
906
930
CAIRN
123
124
127
128
131
CIPLA
605
614
630
639
654
COALINDIA
295
301
313
319
331
DRREDDY
2,918
2,956
2,990
3,029
3,063
GAIL
329
333
338
342
347
GRASIM
3,658
3,680
3,712
3,734
3,767
HCLTECH
830
837
847
854
864
HDFC
1,137
1,145
1,158
1,166
1,178
HDFCBANK
1,038
1,043
1,050
1,055
1,062
HEROMOTOCO
2,494
2,520
2,562
2,589
2,631
HINDALCO
71
73
74
75
77
HINDUNILVR
805
813
824
831
843
ICICIBANK
256
258
260
261
263
IDEA
129
132
134
136
138
INDUSINDBK
909
918
934
943
958
INFY
1,008
1,018
1,033
1,043
1,057
ITC
313
315
317
320
322
KOTAKBANK
660
664
670
675
681
LT
1,281
1,291
1,308
1,318
1,335
LUPIN
1,707
1,733
1,774
1,801
1,841
M&M
1,293
1,303
1,316
1,325
1,338
MARUTI
4,425
4,452
4,497
4,524
4,569
NTPC
127
129
130
132
134
ONGC
211
214
216
219
221
PNB
128
129
131
132
133
POWERGRID
128
129
130
132
133
RELIANCE
893
905
924
935
955
SBIN
231
233
235
237
240
VEDL
79
80
83
85
88
SUNPHARMA
736
748
762
773
787
TATAMOTORS
385
389
397
402
409
TATAPOWER
60
61
62
63
65
TATASTEEL
218
223
229
234
240
TCS
2,301
2,334
2,353
2,387
2,406
TECHM
518
522
530
535
542
ULTRACEMCO
2,729
2,756
2,809
2,836
2,889
WIPRO
556
561
567
572
579
YESBANK
700
708
722
730
743
ZEEL
387
392
397
402
408
4
Technical & Derivatives Report
December 10, 2015
Research Team Tel: 022 - 39357800
For Technical Queries
For Derivatives Queries
DISCLAIMER
Angel Broking Private Limited (hereinafter referred to as “Angel”) is a registered Member of National Stock Exchange of India Limited,
Bombay Stock Exchange Limited and MCX Stock Exchange Limited. It is also registered as a Depository Participant with CDSL and
Portfolio Manager with SEBI. It also has registration with AMFI as a Mutual Fund Distributor. Angel Broking Private Limited is a
registered entity with SEBI for Research Analyst in terms of SEBI (Research Analyst) Regulations, 2014 vide registration number
INH000000164. Angel or its associates has not been debarred/ suspended by SEBI or any other regulatory authority for accessing
/dealing in securities Market. Angel or its associates including its relatives/analyst do not hold any financial interest/beneficial
ownership of more than 1% in the company covered by Analyst. Angel or its associates/analyst has not received any compensation /
managed or co-managed public offering of securities of the company covered by Analyst during the past twelve months. Angel/analyst
has not served as an officer, director or employee of company covered by Analyst and has not been engaged in market making activity
of the company covered by Analyst.
This document is solely for the personal information of the recipient, and must not be singularly used as the basis of any investment
decision. Nothing in this document should be construed as investment or financial advice. Each recipient of this document should
make such investigations as they deem necessary to arrive at an independent evaluation of an investment in the securities of the
companies referred to in this document (including the merits and risks involved), and should consult their own advisors to determine
the merits and risks of such an investment.
Reports based on technical and derivative analysis center on studying charts of a stock's price movement, outstanding positions and
trading volume, as opposed to focusing on a company's fundamentals and, as such, may not match with a report on a company's
fundamentals.
The information in this document has been printed on the basis of publicly available information, internal data and other reliable
sources believed to be true, but we do not represent that it is accurate or complete and it should not be relied on as such, as this
document is for general guidance only. Angel Broking Pvt. Limited or any of its affiliates/ group companies shall not be in any way
responsible for any loss or damage that may arise to any person from any inadvertent error in the information contained in this report.
Angel Broking Pvt. Limited has not independently verified all the information contained within this document. Accordingly, we cannot
testify, nor make any representation or warranty, express or implied, to the accuracy, contents or data contained within this document.
While Angel Broking Pvt. Limited endeavors to update on a reasonable basis the information discussed in this material, there may be
regulatory, compliance, or other reasons that prevent us from doing so.
This document is being supplied to you solely for your information, and its contents, information or data may not be reproduced,
redistributed or passed on, directly or indirectly.
Neither Angel Broking Pvt. Limited, nor its directors, employees or affiliates shall be liable for any loss or damage that may arise from
or in connection with the use of this information.
Note: Please refer to the important ‘Stock Holding Disclosure' report on the Angel website (Research Section). Also, please refer to the
latest update on respective stocks for the disclosure status in respect of those stocks. Angel Broking Pvt. Limited and its affiliates may
have investment positions in the stocks recommended in this report.
5